Denison Mines announces $250 million convertible notes offering

Introduction & Market Context
Bain Capital Specialty Finance , Inc. (NYSE:BCSF) released its first quarter 2025 earnings presentation, highlighting solid performance despite a challenging interest rate environment. The business development company (BDC) reported net investment income (NII) of $0.50 per share for the quarter ended March 31, 2025, maintaining its $0.45 quarterly dividend ($0.42 regular plus $0.03 special) despite experiencing some yield compression.
BCSF shares closed at $15.24 on May 5, 2025, representing a 1.17% decline for the day. The stock currently trades significantly below its 52-week high of $19.21 but well above its 52-week low of $13.20.
Quarterly Performance Highlights
BCSF reported net investment income of $0.50 per share for Q1 2025, representing an annualized NII yield on book value of 11.3%. This marks a slight decrease from $0.52 per share in the previous quarter. Net income per share was $0.44, equating to an annualized return on book value of 10.0%.
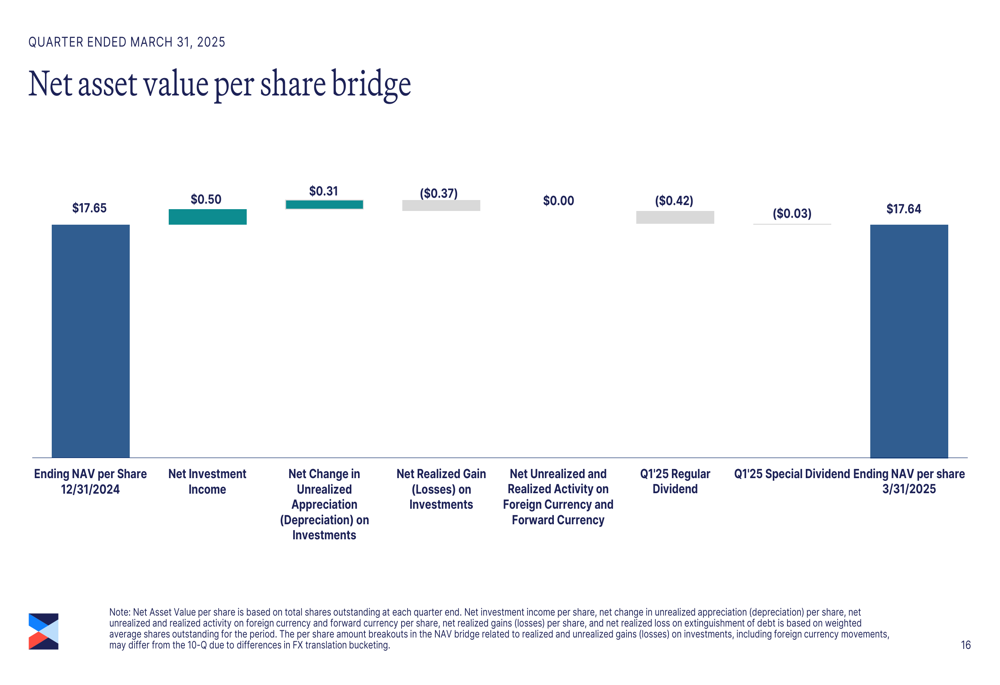
The company’s net asset value (NAV) per share remained relatively stable at $17.64 as of March 31, 2025, compared to $17.65 at the end of 2024. This stability comes despite significant market volatility during the quarter.
As shown in the following quarterly operating results table, BCSF has maintained consistent performance over the past five quarters, though with a gradual decline in NII per share:
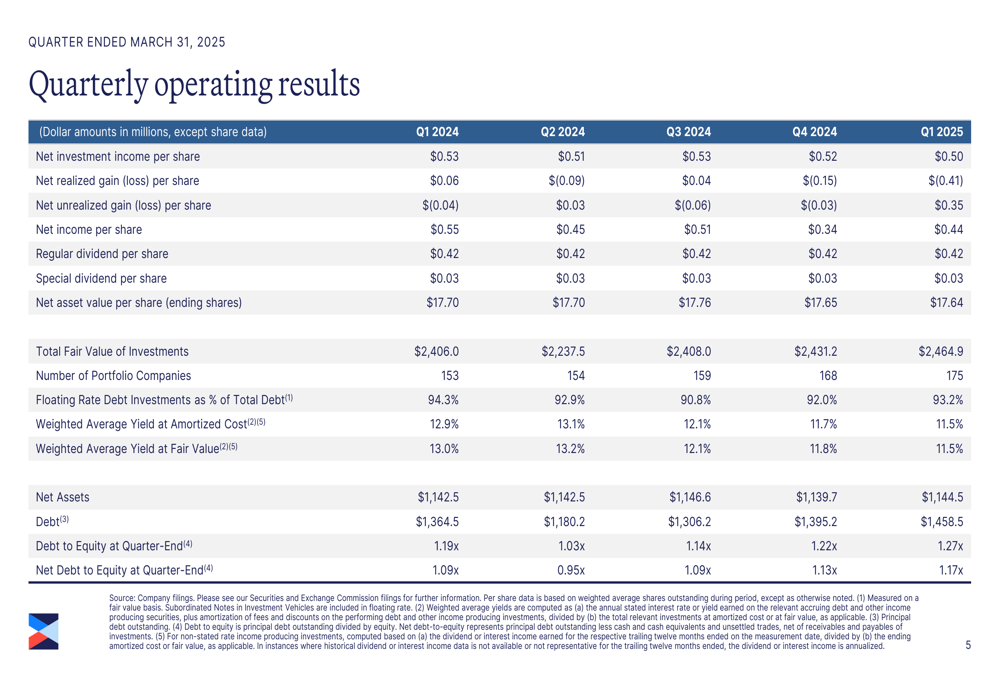
The company’s investment portfolio grew to $2.46 billion at fair value, consisting predominantly of senior secured, floating rate loans across 175 portfolio companies operating in 29 different industries. This represents continued portfolio expansion from 168 companies in the previous quarter and 153 companies a year ago.
Portfolio Composition and Credit Quality
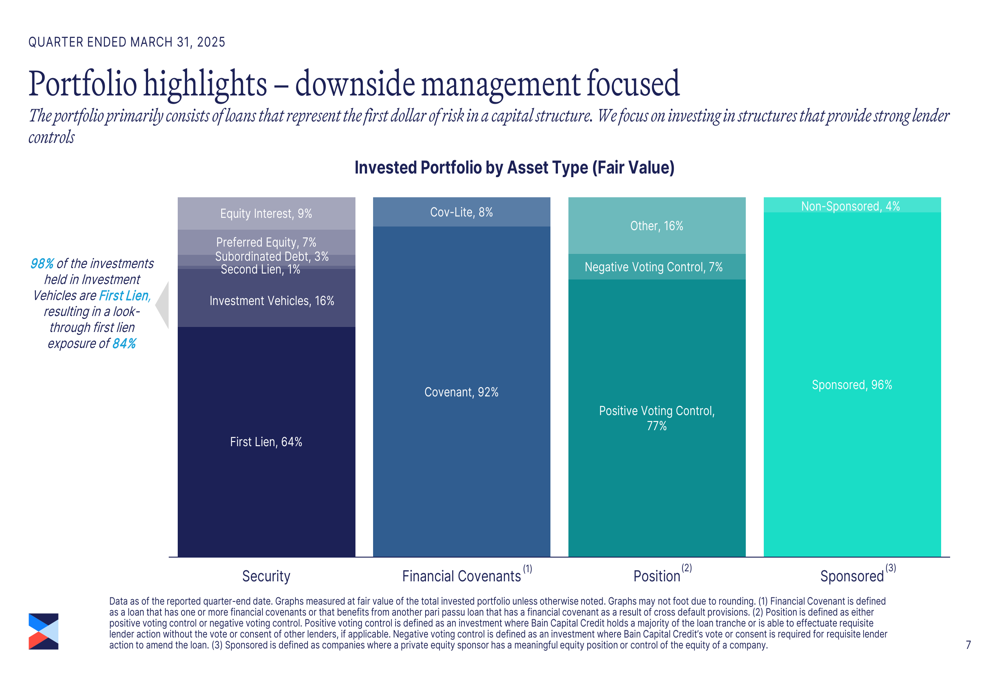
BCSF maintains a strong focus on downside protection, with 64% of investments in first lien senior secured loans and an additional 16% in investment vehicles. When accounting for the first lien exposure within these investment vehicles, the company’s look-through first lien exposure reaches 84%.
The following chart illustrates BCSF’s portfolio composition and downside protection strategy:
Portfolio diversification remains a key strength, with investments spread across multiple industries and geographies. Business services represents the largest industry concentration at 29%, followed by telecommunications at 11% and high tech industries at 7%.
As shown in the following diversification breakdown, the portfolio is well-balanced across sectors and regions:
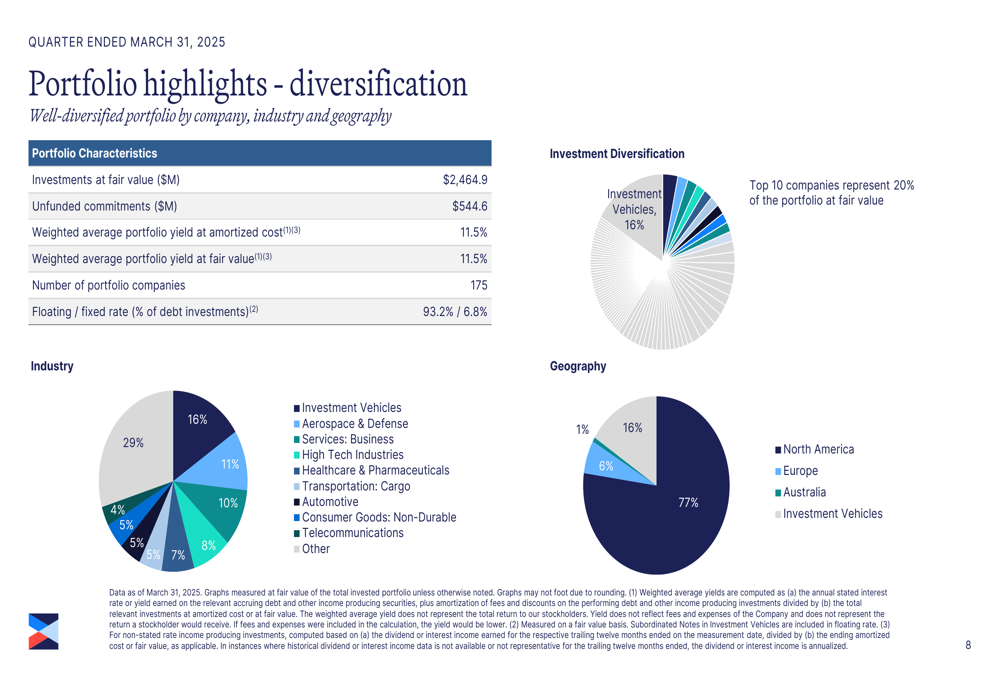
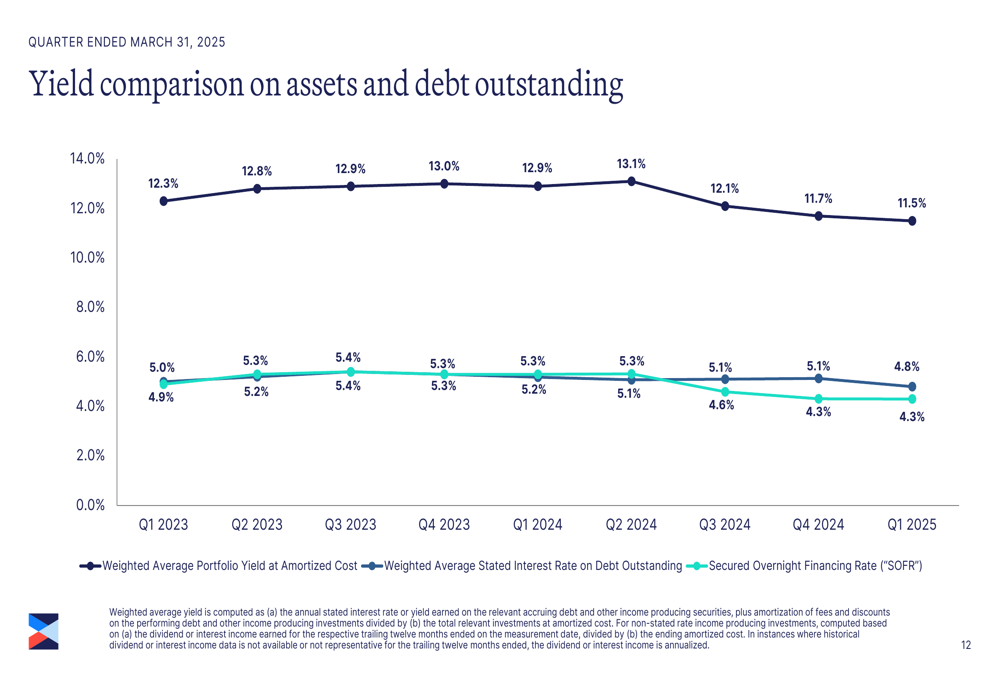
Credit quality remains solid, with investments on non-accrual representing just 1.4% and 0.7% of the total investment portfolio at amortized cost and fair value, respectively. The portfolio’s weighted average yield at amortized cost was 11.5%, down from 11.7% in the previous quarter and 12.9% a year ago, reflecting the broader interest rate environment.
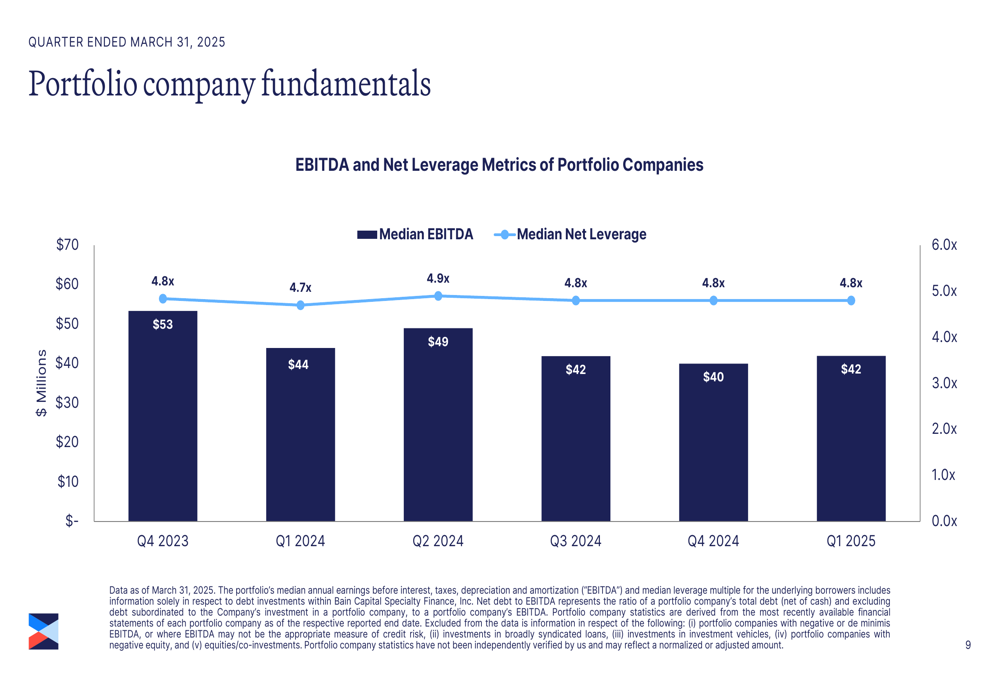
The following chart shows the trend in portfolio company fundamentals, with median EBITDA slightly increasing to $42 million from $40 million in the previous quarter, while median net leverage remained stable at 4.8x:
Liquidity and Capital Structure
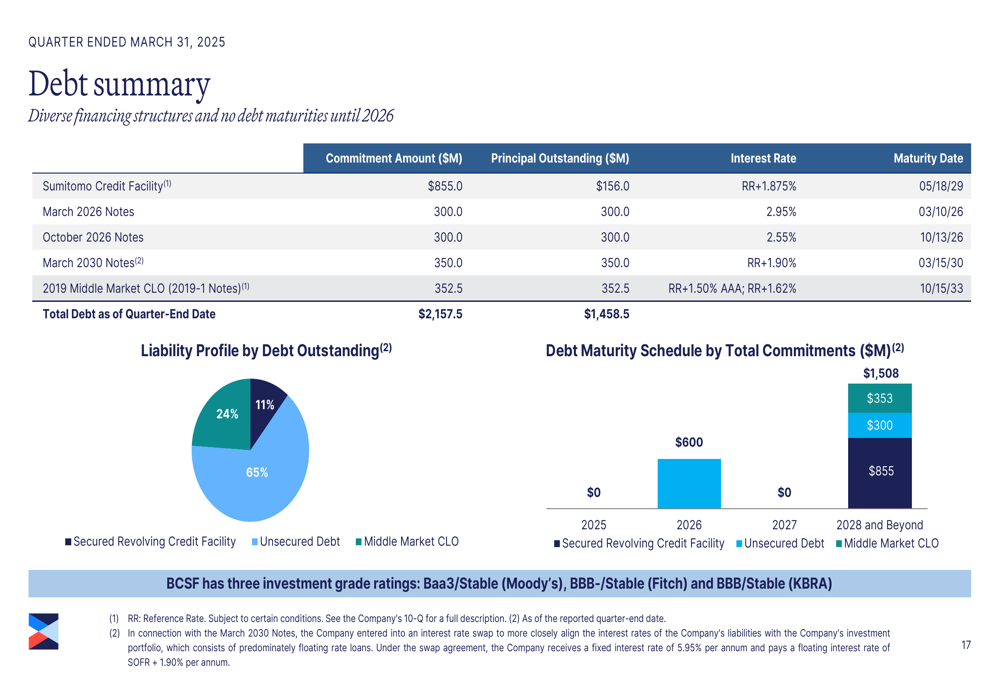
BCSF ended the quarter with a net debt-to-equity ratio of 1.17x, slightly up from 1.13x at the end of 2024. The company closed an offering of $350.0 million aggregate principal amount of 5.950% unsecured notes due 2030, enhancing its debt maturity profile.
The company maintains strong liquidity totaling $823 million, including $699 million of undrawn capacity on its revolving credit facility and $94 million of cash and cash equivalents.
The following debt summary provides a comprehensive overview of BCSF’s capital structure:
The spread between the company’s portfolio yield and its cost of debt has narrowed but remains favorable, as illustrated in the following chart:
Dividend and Shareholder Returns
BCSF declared a regular dividend of $0.42 per share plus a special dividend of $0.03 per share for the second quarter of 2025, maintaining its consistent distribution policy. The company’s NII of $0.50 per share comfortably covers the total dividend of $0.45, resulting in a coverage ratio of 111%.
The following NAV bridge illustrates the components affecting the company’s book value during the quarter:
Forward Outlook
While BCSF continues to navigate a challenging interest rate environment with some compression in portfolio yields, the company’s focus on senior secured loans, portfolio diversification, and prudent leverage management positions it well for the future.
The company’s investment strategy remains centered on downside protection through first lien senior secured loans, covenant protection, and sponsor-backed transactions. With strong liquidity and a well-structured debt maturity profile, BCSF appears well-positioned to capitalize on new investment opportunities while maintaining its dividend policy.
Investors should monitor the trend in portfolio yields, which have declined from 12.9% a year ago to 11.5% currently, as well as the gradual increase in leverage. However, the company’s investment-grade ratings from Moody’s (Baa3/Stable), Fitch (BBB-/Stable), and KBRA (BBB/Stable) reflect its solid financial position and risk management practices.
Full presentation:
This article was generated with the support of AI and reviewed by an editor. For more information see our T&C.