Gold prices edge up amid Fed rate cut hopes; US-Russia talks awaited

Introduction & Market Context
Bank of America Corp (NYSE:BAC) reported strong first-quarter 2025 financial results on April 15, with performance exceeding analyst expectations across key metrics. The bank’s stock responded positively, rising 4.1% to $38.18 following the announcement, as investors welcomed the robust earnings growth and healthy balance sheet metrics.
The results come amid a period of economic uncertainty, with concerns about potential policy changes and their impact on growth. Despite these headwinds, Bank of America demonstrated resilience across its diversified business model, continuing to grow its customer base and expand its deposit franchise.
Quarterly Performance Highlights
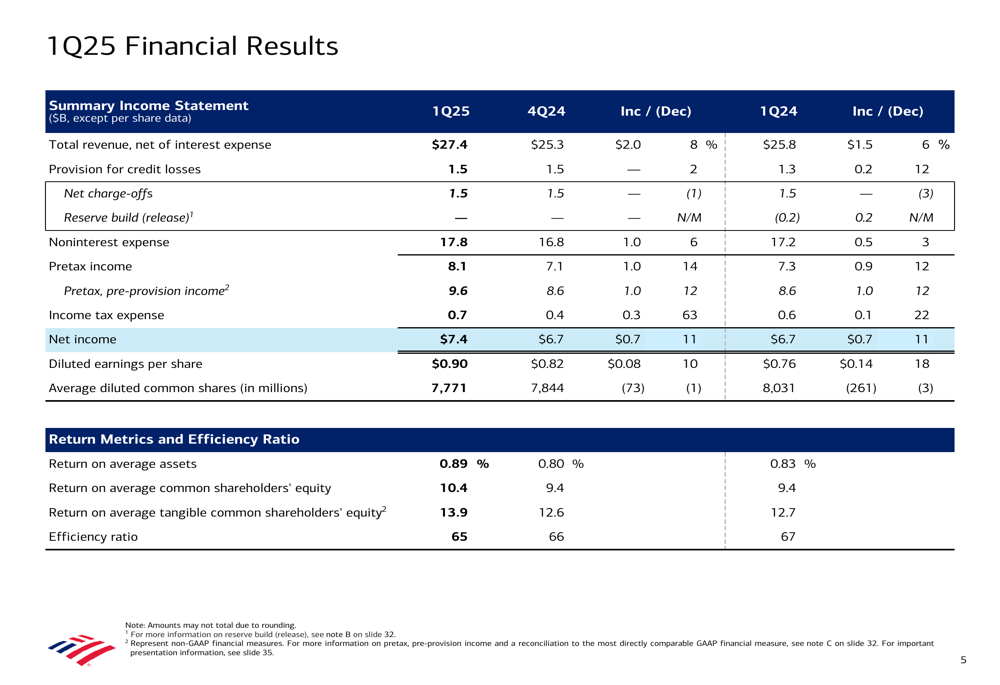
Bank of America delivered impressive financial results for the first quarter of 2025, with substantial year-over-year improvements across key metrics. Revenue increased to $27.4 billion, representing a 6% growth compared to Q1 2024. Net income rose 11% to $7.4 billion, while earnings per share grew 18% to $0.90, significantly outpacing analyst expectations of $0.82.
As shown in the following summary of Q1 2025 financial highlights:
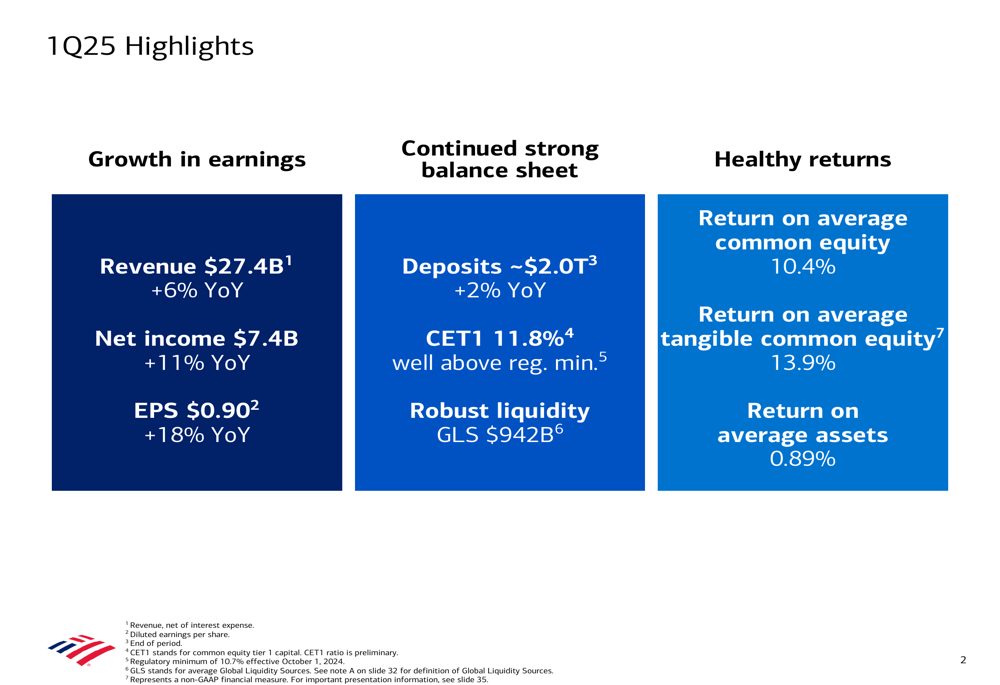
The bank maintained strong returns with a Return on Average Common Equity of 10.4% and Return on Average Tangible Common Equity of 13.9%. The Return on Average Assets stood at 0.89%, reflecting efficient use of the bank’s balance sheet. These metrics demonstrate Bank of America’s ability to generate solid returns despite the challenging interest rate environment.
The income statement details reveal consistent improvement across multiple revenue streams, with both net interest income and noninterest income contributing to overall growth:
Organic Growth Momentum
A key driver of Bank of America’s performance has been its continued ability to attract new customers and deepen existing relationships. The bank has now achieved 25 consecutive quarters of net new checking account growth, adding approximately 250,000 accounts in Q1 alone. Additionally, the bank added around 1 million new credit card accounts during the quarter.
The following slide illustrates the organic growth across different business segments:
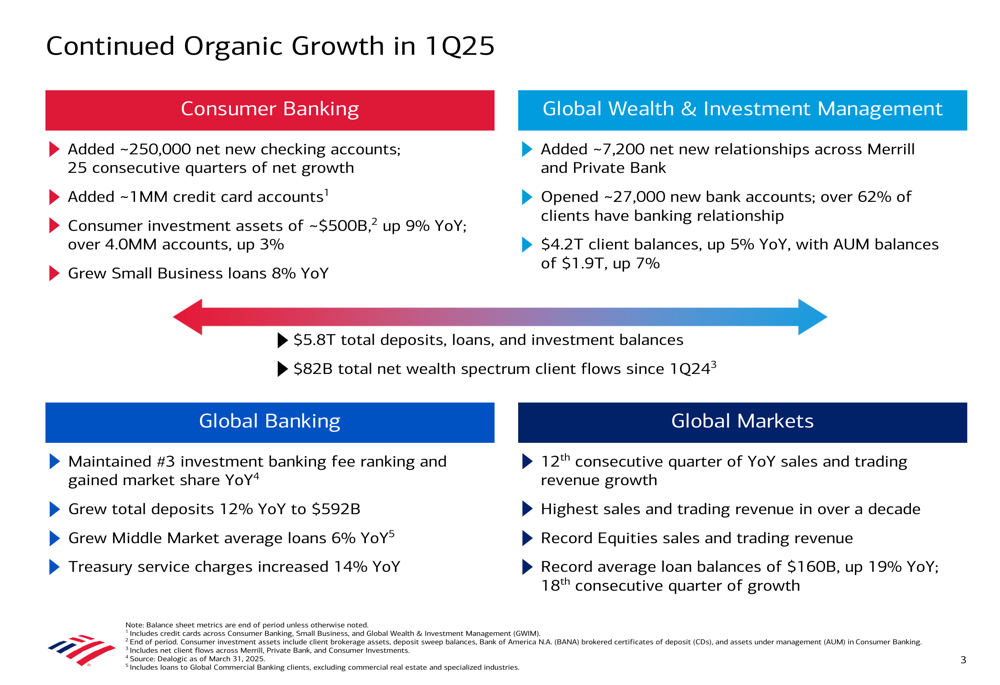
Consumer spending remained resilient, with total payment volume reaching $1.1 trillion in Q1 2025, up 4% year-over-year. This growth occurred despite broader economic concerns, suggesting continued strength in consumer financial health.
Segment Performance
Bank of America’s diversified business model showed strength across all major segments, with each contributing to the overall positive results.
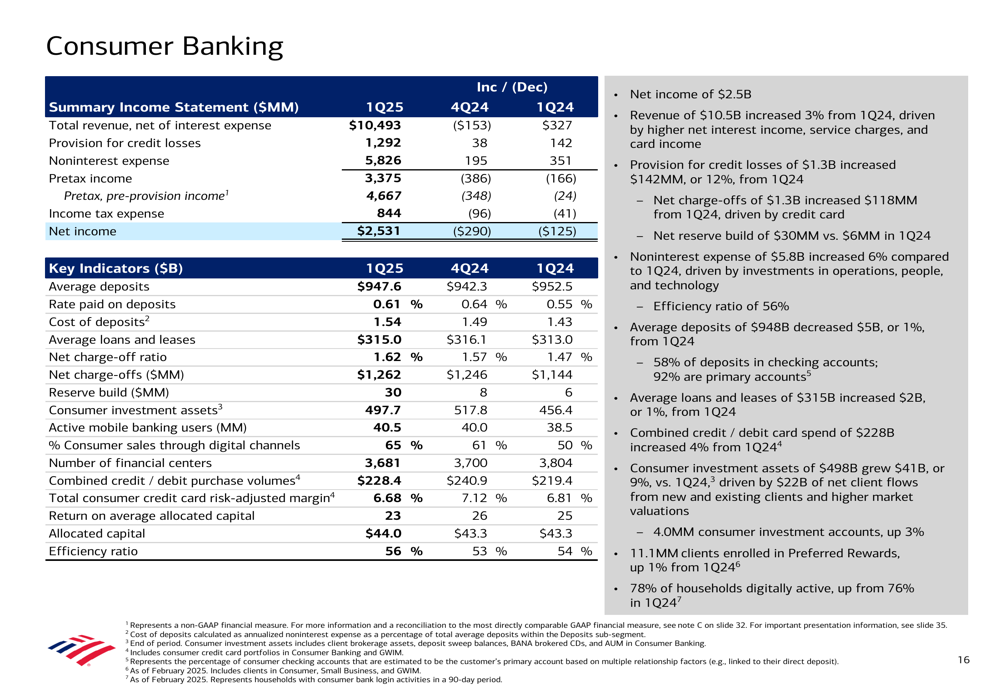
Consumer Banking generated $10.5 billion in revenue and $2.5 billion in net income. The segment benefited from growth in both net interest income and fee revenue from cards and service charges. Consumer investment assets grew 9% year-over-year to $498 billion, reflecting both market appreciation and continued inflows.
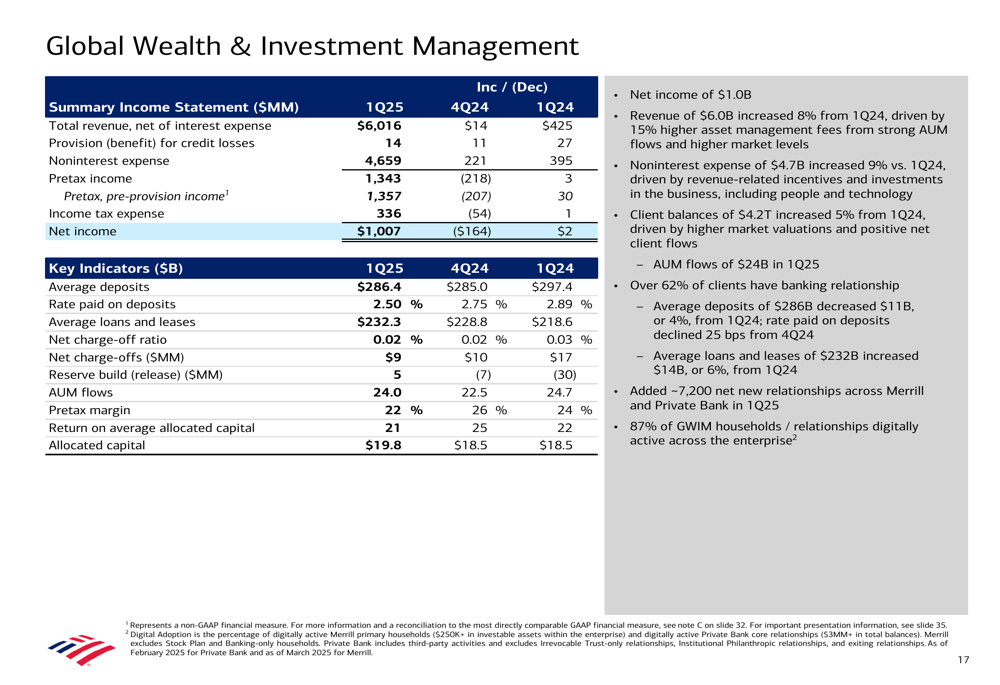
Global Wealth & Investment Management delivered another strong quarter with $6 billion in revenue, growing 8% over the prior year. This growth was led by a 15% increase in asset management fees. The segment’s net income reached $1 billion, with client balances increasing to $4.2 trillion, up 5% year-over-year.
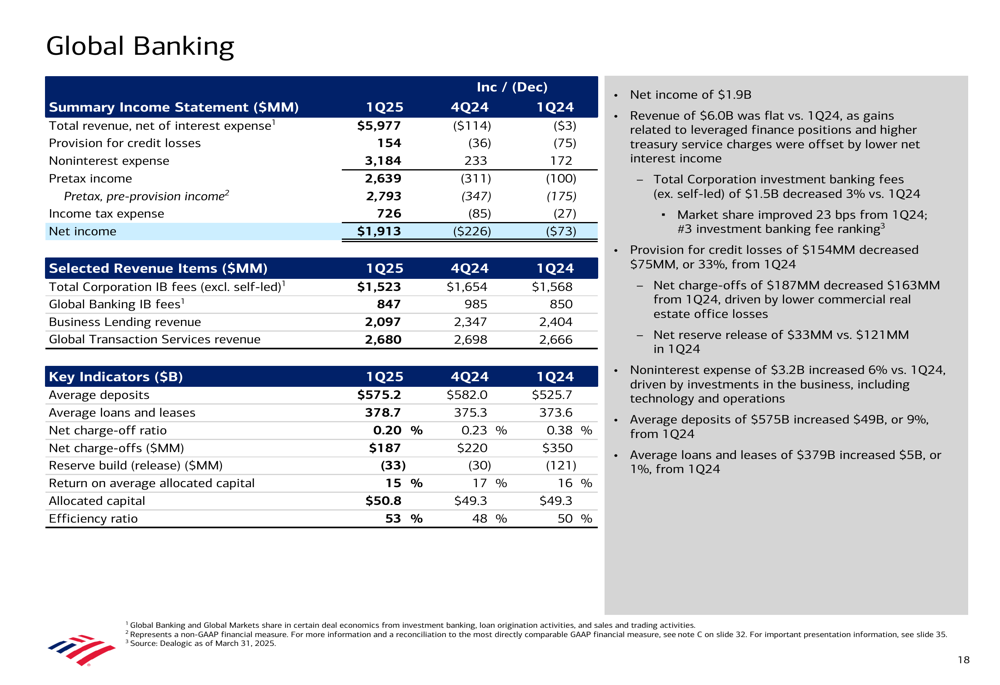
Global Banking reported revenue of $6 billion, with strong growth in treasury services revenue. The segment maintained its number three position in investment banking fees, generating $1.5 billion in the first quarter. Average deposits grew 9% year-over-year, showing strong client activity.
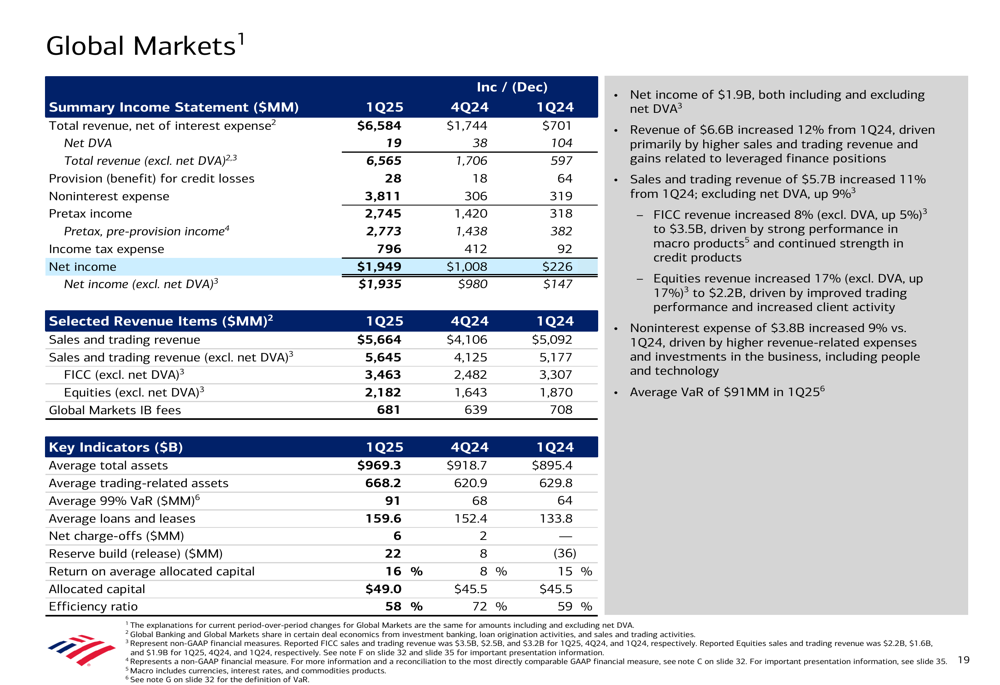
Global Markets continued its impressive performance streak, marking the 12th consecutive quarter of year-over-year sales and trading revenue growth. Revenue improved 10% from Q1 2024, with equities leading the way with 17% growth, while FICC (Fixed Income, Currencies, and Commodities) grew 5%.
Balance Sheet & Capital Position
Bank of America’s balance sheet remained robust, with total assets of $3.35 trillion at quarter-end. Deposits reached nearly $2 trillion, growing 2% year-over-year and marking the seventh consecutive quarter of growth. The bank maintained strong liquidity with Global Liquidity Sources of $942 billion.
The following slide provides a comprehensive overview of the bank’s balance sheet, liquidity, and capital metrics:
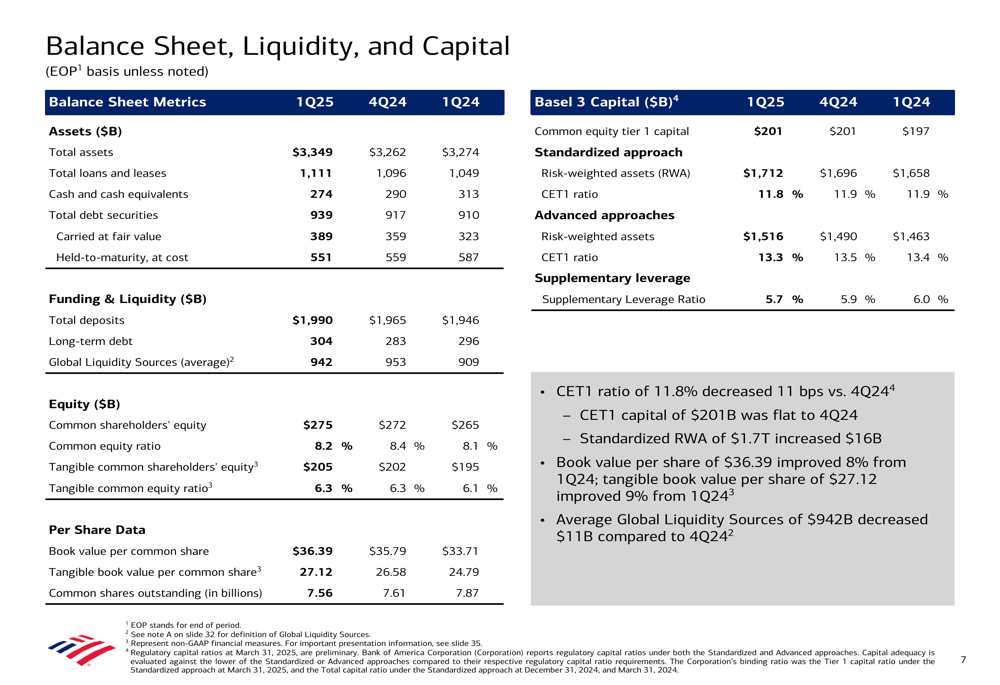
The bank’s capital position remained strong, with a Common Equity Tier 1 (CET1) ratio of 11.8%, well above the regulatory minimum. This strong capital position allowed Bank of America to return $6.5 billion to shareholders during the quarter, including $2 billion in common dividends and $4.5 billion in share repurchases.
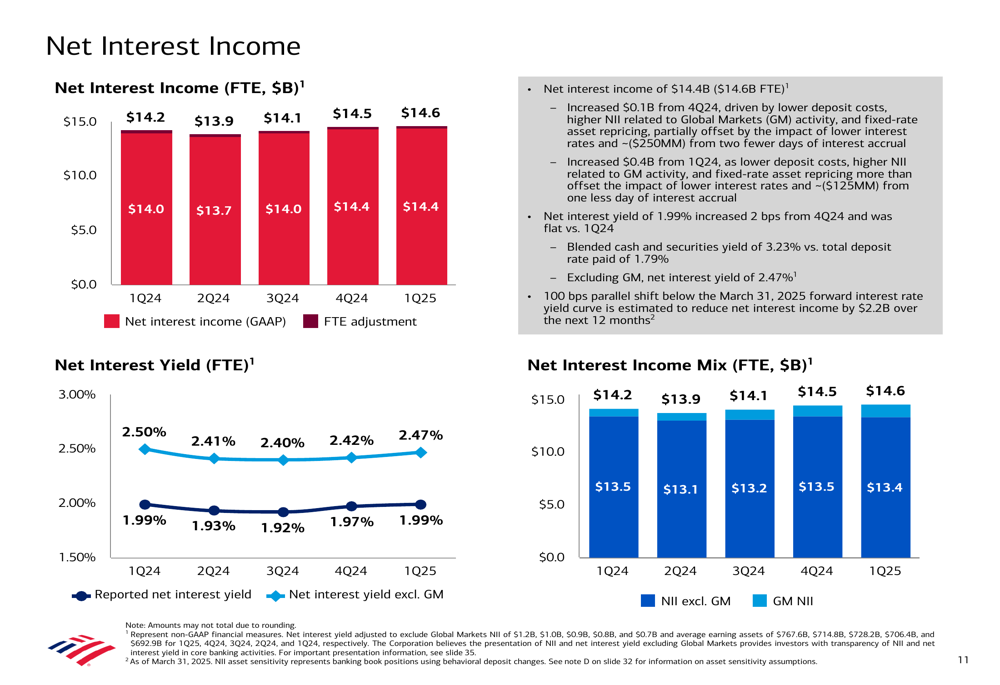
Net interest income (NII) showed positive momentum, increasing 3% year-over-year to $14.4 billion. The bank expects continued improvement in NII throughout 2025, projecting a Q4 2025 exit rate between $15.5 billion and $15.7 billion, implying full-year NII growth of 6-7%.
Asset Quality & Risk Management
Bank of America’s asset quality remained sound, with net charge-offs of $1.45 billion, modestly down compared to Q4 2024. The total net charge-off ratio was 54 basis points, unchanged from the previous quarter. Consumer delinquencies improved from Q4 2024, suggesting potential for slightly lower charge-offs in the coming quarter.
The bank’s provision expense for the quarter was $1.5 billion, matching net charge-offs. Management indicated they feel well-reserved for the current economic environment, with reserves positioned for an unemployment rate of approximately 6%.
Outlook & Forward Guidance
Looking ahead, Bank of America maintained its previous guidance for net interest income, projecting a Q4 2025 exit rate of $15.5-15.7 billion despite incorporating expectations for four interest rate cuts in 2025. This outlook reflects the bank’s confidence in its ability to grow loans and deposits while benefiting from fixed-rate asset repricing.
For full-year expenses, management expects growth of 2-3% compared to 2024, potentially trending toward the higher end of that range depending on fee revenue performance. The tax rate for the full year 2025 is expected to be in the range of 11-13%, excluding unusual items.
The bank’s management emphasized its strong positioning to weather potential economic challenges, highlighting the significant improvements in its risk profile compared to previous periods of economic stress. The loan portfolio is now more balanced between commercial and consumer segments, with greater geographic diversification and improved credit quality.
Conclusion
Bank of America’s Q1 2025 results demonstrate the strength and resilience of its diversified business model. The bank delivered impressive growth in revenue, earnings, and EPS while maintaining a strong balance sheet and capital position. Organic growth across all business segments, combined with disciplined expense management, positions the bank well for continued success despite economic uncertainties.
With its strong capital position, Bank of America has the flexibility to continue investing in growth opportunities while returning significant capital to shareholders. The bank’s consistent execution of its responsible growth strategy has created a more resilient institution capable of navigating various economic environments while continuing to serve its clients effectively.
Full presentation:
This article was generated with the support of AI and reviewed by an editor. For more information see our T&C.