Bullish indicating open at $55-$60, IPO prices at $37

Introduction & Market Context
Bank of Hawai’i Corporation (NYSE:BOH) presented its first quarter 2025 financial results on April 21, 2025, highlighting continued improvement in net interest margin and strong market position in its core Hawaiian market. Despite a challenging interest rate environment, the bank reported solid performance metrics with expanding margins and stable credit quality.
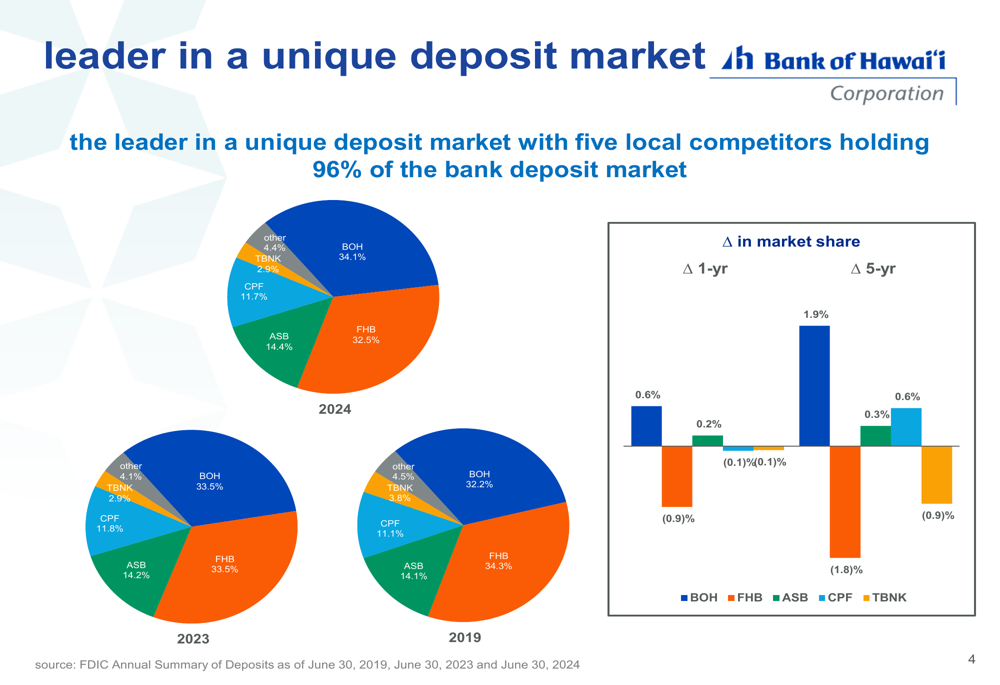
The bank operates in a unique, concentrated market where five local competitors hold 96% of deposits, with BOH maintaining the largest market share at 34.1%. This concentrated market structure provides BOH with competitive advantages in a region characterized by stable real estate prices and low unemployment.
As shown in the following chart of Bank of Hawai’i’s market position, the bank has consistently gained market share over both one-year and five-year periods:
Quarterly Performance Highlights
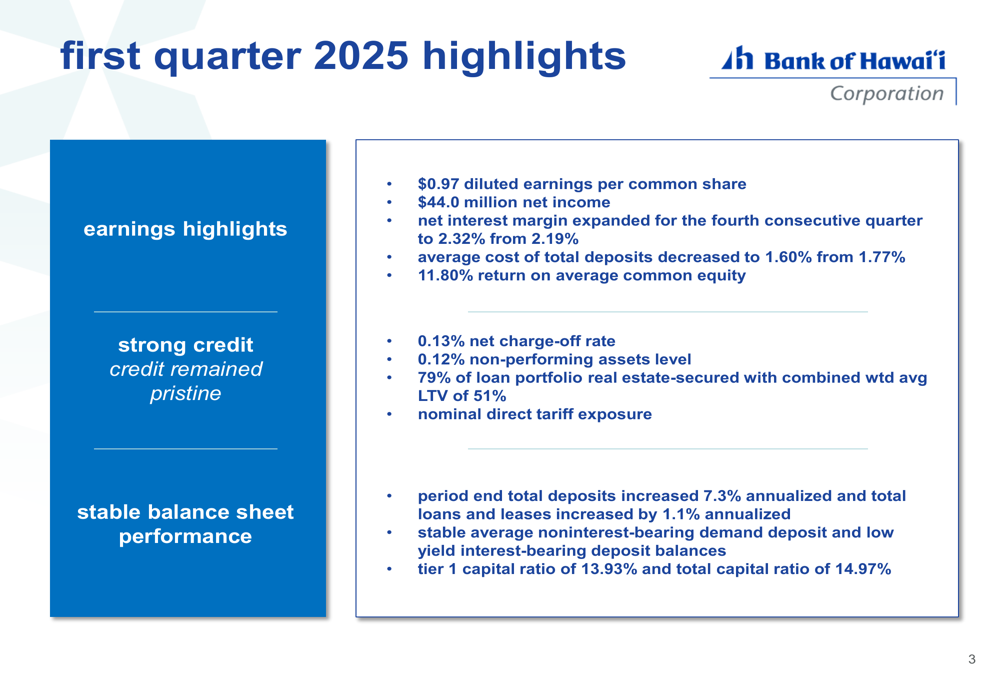
Bank of Hawai’i reported diluted earnings per share of $0.97 for Q1 2025, exceeding analyst expectations of $0.89. Net income reached $44.0 million, representing a $4.8 million increase from the previous quarter. The bank’s return on average common equity improved to 11.80%, up from 10.3% in the prior quarter.
A key driver of the improved performance was the expansion of net interest margin (NIM) to 2.32%, marking the fourth consecutive quarter of margin improvement. This expansion was supported by a decrease in the average cost of total deposits to 1.60% from 1.77% in the previous quarter.
The following image illustrates the bank’s first quarter 2025 highlights, including earnings metrics, credit quality, and balance sheet performance:
Financial Trends and Outlook
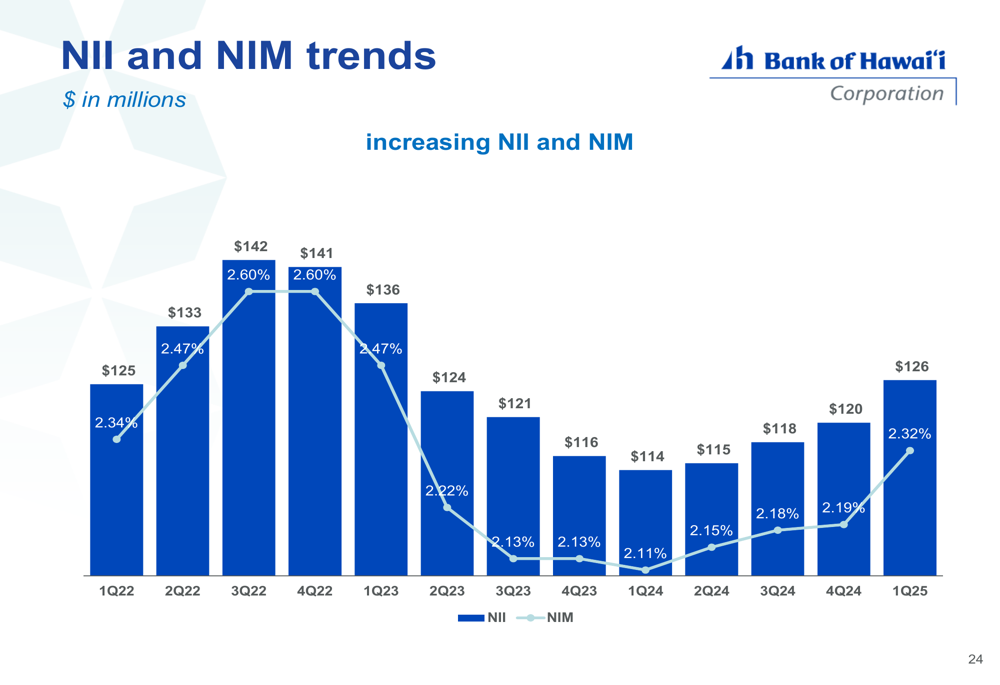
The bank’s net interest income (NII) showed positive momentum, increasing to $126 million in Q1 2025 from $120 million in Q4 2024. This upward trend in NII, coupled with the expanding NIM, suggests improving profitability metrics for the bank.
As shown in the following chart tracking NII and NIM trends, both metrics have been improving in recent quarters after bottoming in early 2024:
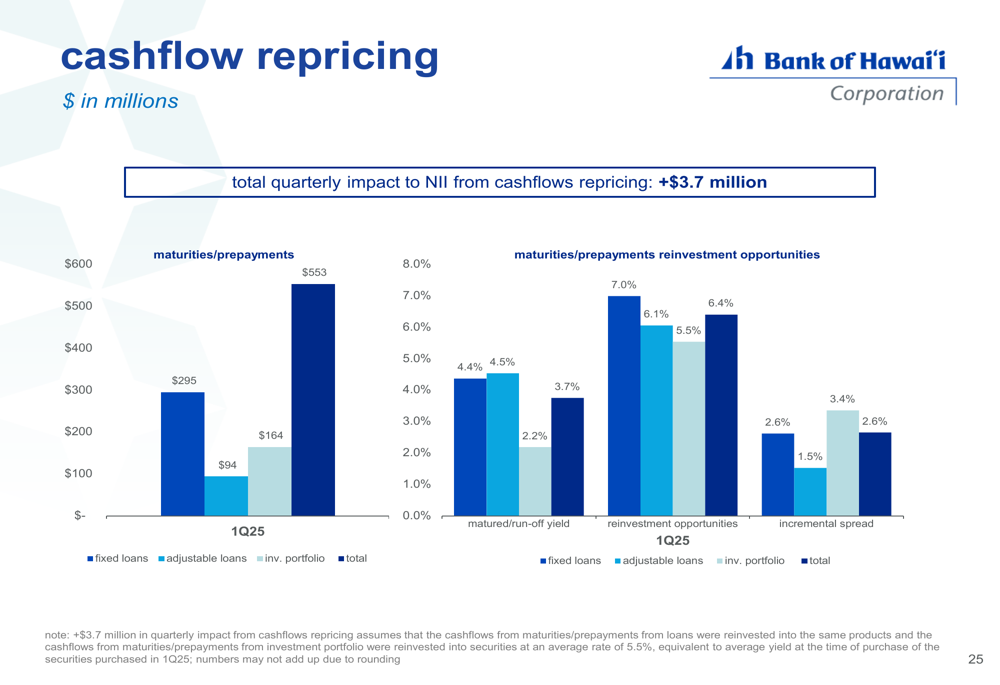
The positive impact of cashflow repricing contributed $3.7 million to net interest income during the quarter. The bank is benefiting from higher yields on reinvestment opportunities compared to maturing assets, particularly in the investment portfolio where the incremental spread is 3.4%.
This repricing benefit is illustrated in the following chart:
Looking forward, Bank of Hawai’i expects loan growth in the low single digits and aims for a net interest margin target of 2.50% by year-end. The bank also declared a dividend of $0.70 per common share for Q2, maintaining its 54-year track record of consecutive dividend payments.
Deposit Market Leadership
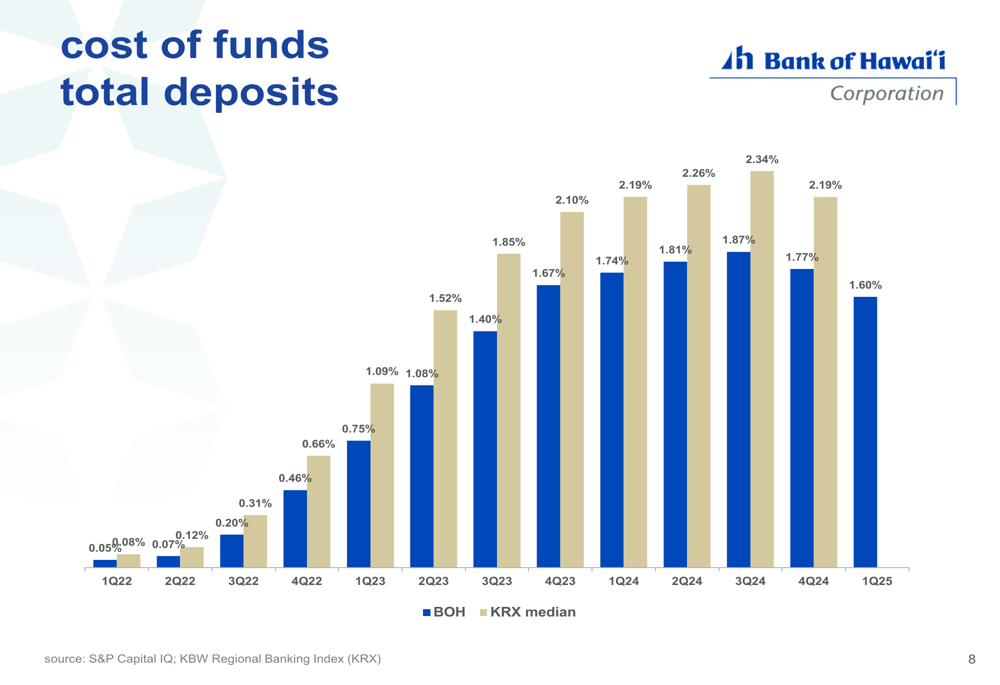
Bank of Hawai’i maintained stable deposit balances at $20.7 billion in Q1 2025, with a favorable composition of $5.3 billion in non-interest-bearing deposits and $15.4 billion in interest-bearing deposits. The bank’s deposit costs have consistently remained below industry benchmarks, providing a competitive advantage.
The bank’s total deposit cost decreased to 1.60% in Q1 2025 from 1.77% in Q4 2024, continuing a downward trend that began in Q3 2024. This decrease in funding costs has been a significant contributor to the expansion in net interest margin.
As illustrated in the following chart, Bank of Hawai’i’s deposit costs have consistently remained below the KRX median:
Loan Portfolio Composition
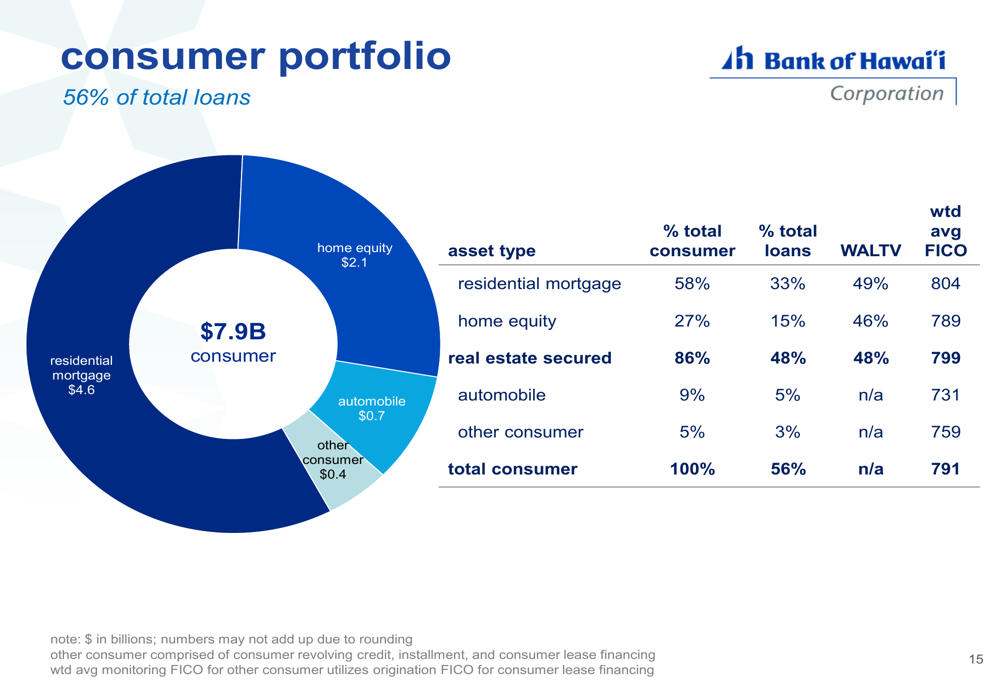
Bank of Hawai’i maintains a well-diversified loan portfolio with a strong emphasis on real estate-secured lending. The consumer portfolio represents 56% of total loans ($7.9 billion), while the commercial portfolio accounts for 44% ($6.2 billion).
The following chart details the composition of the consumer portfolio, which is predominantly composed of residential mortgages and home equity loans:
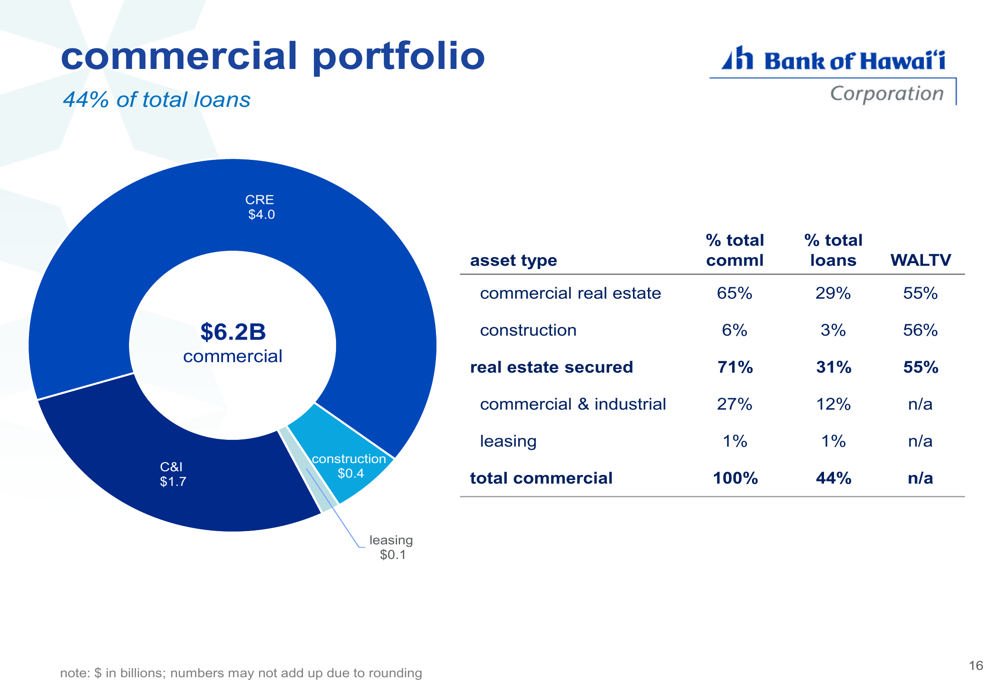
The commercial portfolio is similarly well-diversified, with commercial real estate (CRE) representing the largest component at 65% of commercial loans:
A key strength of Bank of Hawai’i’s lending strategy is its geographic concentration in its core market, with 93% of lending in Hawai’i, 4% in the West Pacific, and 3% in the U.S. Mainland. This focus on its home market, where the bank has deep relationships and market knowledge, contributes to the strong credit quality of the portfolio.
Credit Quality and Risk Management
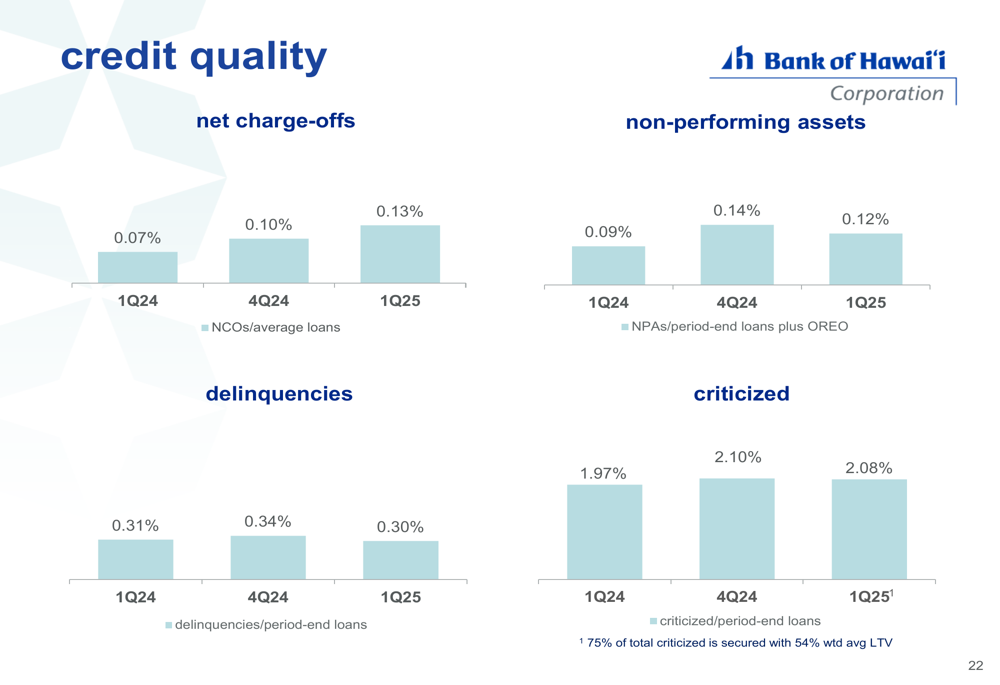
Bank of Hawai’i maintained strong credit metrics in Q1 2025, with a net charge-off rate of 0.13% and non-performing assets at 0.12% of total assets. These figures reflect the bank’s conservative underwriting standards and the stability of the Hawaiian real estate market.
The following chart illustrates the bank’s credit quality metrics over recent quarters:
The bank’s loan portfolio benefits from strong collateral positions, with 79% of the portfolio secured by real estate with a combined weighted average loan-to-value ratio of just 51%. This conservative positioning provides significant protection against potential market downturns.
In the commercial real estate segment, which represents 29% of total loans, the bank maintains a well-diversified portfolio with low exposure to office properties (3% of total loans) and a weighted average loan-to-value ratio of 55%.
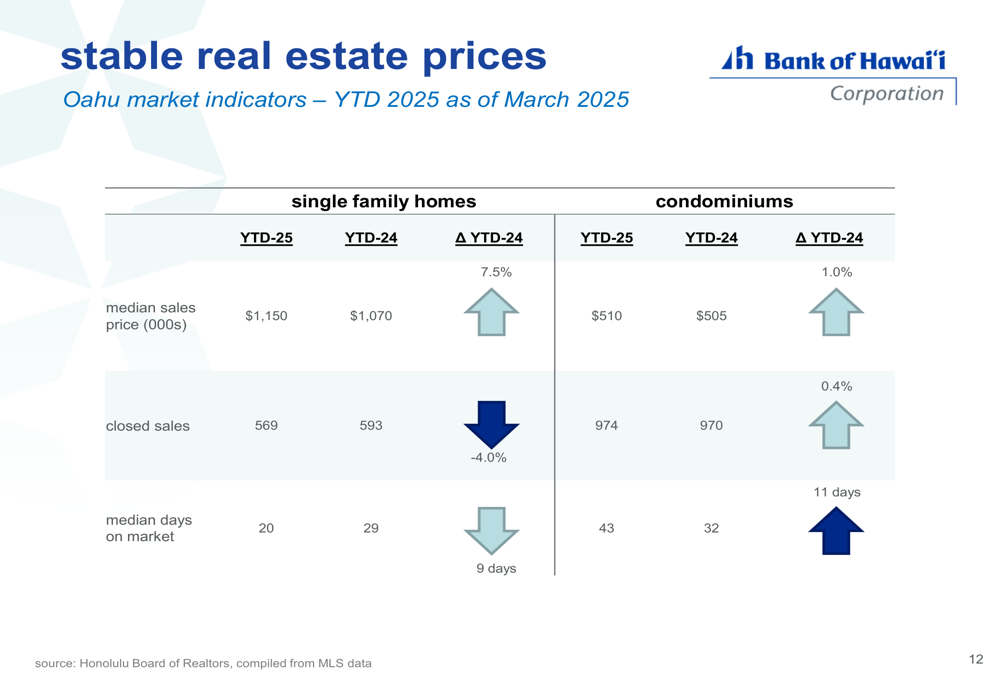
The Hawai’i real estate market continues to show stability, with single-family home median sales prices increasing by 7.5% year-to-date to $1,150,000, while condominium prices rose 1.0% to $510,000. This stable real estate environment supports the quality of the bank’s loan portfolio.
As shown in the following table of Oahu real estate market indicators:
Despite the slight dip of 0.92% in Bank of Hawai’i’s stock price to $65.73 following the earnings announcement, the bank’s strong financial performance and conservative risk management position it well for continued success in its unique island market.
Full presentation:
This article was generated with the support of AI and reviewed by an editor. For more information see our T&C.