China AI: Bernstein sees chipmakers benefiting from Nvidia scrutiny

Introduction & Market Context
Bankwell Financial Group Inc (NASDAQ:BWFG) released its first quarter 2025 investor presentation on April 24, highlighting significant improvements in profitability, credit quality, and balance sheet positioning. The Connecticut-based bank reported substantial year-over-year earnings growth while continuing to reduce its reliance on brokered deposits and strengthen its capital position.
The bank’s performance comes amid market expectations for potential interest rate cuts, with Bankwell positioning its balance sheet to benefit from this scenario. Trading at $30.40, the stock sits closer to its 52-week high of $35.25 than its low of $22.70, reflecting investor confidence in the company’s strategic direction.
Quarterly Performance Highlights
Bankwell reported fully diluted earnings per share of $0.87 for Q1 2025, representing an impressive 81% increase compared to the same quarter last year. The bank’s net interest margin expanded to 2.81%, up 21 basis points from the previous quarter, driven by lower deposit costs and improved asset yields.
Pre-provision net revenue (PPNR) reached $9.4 million or $1.22 per share, an 11% increase from the previous quarter. Non-interest income rose 56% quarter-over-quarter, boosted by $442,000 in SBA (LON:SBA) loan sale gains.
As shown in the comprehensive GAAP results table below, Bankwell has demonstrated consistent improvement in key metrics over the past several quarters:
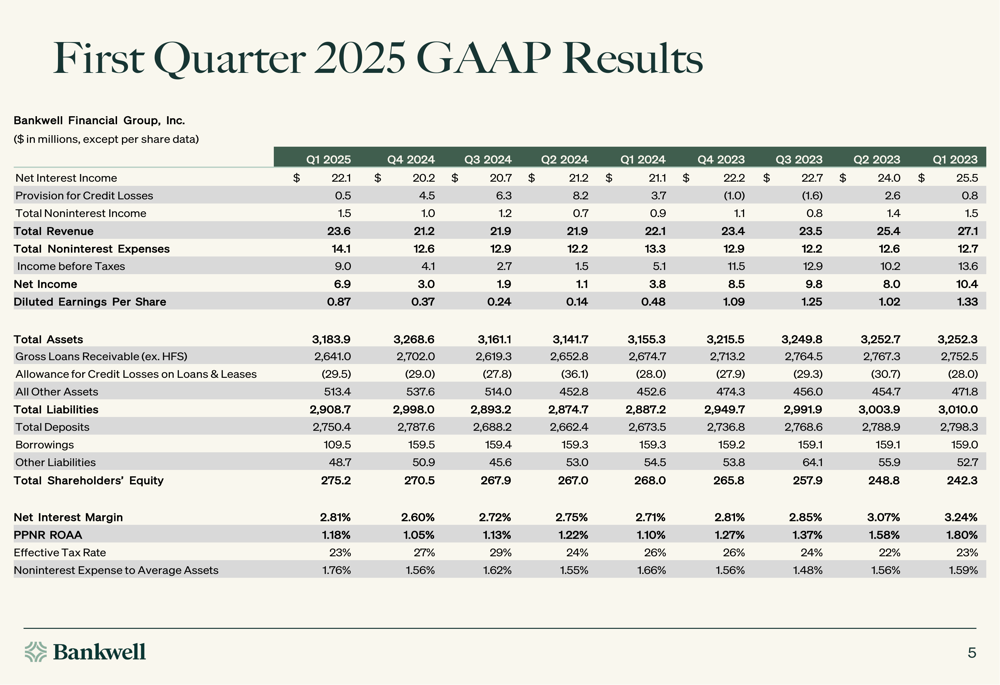
Credit quality showed marked improvement, with non-performing assets (NPAs) decreasing to 0.83% of total assets, down 105 basis points from the previous quarter. This reduction was primarily due to the successful disposition of a $27.1 million CRE multifamily non-performing loan and an $8.3 million other real estate owned (OREO) asset.
Detailed Financial Analysis
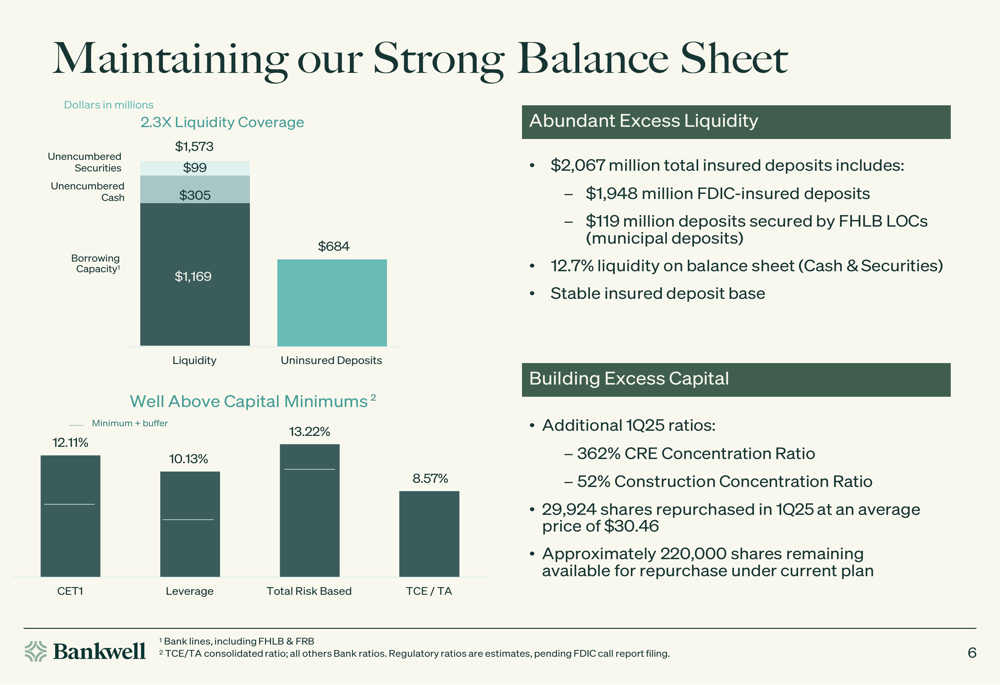
Bankwell’s balance sheet reflects a strong liquidity and capital position, with 2.3x liquidity coverage and capital ratios well above regulatory minimums. The bank’s CET1 ratio stands at 12.11%, while its total risk-based capital ratio is 13.22%.
The following chart illustrates the bank’s robust liquidity and capital position:
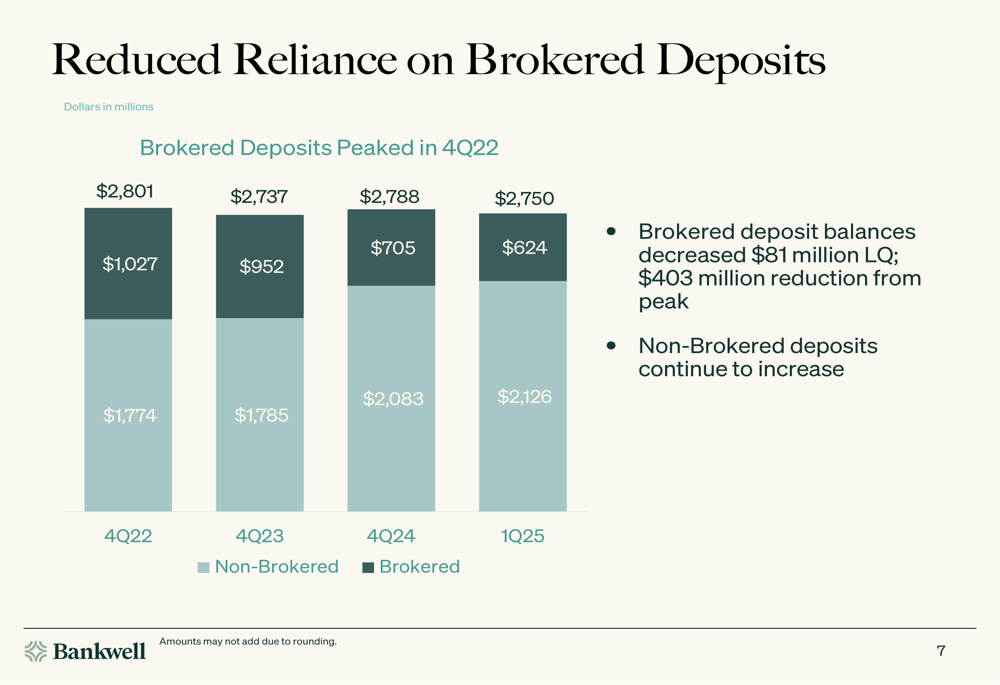
The bank continues to make progress in reducing its reliance on brokered deposits, which declined by $81 million during the quarter and by $403 million from their peak in Q4 2022. Simultaneously, core deposits grew by $43 million, including a $28 million increase in non-interest bearing deposits.
This strategic shift in funding sources is clearly demonstrated in the following chart:
Bankwell is strategically positioned to benefit from potential interest rate decreases, with $1.2 billion of time deposits maturing in the next twelve months. The bank estimates that repricing these deposits at current market rates could generate approximately $4.2 million in annualized interest expense savings, translating to a potential $0.42 benefit to EPS and approximately 13 basis points improvement in net interest margin.
In the first quarter of 2025, $340 million of certificates of deposit already repriced approximately 95 basis points lower, contributing to the quarter’s margin expansion.
Strategic Initiatives
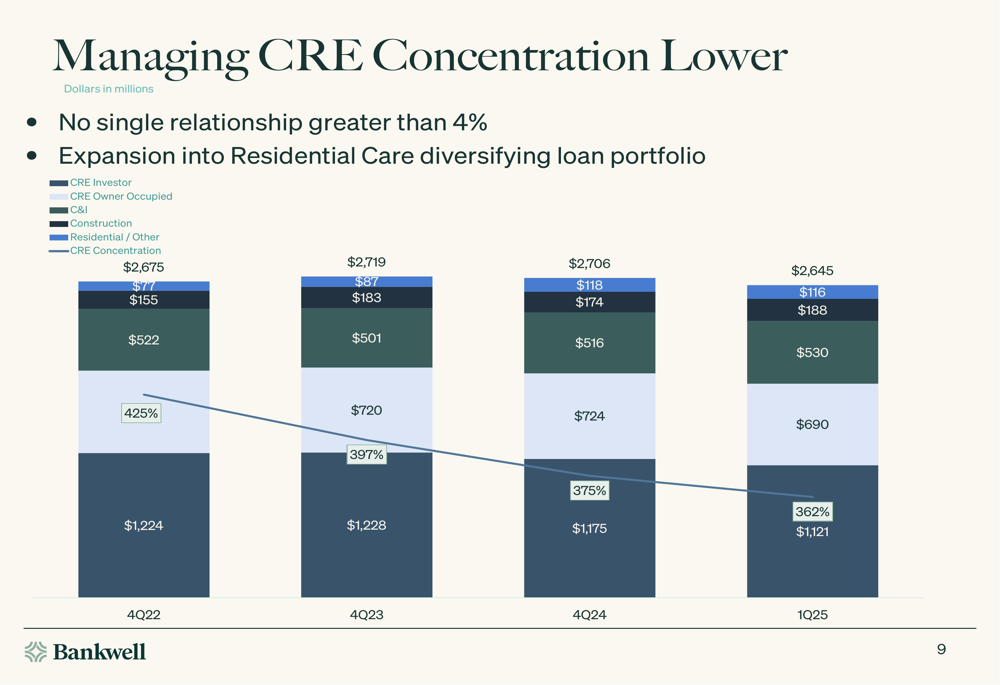
Bankwell continues to execute on its strategy of diversifying its loan portfolio and reducing concentration risk. Commercial real estate (CRE) concentration has decreased from 425% in Q4 2022 to 362% in Q1 2025, reflecting the bank’s disciplined approach to managing exposure.
The following chart illustrates this reduction in CRE concentration over time:
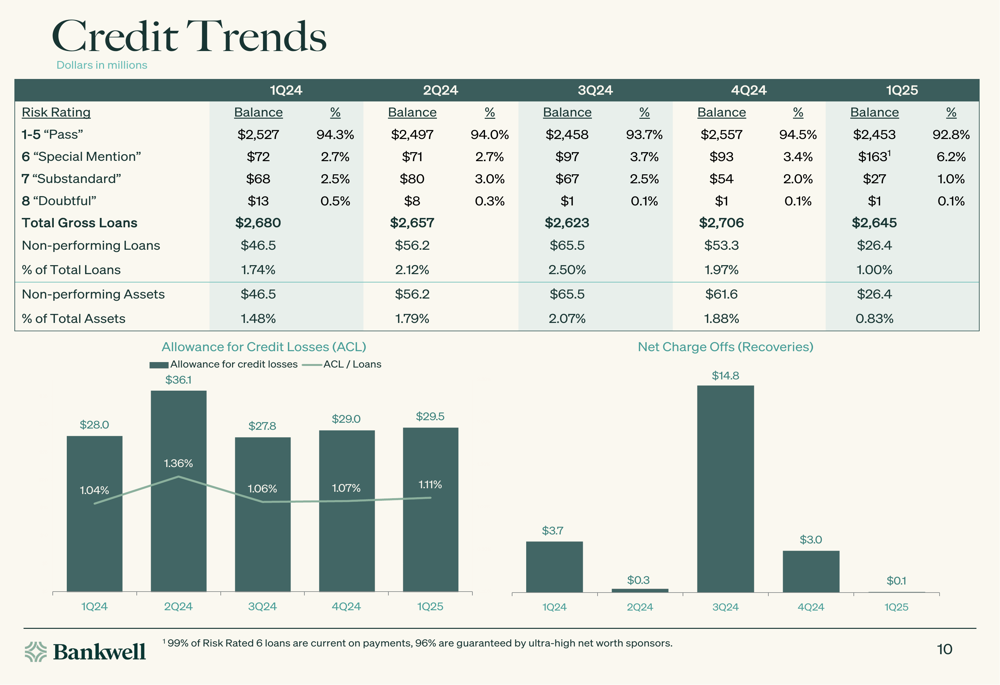
Credit quality trends show consistent improvement, with classified loans decreasing as a percentage of total loans from 1.74% in Q1 2024 to 1.00% in Q1 2025. Non-performing assets declined from $46.5 million to $26.4 million over the same period.
The credit trends are clearly visible in this comprehensive overview:
The bank’s office portfolio exposure remains manageable at $160 million, representing just 6% of the total loan portfolio. This exposure is diversified across 46 loans with an average balance of $3.5 million, and 62% is located in Bankwell’s primary market.
Healthcare lending has emerged as a strategic focus area, with a combined healthcare portfolio of $832 million spanning skilled nursing facilities, assisted living, and other healthcare segments. This diversification helps mitigate risk while targeting growth in a relatively stable sector.
Forward-Looking Statements
Looking ahead, Bankwell’s management outlined a positive outlook for the remainder of 2025, projecting:
- Modest loan growth
- Continued net interest margin expansion
- Stable credit quality
- Ongoing capital accumulation
- Maintained focus on operational efficiency
The bank’s strategic initiatives, including the addition of two deposit teams in the NYC metro area in April, position it well for continued growth in core deposits. Additionally, the bank’s share repurchase program remains active, with 29,924 shares bought back during the quarter at an average price of $30.46 per share.
Bankwell’s balance sheet structure, with significant time deposits repricing in the coming quarters, appears well-positioned to benefit from potential Federal Reserve rate cuts, potentially driving further margin expansion and earnings growth through 2025.
Full presentation:
This article was generated with the support of AI and reviewed by an editor. For more information see our T&C.