Verizon to cut 15,000 jobs amid growing competition pressures - WSJ

Introduction & Market Context
Barclays PLC (LSE:LON:BARC) presented its Q2 2025 results on July 29, showing continued momentum from its strong first quarter performance. The bank reported a statutory return on tangible equity (RoTE) of 12.3% for Q2, up from 9.9% in the same period last year, as it advances its strategic shift toward a more balanced business mix with greater emphasis on UK operations.
The results build upon the bank’s Q1 2025 performance, which saw a 14% RoTE and raised guidance for net interest income. Barclays continues to trade near its 52-week high, reflecting investor confidence in its strategic direction.
Quarterly Performance Highlights
Barclays reported significant year-on-year improvements across key financial metrics for both the second quarter and first half of 2025. Profit before tax reached £2.5 billion in Q2, a 28% increase from £1.9 billion in Q2 2024, while income grew by 14% to £7.2 billion.
As shown in the following comprehensive financial overview from the presentation, earnings per share saw an even more dramatic improvement, rising 41% to 11.7p compared to 8.3p in the same quarter last year:
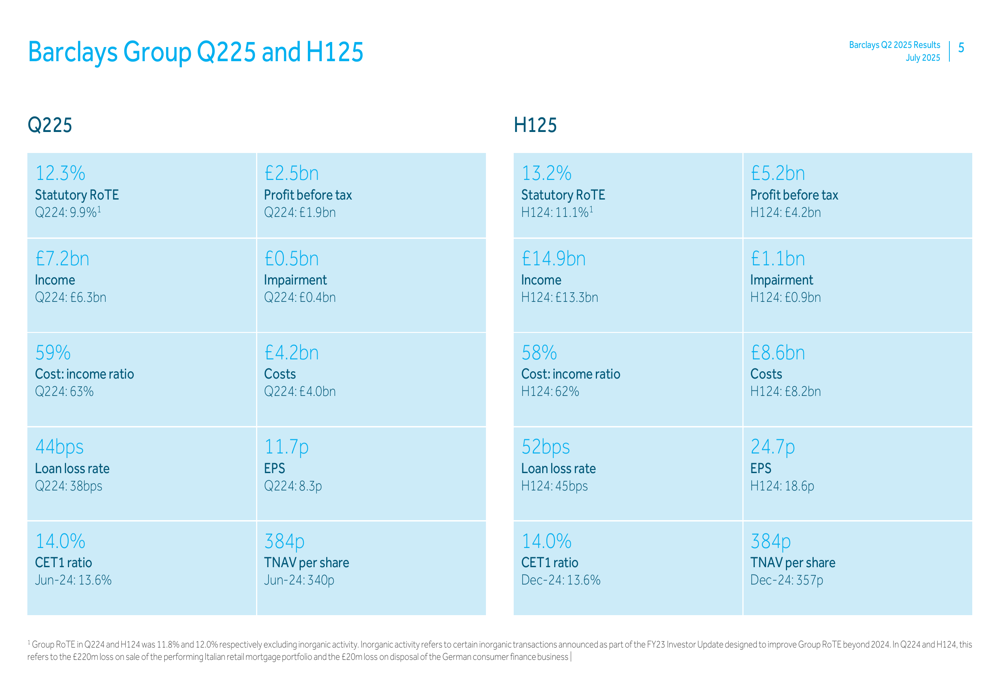
The bank’s performance was strong across all business segments, with Barclays UK delivering a 19.7% RoTE, UK Corporate Bank at 16.6%, Private Bank & Wealth Management leading with 31.9%, Investment Bank at 12.2%, and US Consumer Bank at 10.2%. The bank’s capital position also strengthened, with the CET1 ratio improving to 14.0% from 13.6% in June 2024.
Detailed Financial Analysis
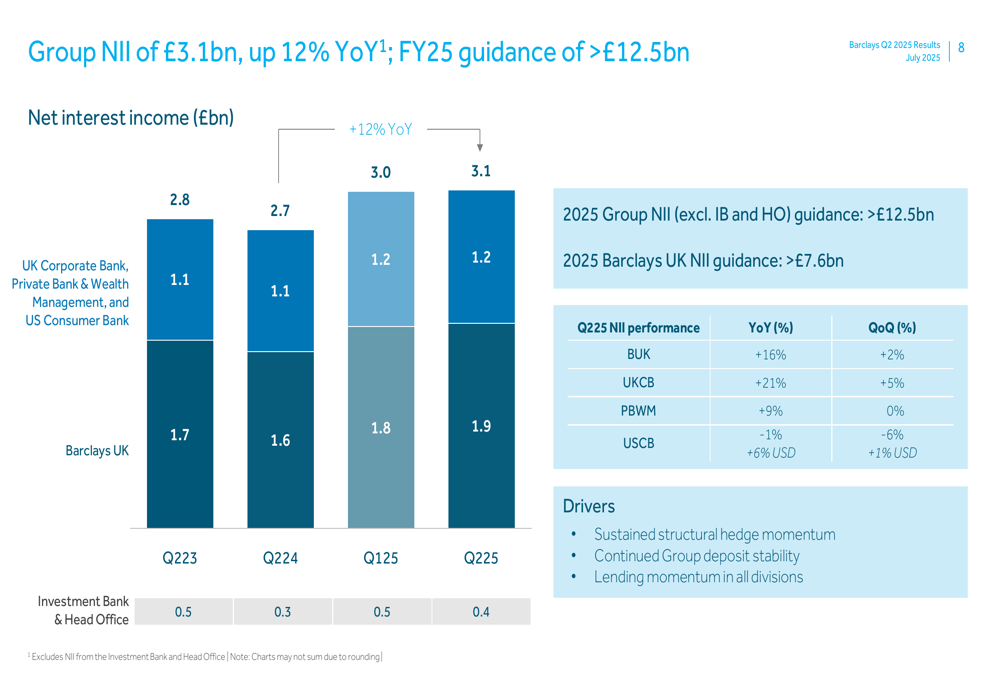
Barclays’ income growth was broad-based, with stable income streams constituting 73% of group income in Q2 2025. Net interest income (NII) showed particularly strong performance, with Group NII (excluding Investment Bank and Head Office) reaching £3.1 billion in Q2, up 12% year-on-year.
The following chart illustrates the composition and growth of NII across different business segments:
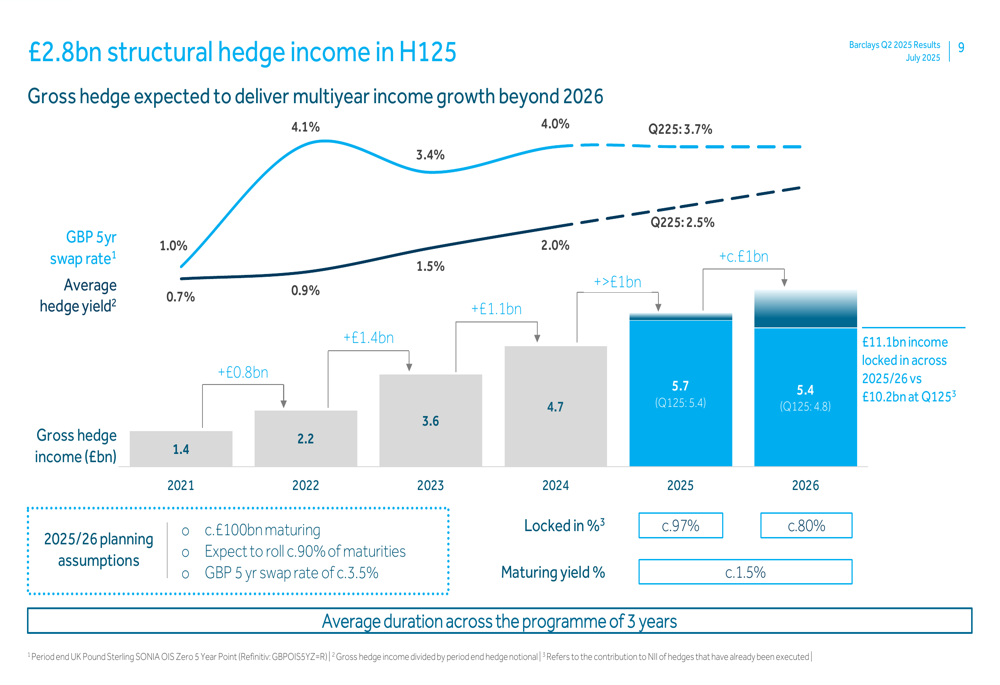
A key driver of the bank’s sustained income growth is its structural hedge, which is expected to deliver multi-year income benefits extending beyond 2026. As shown in the following chart, gross hedge income has increased steadily from £1.4 billion in 2021 to a projected £5.7 billion in 2025:
On the cost front, Barclays has made progress with efficiency savings, which have partially offset inflation, regulatory costs, and business growth investments. The cost-to-income ratio improved to 59% in Q2 2025 from 63% in Q2 2024, reflecting enhanced operational efficiency.
Strategic Initiatives
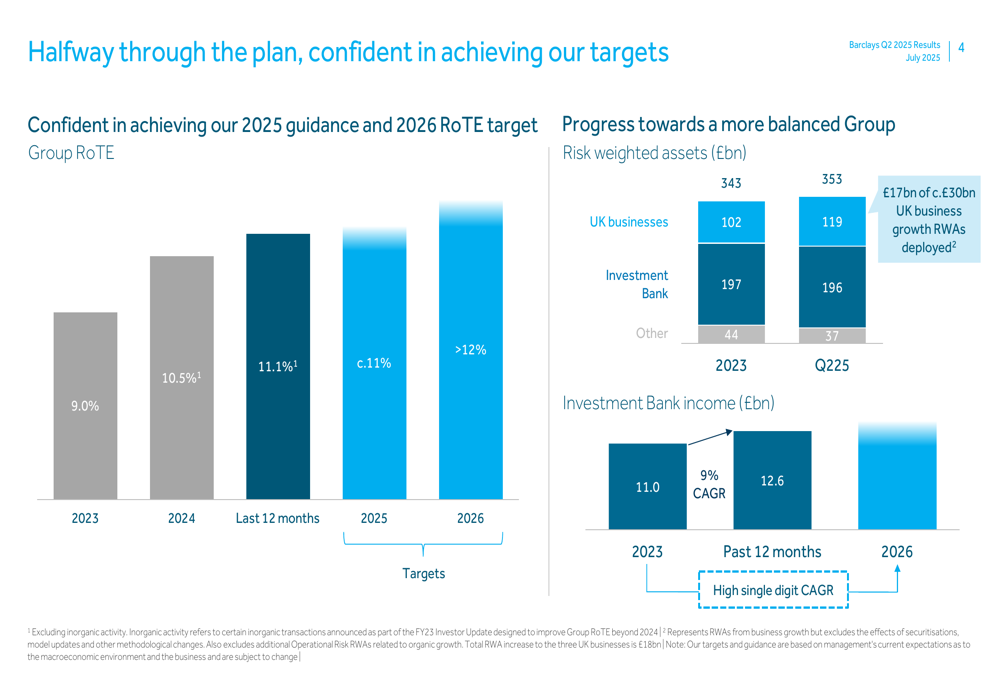
Barclays continues to make significant progress on its strategic goal of creating a more balanced group with reduced reliance on the Investment Bank. The bank has deployed £17 billion of the planned £30 billion in risk-weighted assets (RWAs) toward UK business growth, with £10 billion coming from organic growth.
The following chart demonstrates the bank’s progress toward achieving its RoTE targets and creating a more balanced group:
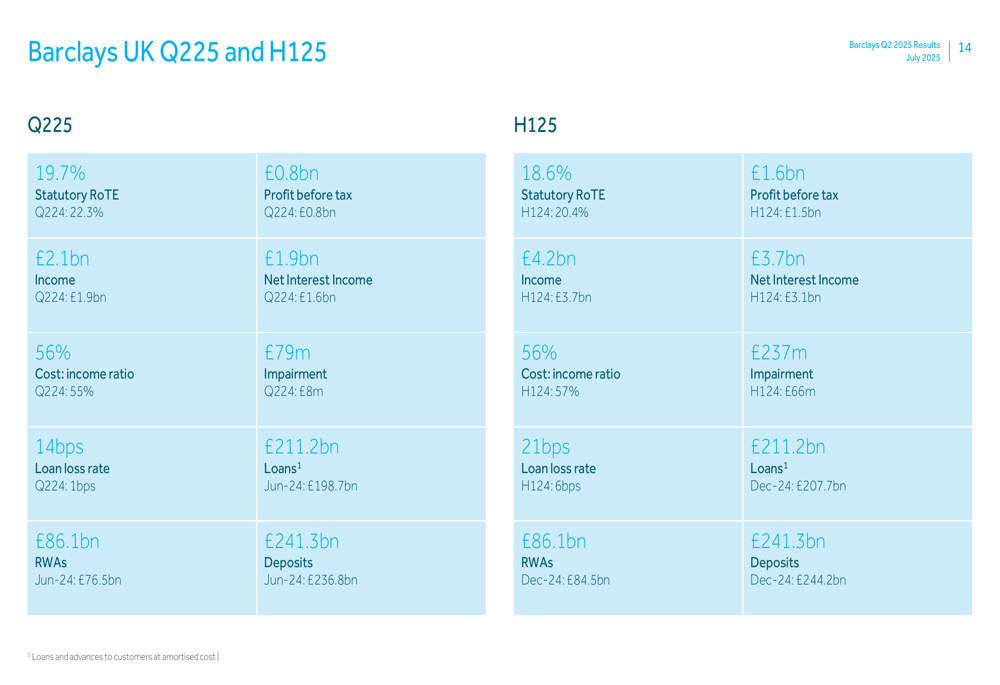
In the UK, Barclays has seen renewed growth in mortgage lending, card acquisitions, and corporate banking. Barclays UK reported strong financial results for Q2 2025, with income up 11% year-on-year to £2.1 billion and profit before tax stable at £0.8 billion despite higher impairment charges:
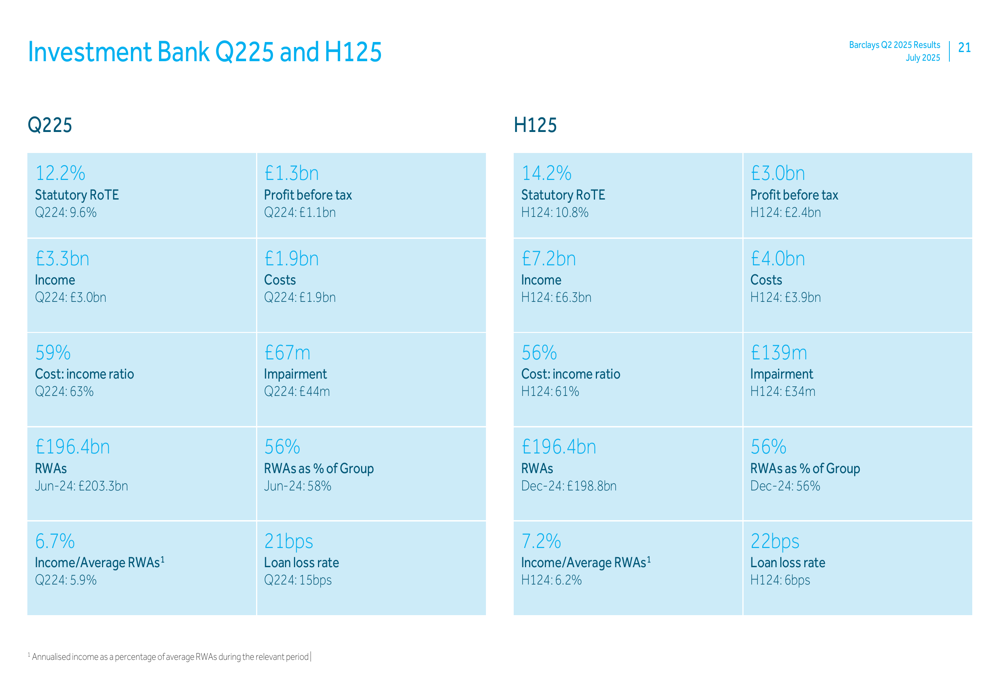
The Investment Bank also delivered improved performance, with a statutory RoTE of 12.2% in Q2 2025, up from 9.6% in Q2 2024. Income increased by 10% to £3.3 billion, while the cost-to-income ratio improved to 59% from 63%:
Forward-Looking Statements
Barclays has maintained its guidance for 2025 and reaffirmed its 2026 targets, demonstrating confidence in its strategic direction despite ongoing economic uncertainties. For 2025, the bank expects a statutory RoTE of approximately 11%, Group NII (excluding Investment Bank and Head Office) exceeding £12.5 billion, and Barclays UK NII above £7.6 billion.
The bank’s targets and guidance are clearly outlined in the following slide:
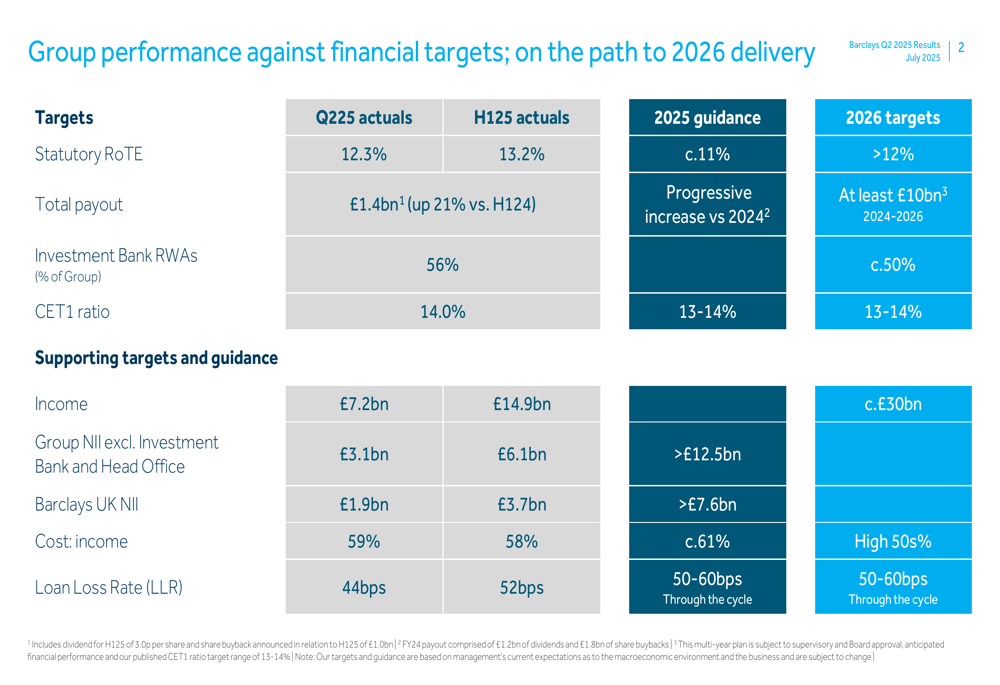
Capital distribution remains a priority, with £1.4 billion distributed in the first half of 2025, representing a 21% increase compared to H1 2024. This includes a 3.0p dividend per share and a £1.0 billion share buyback. Barclays targets at least £10 billion in capital distributions for the 2024-2026 period.
In the US Consumer Bank, delinquencies have stabilized, with 30-day delinquencies at 2.8% in Q2 2025, down from 3.0% in Q1 2025, while 90-day delinquencies remained stable at 1.6%. The loan loss rate for Q2 2025 was 44 basis points, up slightly from 38 basis points in Q2 2024 but within the bank’s through-the-cycle guidance of 50-60 basis points.
Barclays’ Q2 2025 results demonstrate continued execution of its strategic plan, with strong performance across business segments and significant progress toward creating a more balanced group. The bank remains on track to meet its 2025 guidance and 2026 targets, supported by growth in UK businesses and improved operational efficiency.
Full presentation:
This article was generated with the support of AI and reviewed by an editor. For more information see our T&C.