Fed Governor Adriana Kugler to resign

Introduction & Market Context
Berkshire Hills Bancorp (NYSE:BHLB) released its first quarter 2025 earnings presentation on April 24, 2025, showcasing strong year-over-year growth in key metrics while advancing its planned merger with Brookline Bancorp (NASDAQ:BRKL). The bank reported operating earnings of $27.6 million, representing a 6% increase quarter-over-quarter and a substantial 32% improvement year-over-year.
The company’s stock closed at $24.30 on April 23, 2025, up 1.5% for the day, and has traded within a 52-week range of $20.76 to $32.36. The Q1 results continue the positive momentum seen in the previous quarter, when the bank exceeded analyst expectations.
Quarterly Performance Highlights
Berkshire Hills delivered an EPS of $0.60 for Q1 2025, flat compared to the previous quarter but up 22% from the same period last year. The bank’s efficiency ratio improved significantly to 59.5%, down 296 basis points quarter-over-quarter and 679 basis points year-over-year, reflecting the company’s continued focus on expense management.
As shown in the following chart of key financial metrics, the bank demonstrated improvements across multiple performance indicators:
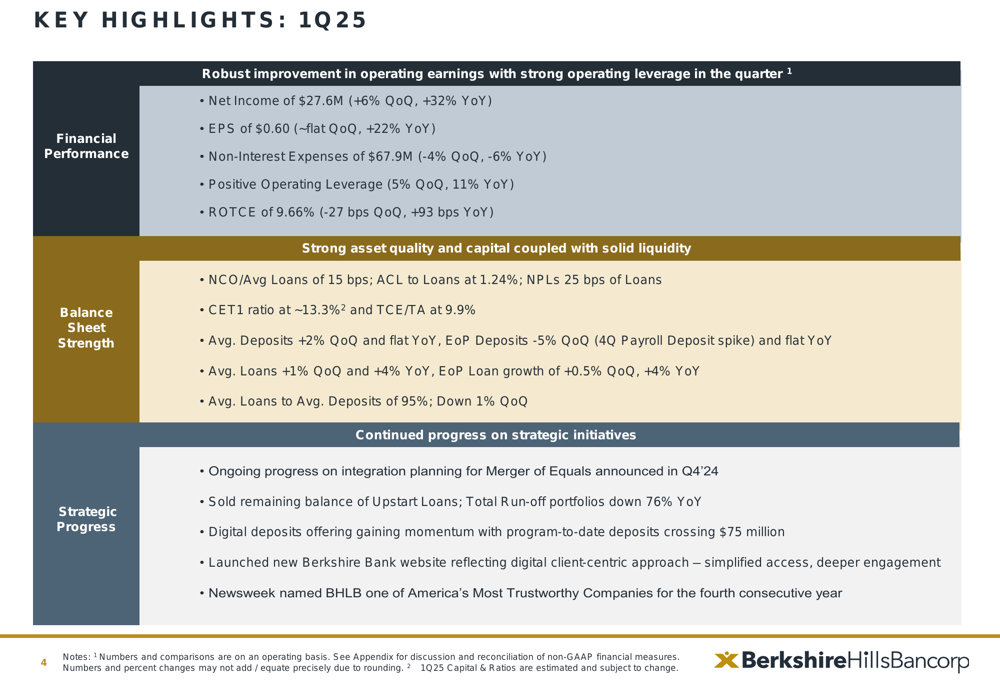
Net interest margin (NIM) expanded to 3.24%, representing increases of 10 basis points quarter-over-quarter and 9 basis points year-over-year. This improvement aligns with management’s previous guidance that projected modest NIM expansion in Q1 2025. Net interest income grew to $89.8 million, up 3% from the previous quarter and 1.8% year-over-year.
The detailed financial overview below highlights the comprehensive performance metrics for the quarter:
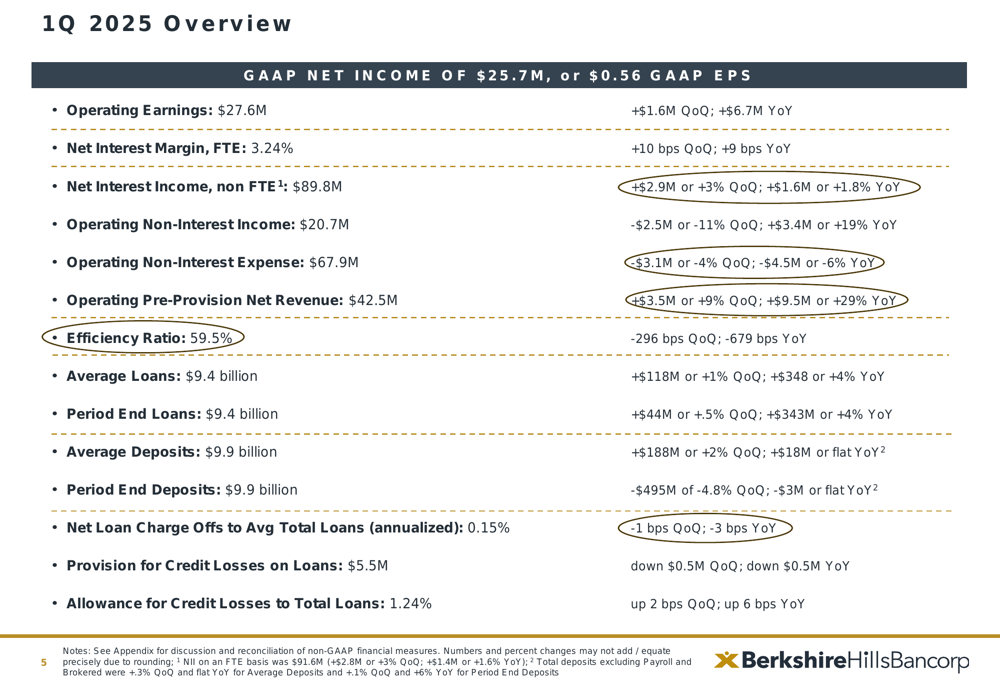
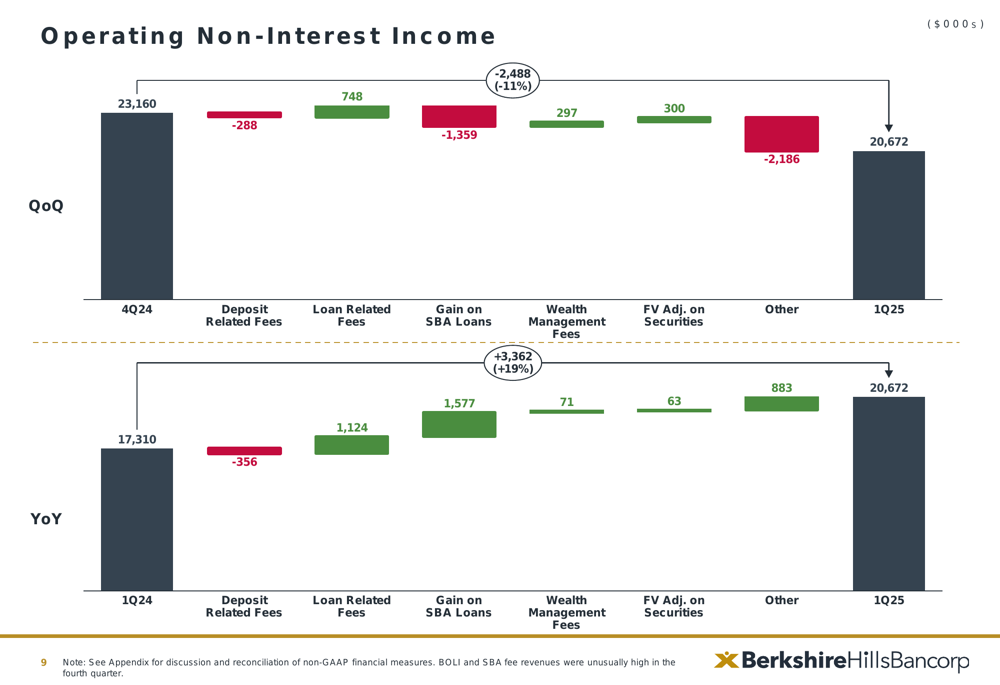
Operating non-interest income totaled $20.7 million, down 11% quarter-over-quarter but up 19% year-over-year. The quarterly decline was primarily driven by lower deposit-related fees and wealth management fees, partially offset by improvements in loan-related fees.
The following chart breaks down the components of non-interest income changes:
Expense Management Excellence
A standout aspect of Berkshire’s performance has been its disciplined approach to expense management. Operating non-interest expenses decreased to $67.9 million, down 4% quarter-over-quarter and 6% year-over-year. The reduction was primarily driven by lower compensation and benefits costs, as well as decreased professional services expenses.
The following chart illustrates the drivers of expense reduction:
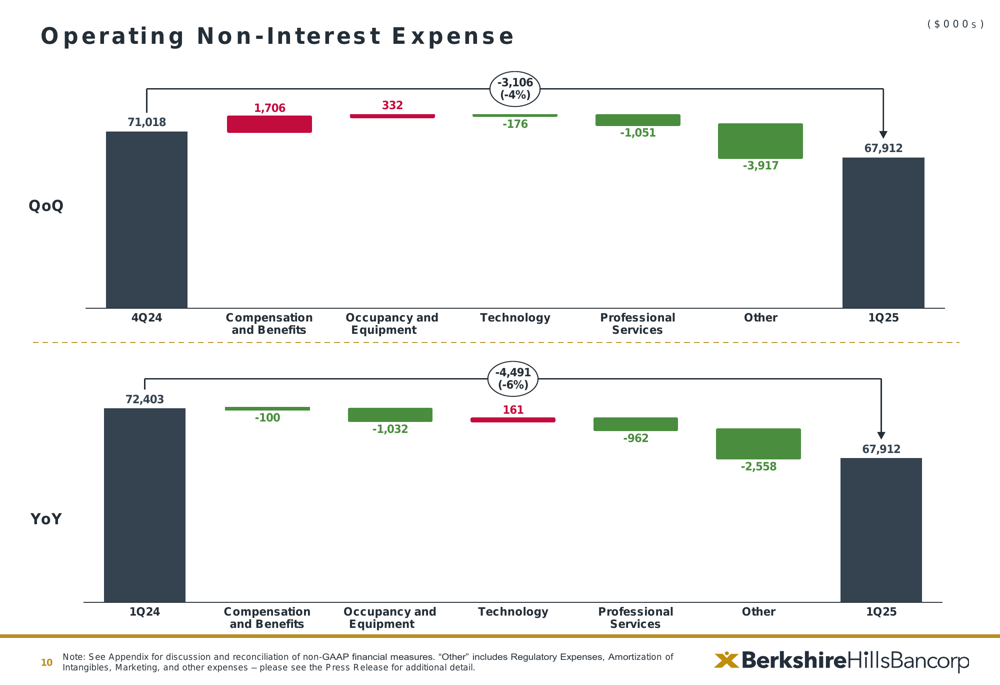
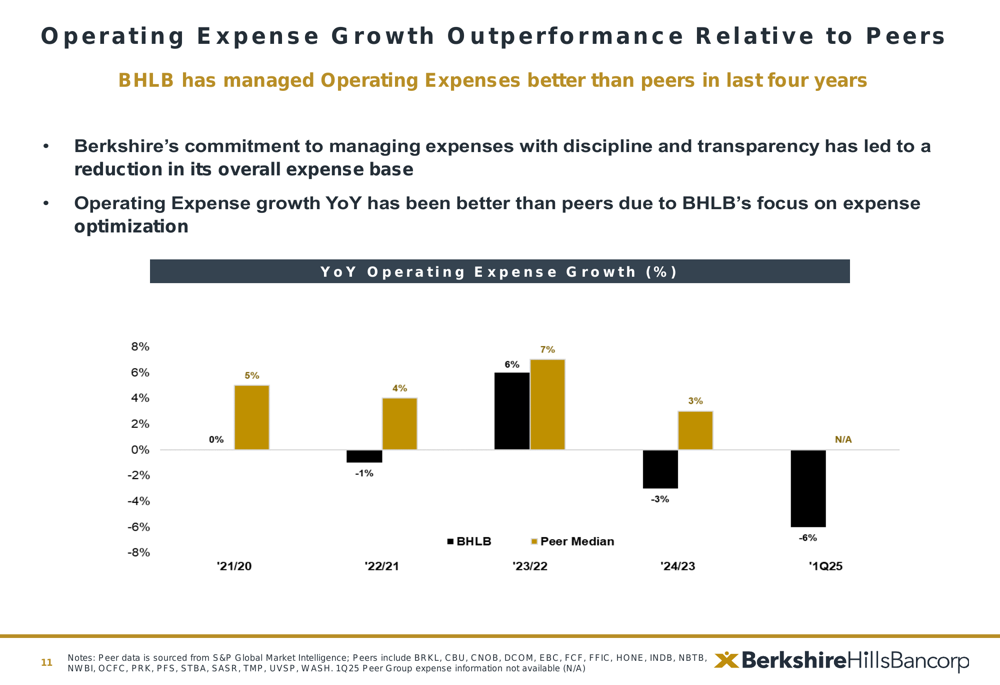
Notably, Berkshire has consistently outperformed its peers in controlling expense growth over multiple years. This expense discipline has been a key factor in the bank’s improved profitability metrics.
The following chart demonstrates Berkshire’s expense growth outperformance relative to peers:
Balance Sheet and Asset Quality
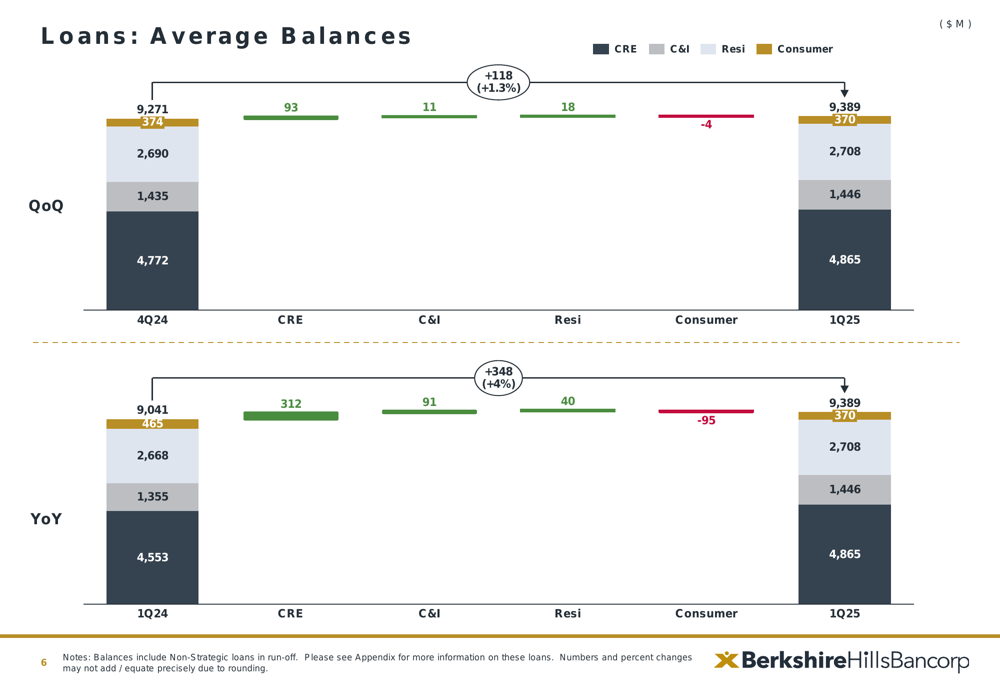
Berkshire reported average loan balances of $9.4 billion, representing growth of 1% quarter-over-quarter and 4% year-over-year. Commercial real estate (CRE) and commercial and industrial (C&I) loans were the primary drivers of this growth.
The following chart shows the composition and growth of the loan portfolio:
Average deposits totaled $9.9 billion, up 2% quarter-over-quarter and flat year-over-year. However, period-end deposits decreased by 4.8% quarter-over-quarter, suggesting some outflows toward the end of the quarter.
The deposit composition is illustrated in the following chart:

Asset quality metrics remained solid, with non-performing loans at 25 basis points of total loans. Net charge-offs were 15 basis points of average loans, while the allowance for credit losses to total loans ratio stood at 1.24%, up 2 basis points quarter-over-quarter and 6 basis points year-over-year.
The bank’s commercial real estate portfolio, which represents a significant portion of total loans, is well-diversified by property type and geography. Massachusetts accounts for 40% of the CRE exposure, with the remainder spread across various states.
The following chart provides a detailed breakdown of the CRE portfolio:

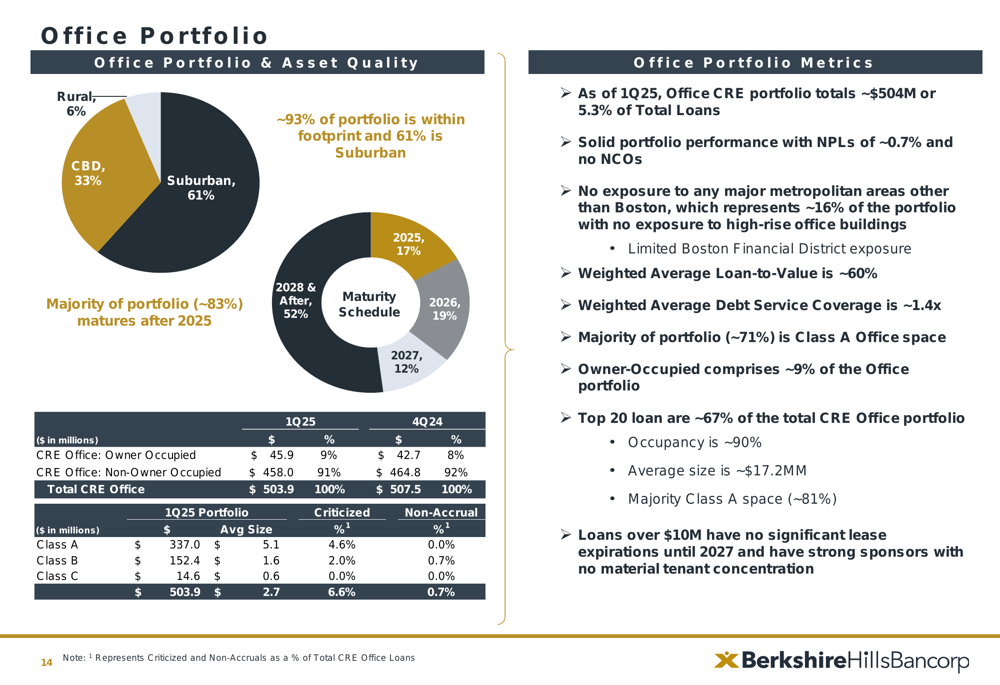
Given market concerns about commercial office space, Berkshire provided specific details on its office portfolio, which totals $504 million with non-performing loans of approximately 0.7%. The portfolio is predominantly suburban (61%) and higher-quality Class A properties (67%).
Strategic Initiatives
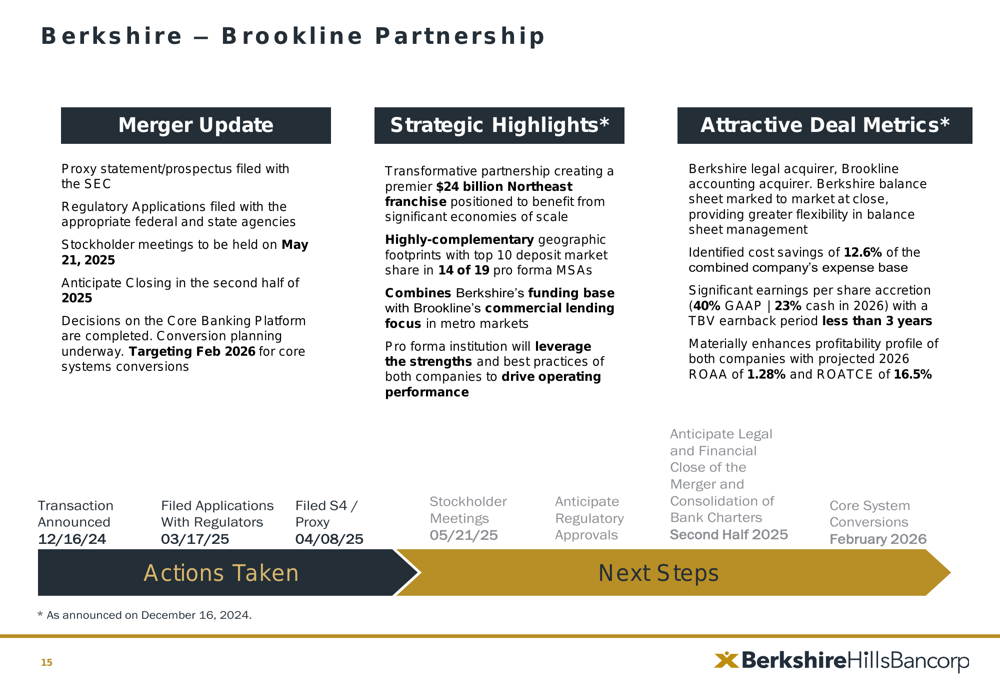
The most significant strategic development for Berkshire is its planned merger with Brookline Bancorp. The merger will create a premier $24 billion Northeast franchise by combining Berkshire’s strong funding base with Brookline’s commercial lending focus.
Key updates on the merger progress include:
- Proxy statement/prospectus has been filed
- Regulatory applications have been submitted
- Stockholder meetings scheduled for May 21, 2025
- Anticipated closing in the second half of 2025
- Core systems conversion targeted for February 2026
The merger is expected to deliver cost savings of 12.6% of the combined company’s expense base and provide significant earnings per share accretion.
The following slide details the merger progress and strategic benefits:
Other strategic achievements during the quarter included:
- Sale of remaining Upstart (NASDAQ:UPST) loans at 76 cents on the dollar, resulting in a net loss of approximately $1.7 million
- Continued momentum in digital deposit offerings
- Launch of a new Berkshire Bank website
- Recognition by Newsweek as one of America’s Most Trustworthy Companies
Liquidity and Capital Position
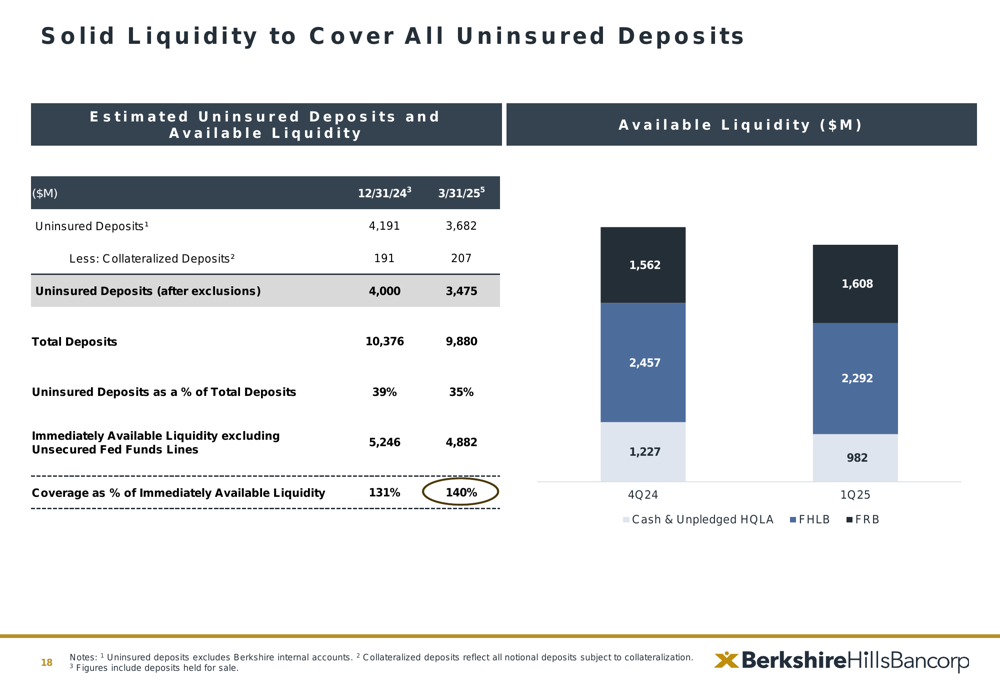
Berkshire maintains a strong liquidity position, with available liquidity covering 140% of uninsured deposits as of March 31, 2025. This robust liquidity buffer provides significant protection against potential deposit outflows.
The following chart illustrates the bank’s liquidity coverage:
Capital ratios remain well above regulatory requirements, with a CET1 ratio of approximately 13.3% and a tangible common equity to tangible assets ratio of 9.9%.
Forward Outlook
While the presentation did not provide specific forward guidance, the merger with Brookline Bancorp represents the most significant factor in Berkshire’s near-term outlook. The combined entity is expected to benefit from enhanced scale, expanded geographic presence, and significant cost synergies.
The bank’s continued focus on expense discipline, combined with its improving net interest margin and solid asset quality, positions it well for continued profitability improvement. The successful sale of the remaining Upstart loans also removes a potential source of volatility from the balance sheet.
As Berkshire progresses toward the anticipated merger closing in the second half of 2025, investors will be closely monitoring integration planning efforts and regulatory approval processes. The targeted February 2026 core systems conversion will be a critical milestone in realizing the full benefits of the combined organization.
Full presentation:
This article was generated with the support of AI and reviewed by an editor. For more information see our T&C.