JFrog stock rises as Cantor Fitzgerald maintains Overweight rating after strong Q2

Introduction & Market Context
Berkshire Hills Bancorp (NYSE:BHLB) released its second quarter 2025 earnings presentation on July 24, showcasing strong financial performance amid ongoing integration planning for its merger with Brookline Bancorp (NASDAQ:BRKL). The regional bank, which closed at $26.23 on July 23 (down 0.76%), reported significant year-over-year improvements in profitability metrics while maintaining solid asset quality.
The presentation highlights Berkshire’s continued progress on strategic initiatives, including expense optimization and digital banking expansion, as it prepares for the transformative merger announced in Q4 2024. This follows the company’s strong Q1 2025 performance, where it beat earnings expectations with an EPS of $0.60.
Quarterly Performance Highlights
Berkshire Hills reported substantial improvements in its second quarter operating results, with operating net income reaching $31.6 million, a 36% increase year-over-year and a 14% improvement quarter-over-quarter. Operating earnings per share grew to $0.69, representing a 25% year-over-year increase and a 15% sequential improvement from Q1 2025’s $0.60.
As shown in the following comprehensive overview of Q2 performance:
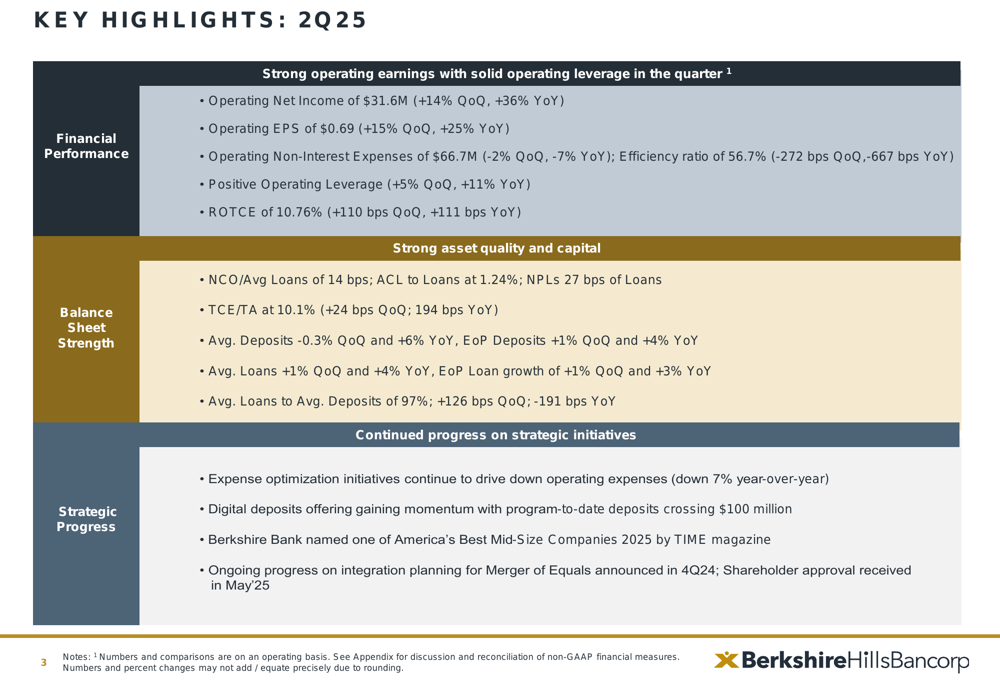
The bank’s efficiency ratio improved significantly to 56.7%, down 667 basis points year-over-year and 272 basis points quarter-over-quarter, reflecting successful expense management initiatives. Operating non-interest expenses decreased to $66.7 million, down 7% year-over-year and 2% quarter-over-quarter, contributing to positive operating leverage of 11% year-over-year and 5% quarter-over-quarter.
Return on tangible common equity (ROTCE) reached 10.76%, improving by 111 basis points year-over-year and 110 basis points from the previous quarter, demonstrating enhanced profitability. This represents a significant improvement from the 9.66% ROTCE reported in Q1 2025.
The detailed financial results show improvement across multiple metrics:
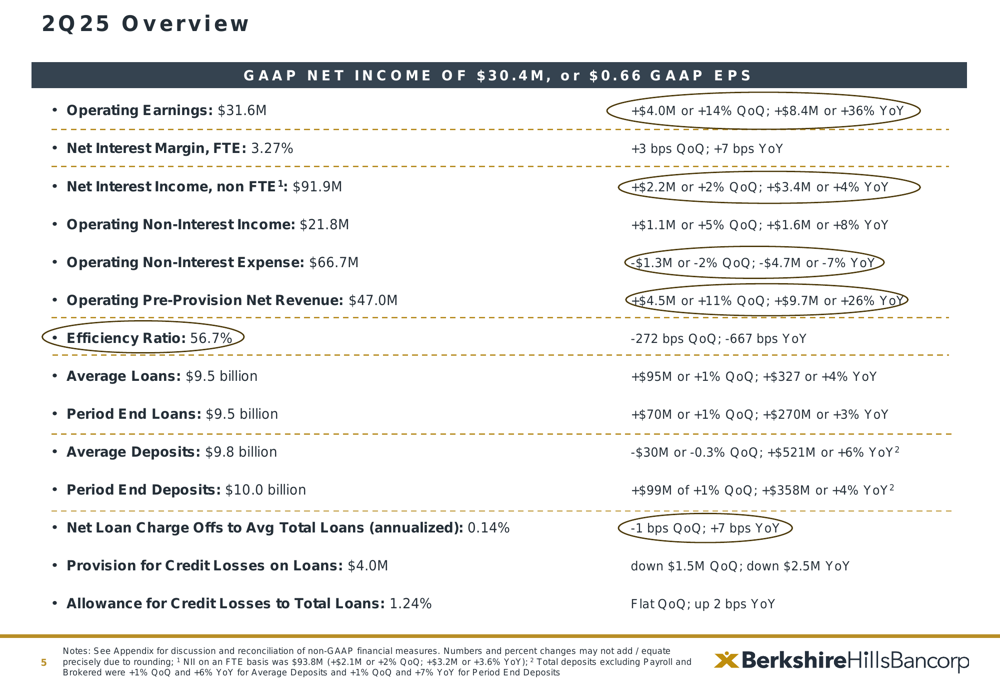
Net interest margin (FTE) increased to 3.27%, up 7 basis points year-over-year and 3 basis points quarter-over-quarter, while net interest income grew to $91.9 million, representing a 4% year-over-year increase and a 2% sequential improvement. Operating non-interest income rose to $21.8 million, up 8% year-over-year and 5% quarter-over-quarter.
Merger Progress and Strategic Initiatives
A significant focus of the presentation was the progress on Berkshire’s merger with Brookline Bancorp, which received stockholder approval in May 2025. The company anticipates closing the transaction in the second half of 2025, with core system conversions planned for February 2026.
The following slide details the merger progress and strategic benefits:
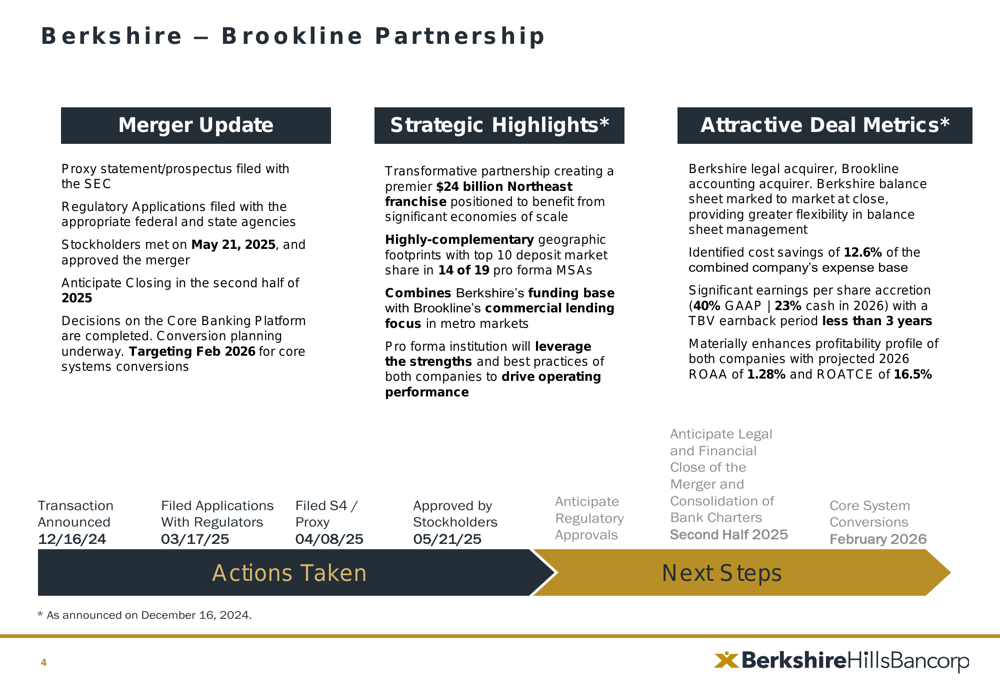
The merger will create a premier $24 billion Northeast banking franchise with top 10 deposit market share in 14 of 19 pro forma metropolitan statistical areas (MSAs). The combined entity is projected to achieve significant cost savings of 12.6% of the combined expense base, with expected earnings per share accretion of 40% (GAAP) and 23% (cash) in 2026. The tangible book value earnback period is estimated at less than three years.
Beyond the merger, Berkshire continues to make progress on other strategic initiatives. Its digital deposits offering has gained momentum, with program-to-date deposits exceeding $100 million, up from $75 million reported in Q1 2025. The bank was also recognized by TIME magazine as one of America’s Best Mid-Size Companies 2025.
Loan and Deposit Trends
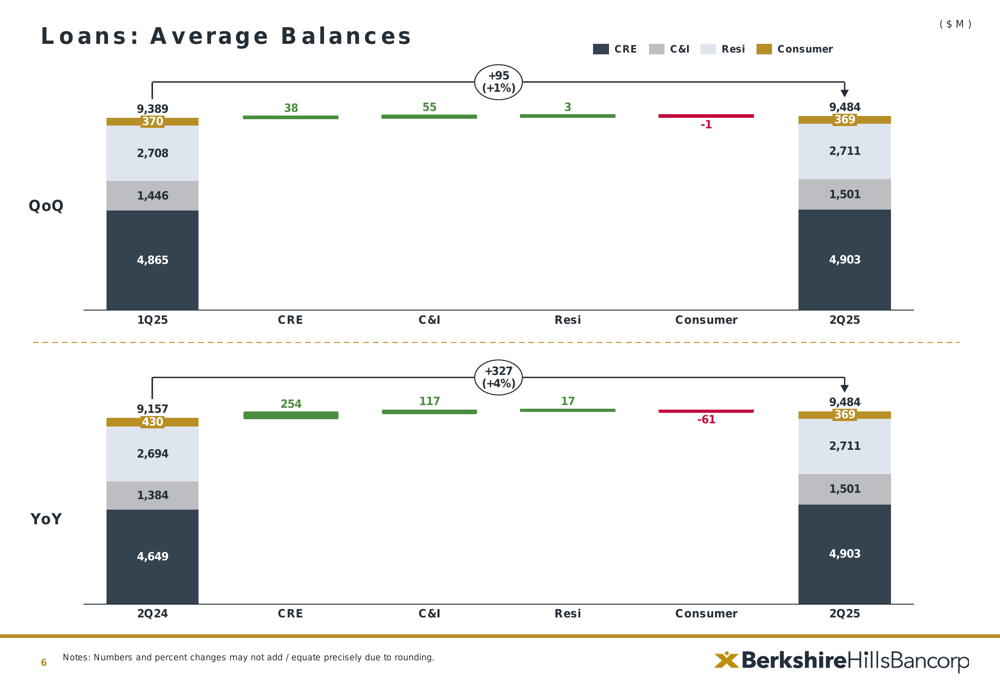
Berkshire Hills reported moderate growth in both loans and deposits during the quarter. Average loans increased by 1% quarter-over-quarter and 4% year-over-year to $9.5 billion, while period-end loans grew by 1% quarter-over-quarter and 3% year-over-year.
The following chart illustrates the composition and trends in the loan portfolio:
On the funding side, average deposits decreased slightly by 0.3% quarter-over-quarter but increased by 6% year-over-year to $9.8 billion. Period-end deposits showed more positive momentum, growing by 1% quarter-over-quarter and 4% year-over-year to $10.0 billion.
The average loan-to-deposit ratio stood at 97%, up 126 basis points quarter-over-quarter but down 191 basis points year-over-year, indicating a balanced approach to loan and deposit growth.
Asset Quality and Risk Management
Berkshire maintained strong asset quality metrics during the quarter. Non-performing loans represented just 27 basis points of total loans, well below the 10-year average of 38 basis points. Net charge-offs to average loans were 14 basis points, also below the 10-year average of 25 basis points.
The following charts provide a comprehensive view of asset quality trends:
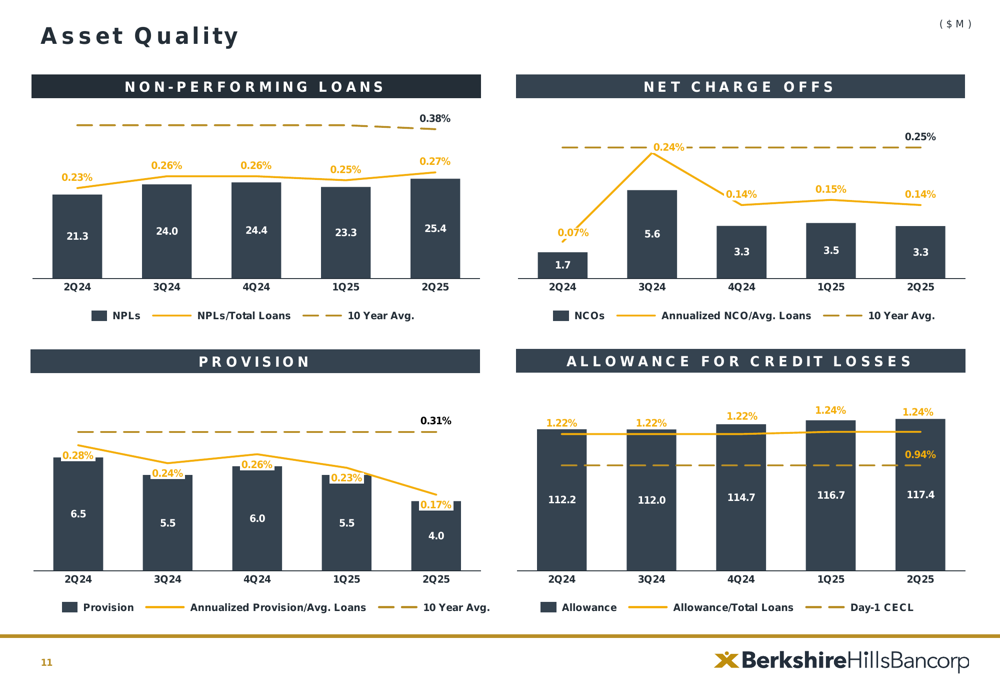
The allowance for credit losses to total loans ratio remained stable at 1.24%, slightly above the year-ago level of 1.22%. The provision for credit losses on loans decreased to $4.0 million, down $1.5 million quarter-over-quarter and $2.5 million year-over-year, reflecting confidence in the quality of the loan portfolio.
Berkshire’s commercial real estate (CRE) portfolio, an area of focus for investors given market concerns about office space, is well-diversified by property type and geography:
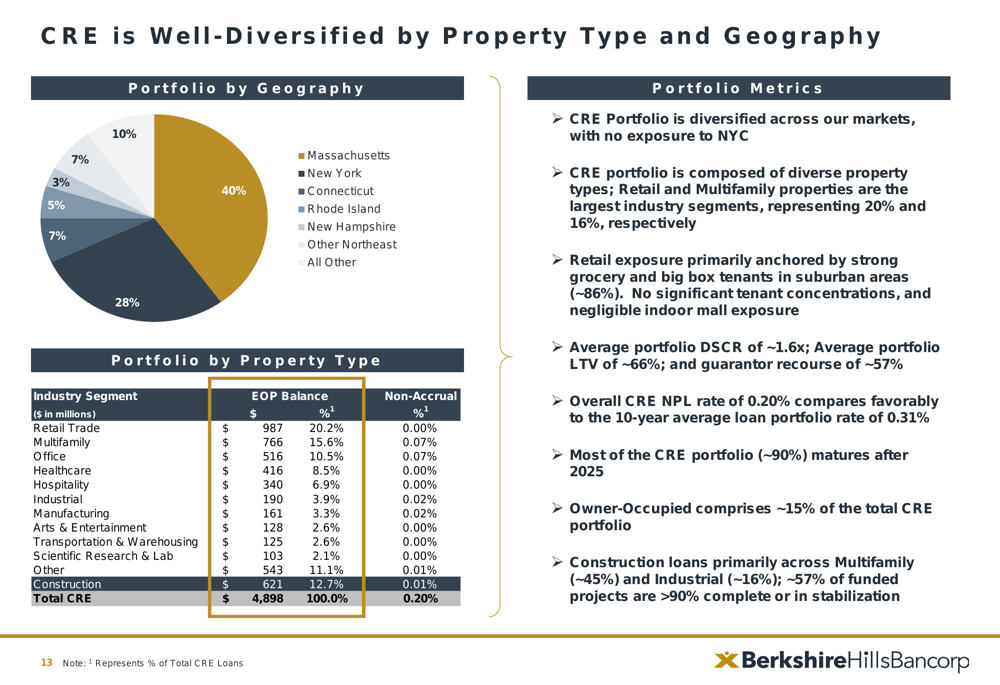
The CRE portfolio is predominantly concentrated in Massachusetts (40%) and diversified across various property types, with retail (20.2%) and multifamily (15.6%) representing the largest segments. Office exposure, which accounts for 10.5% of the CRE portfolio, shows minimal non-accrual rates of 0.07%.
A deeper analysis of the office portfolio reveals:
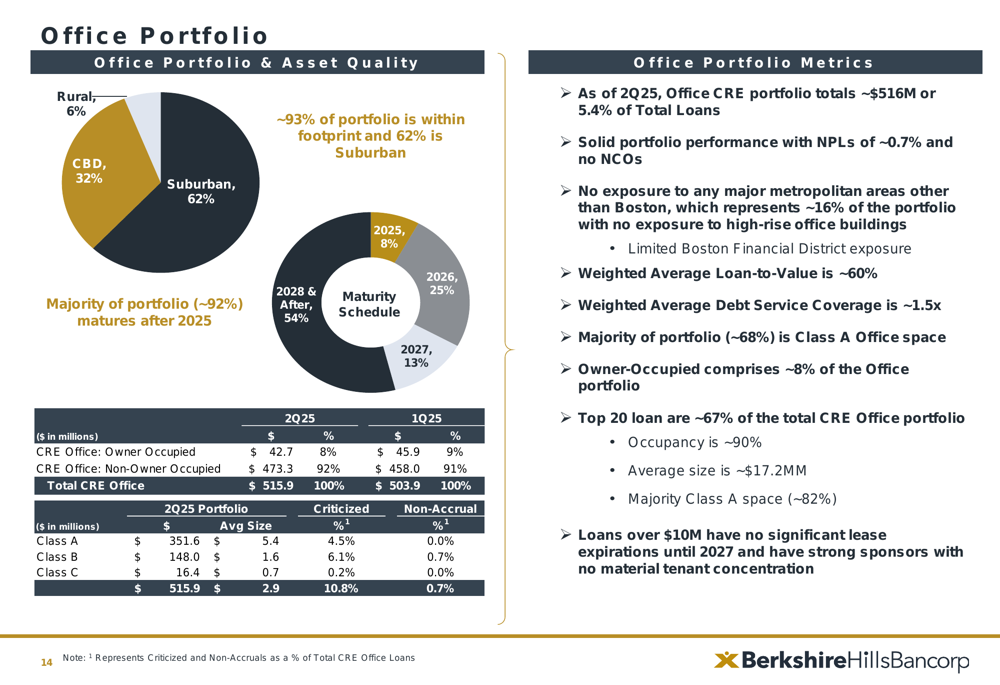
The office portfolio totals approximately $516 million, representing 5.4% of total loans, with non-performing loans at just 0.7% and no net charge-offs. The portfolio is primarily suburban (62%) and Class A (68%), with limited exposure to central business districts (32%) and minimal exposure to major metropolitan areas outside Boston.
Forward-Looking Statements
Looking ahead, Berkshire Hills Bancorp is focused on completing its merger with Brookline Bancorp, which is expected to significantly enhance the combined entity’s profitability profile. The projected 2026 return on average assets is 1.28%, with return on average tangible common equity expected to reach 16.5%.
The company continues to emphasize expense optimization, with initiatives already yielding a 7% year-over-year reduction in operating expenses. The digital banking strategy remains a priority, with momentum building in the digital deposits offering.
While specific financial guidance was limited due to the pending merger, the presentation highlighted Berkshire’s strong capital position, with tangible common equity to tangible assets at 10.1%, up 24 basis points quarter-over-quarter and 194 basis points year-over-year, providing flexibility for future growth opportunities.
As the banking industry navigates economic uncertainties, Berkshire’s diversified loan portfolio, solid asset quality metrics, and strategic merger position the company for continued performance improvement in the coming quarters.
Full presentation:
This article was generated with the support of AI and reviewed by an editor. For more information see our T&C.