JFrog stock rises as Cantor Fitzgerald maintains Overweight rating after strong Q2

Introduction & Market Context
BlackRock (NYSE:BLK), the world’s largest asset manager, revealed in its Q2 2025 earnings presentation that assets under management reached $12.5 trillion as of June 30, 2025. The presentation, released on July 15, 2025, showcased strong financial performance amid favorable market conditions, with the S&P 500 rising 14% year-over-year and 11% quarter-over-quarter.
Despite the positive results, BlackRock’s stock traded down 0.99% in premarket trading to $1,100.50, following a closing price of $1,111.46 on July 14. This slight pullback comes after significant stock appreciation since the company’s Q1 2025 earnings, when shares traded around $870.
Quarterly Performance Highlights
BlackRock reported Q2 2025 adjusted earnings per share of $12.05, up from $9.28 in Q2 2023, representing a 30% increase over two years. Quarterly operating income reached $2.099 billion with an operating margin of 43.3%, improving from 42.5% in Q2 2023 and slightly up from the 43.2% reported in Q1 2025.
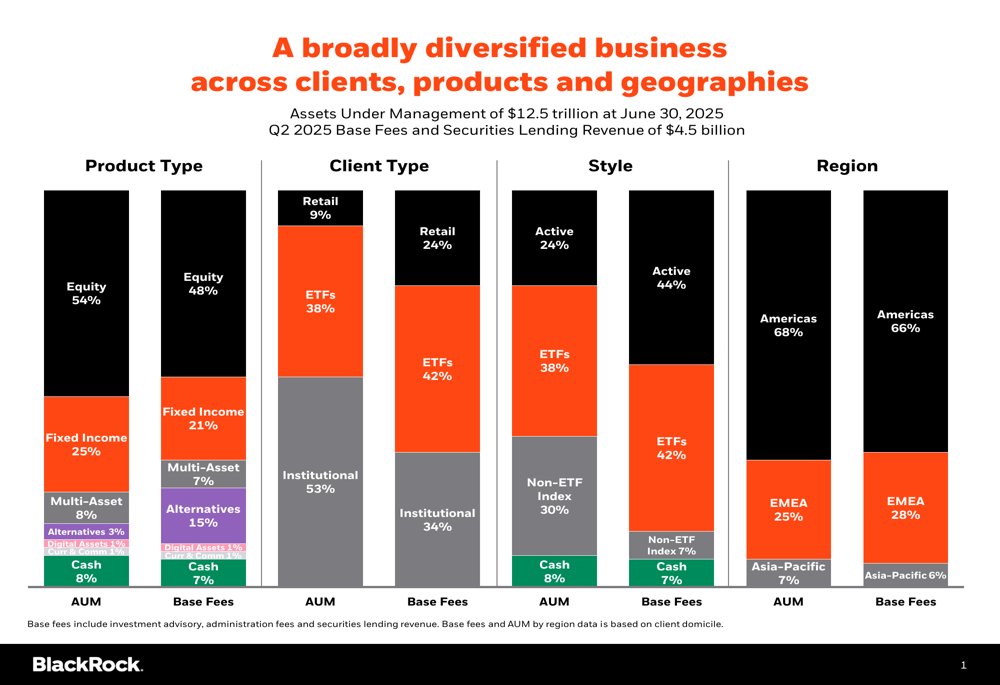
The company’s diversified business model continues to be a key strength, with revenue streams balanced across product types, client segments, and geographic regions.
As shown in the following breakdown of BlackRock’s business by product type, client type, style, and region:
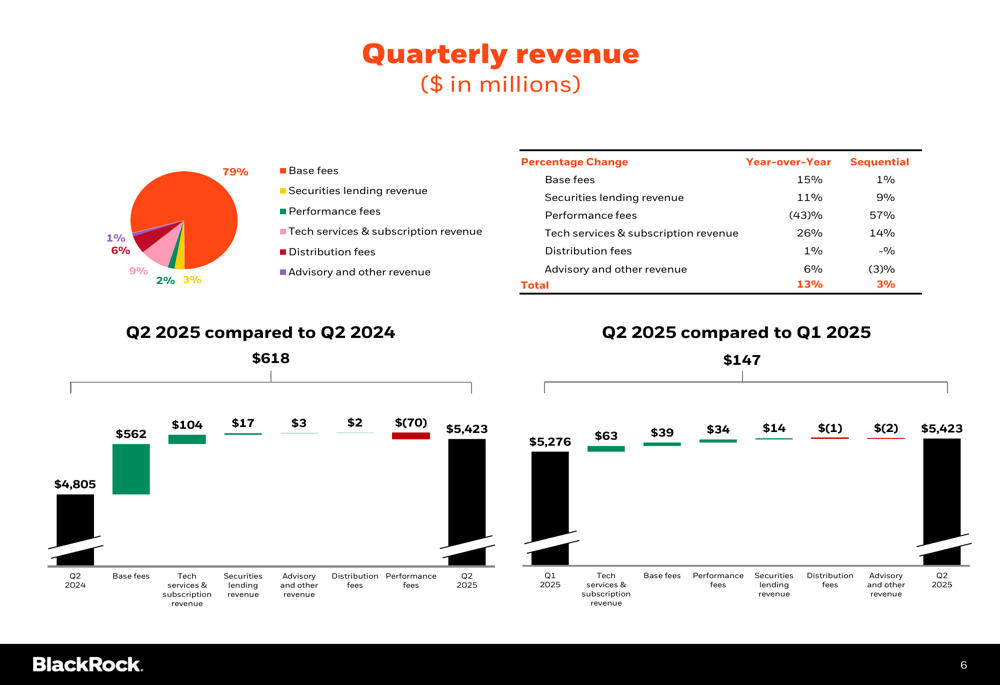
Total (EPA:TTEF) revenue for Q2 2025 reached $5.423 billion, representing an increase of $618 million compared to Q2 2024 and $147 million compared to Q1 2025. Base fees, which include investment advisory and administration fees plus securities lending revenue, accounted for 81% of total revenue.
The quarterly revenue analysis reveals strong growth across most revenue streams:
Detailed Financial Analysis
BlackRock’s expense management remains disciplined, with total expenses of $3.324 billion in Q2 2025, up from $2.924 billion in Q2 2024. Employee compensation and benefits represent the largest expense category at 50% of total expenses, followed by sales, asset, and account expenses at 32%.
The company maintained its share repurchase program at a consistent $375 million per quarter, while increasing its quarterly dividend to $5.21 per share in Q2 2025, up from $5.00 in previous quarters.
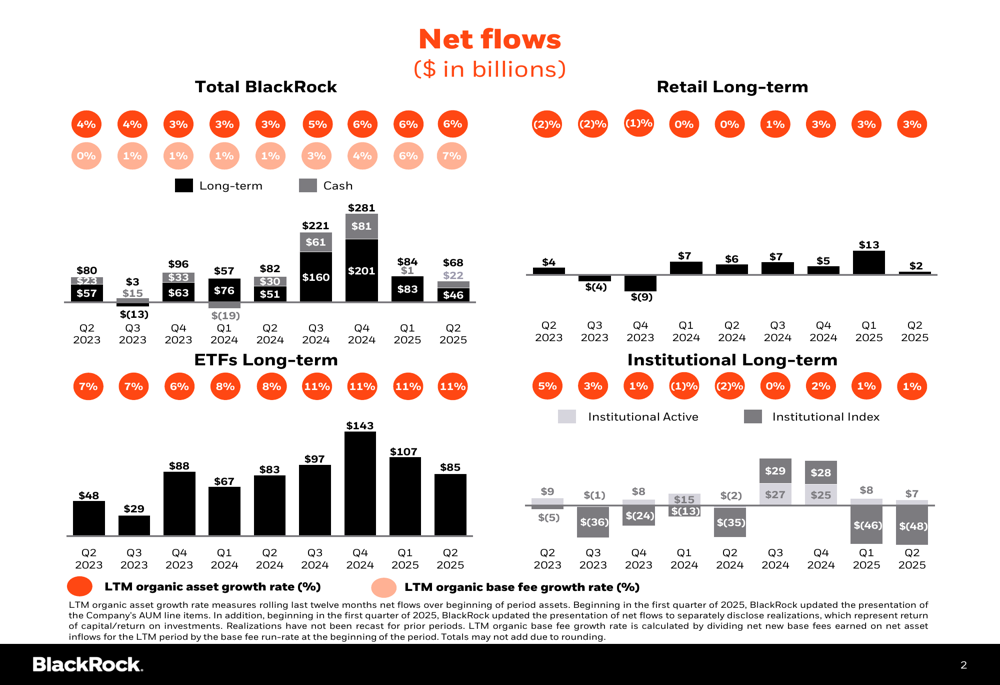
Net flows analysis shows continued organic growth across BlackRock’s business segments, with particularly strong performance in ETFs:
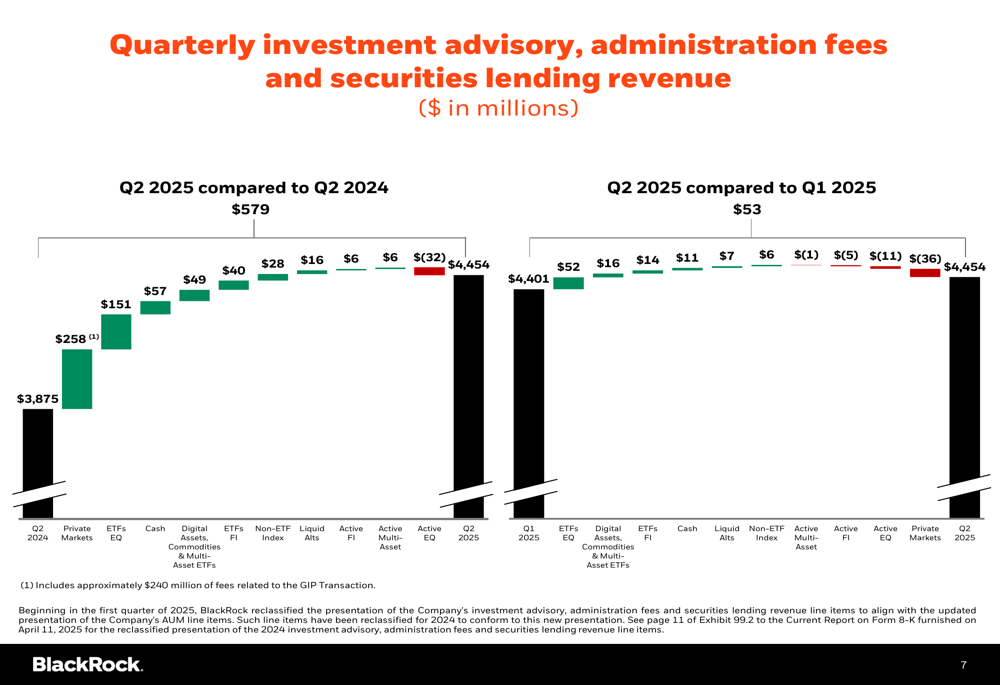
Investment advisory, administration, and securities lending revenue increased by $579 million year-over-year and $53 million quarter-over-quarter, reaching $4.454 billion in Q2 2025:
Strategic Initiatives
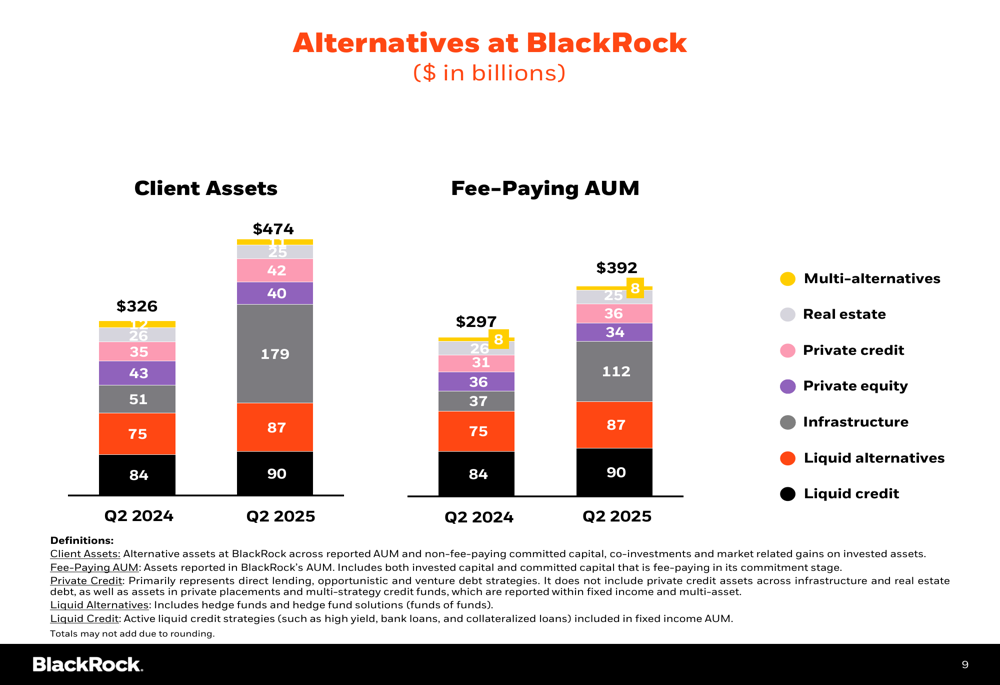
The alternatives business represents a key growth area for BlackRock, with client assets increasing from $326 billion in Q2 2024 to $474 billion in Q2 2025, a remarkable 45% year-over-year growth. This segment now accounts for 15% of base fees despite representing only 3% of AUM, highlighting its higher fee structure and strategic importance.
Infrastructure investments have become the largest component of BlackRock’s alternatives portfolio, followed by liquid credit and liquid alternatives:
Another notable development is the emergence of digital assets as a distinct asset class in BlackRock’s portfolio, now representing 1% of both AUM and base fees. This follows the company’s successful launch of Bitcoin ETFs and expansion into cryptocurrency-related investment products, as mentioned in previous earnings calls.
Profitability Trends
BlackRock’s profitability metrics show consistent improvement over the past two years, with both operating income and net income displaying steady growth:
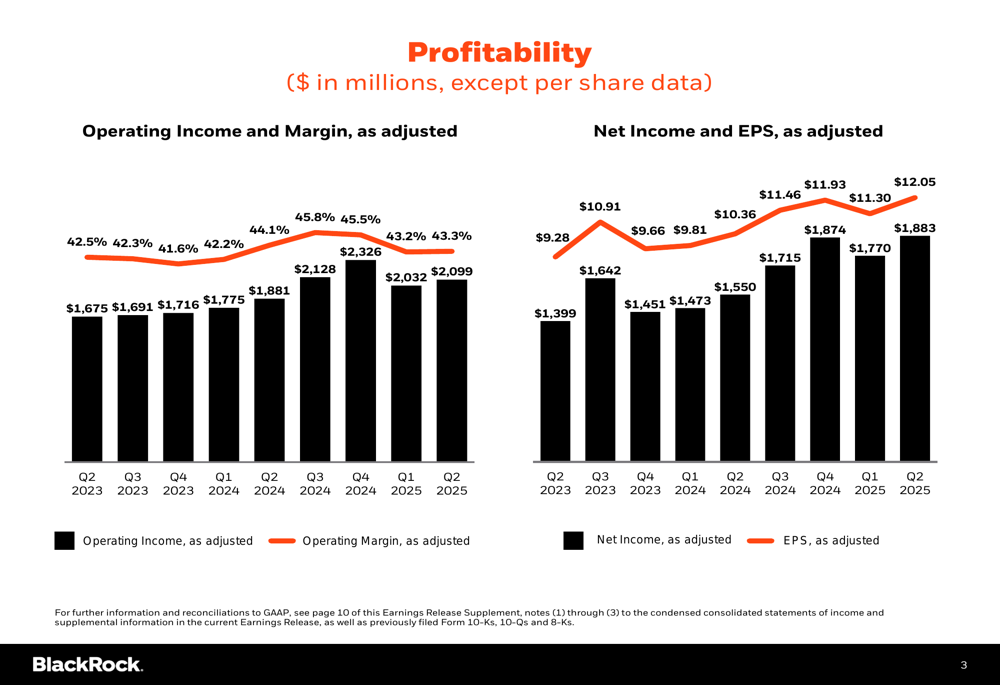
The company’s operating margin of 43.3% in Q2 2025 represents a 100 basis point improvement from Q2 2023 and continues the positive trend seen in Q1 2025, when operating margin was 43.2%.
Forward-Looking Statements
BlackRock’s presentation suggests continued confidence in its growth strategy, particularly in alternatives and digital assets. The company’s diversified business model positions it well to navigate varying market conditions, with balanced exposure across equity (54% of AUM), fixed income (25%), multi-asset (8%), and other categories.
The firm’s global footprint remains strong, with 68% of AUM from Americas, 25% from EMEA, and 7% from Asia-Pacific. This geographic diversification provides resilience against regional market fluctuations.
Market indices data included in the presentation shows generally positive trends, with most equity indices showing year-over-year gains. This favorable market environment has contributed to BlackRock’s AUM growth through both net inflows and market appreciation.
While the presentation maintains an optimistic outlook, investors will be watching closely for any signs of slowing growth or margin pressure in subsequent quarters, particularly given the slight pullback in premarket trading despite strong financial results.
Full presentation:
This article was generated with the support of AI and reviewed by an editor. For more information see our T&C.