Fubotv earnings beat by $0.10, revenue topped estimates

Executive Summary
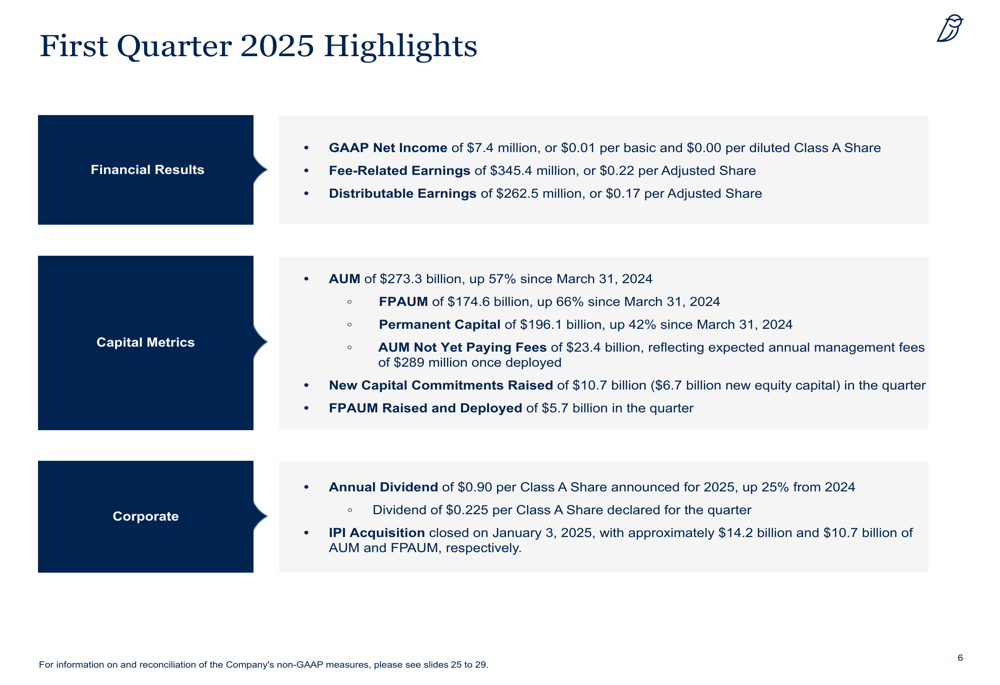
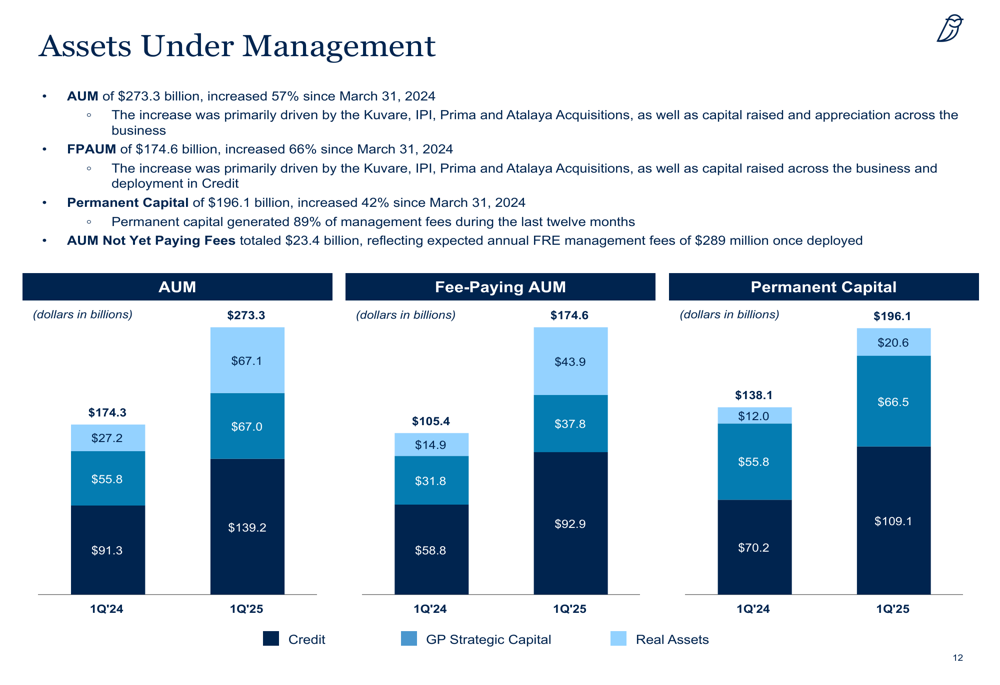
Blue Owl Capital Inc. (NYSE:OWL) reported substantial growth across key metrics in its first quarter 2025 earnings presentation released on May 1. The alternative asset manager saw its assets under management (AUM) surge to $273.3 billion, a 57% increase year-over-year, driven by strategic acquisitions and strong fundraising activity.
The company announced an annual dividend of $0.90 per Class A share for 2025, representing a 25% increase from 2024, and declared a quarterly dividend of $0.225 per share. Despite the impressive growth in AUM and fee-related earnings, GAAP net income attributable to Blue Owl was $7.4 million, down from $25.1 million in Q1 2024.
As shown in the following comprehensive summary of the quarter’s performance:
Quarterly Performance Highlights
Blue Owl reported fee-related earnings (FRE) of $345.4 million ($0.22 per adjusted share) and distributable earnings (DE) of $262.5 million ($0.17 per adjusted share) for Q1 2025. The company raised $10.7 billion in new capital commitments during the quarter, including $6.7 billion in new equity capital.
Management highlighted that Q1 2025 marked the 16th consecutive quarter of both FRE management fee and FRE sequential growth, demonstrating the company’s consistent performance trajectory.
As illustrated in the following chart showing the company’s earnings growth over the last twelve months:
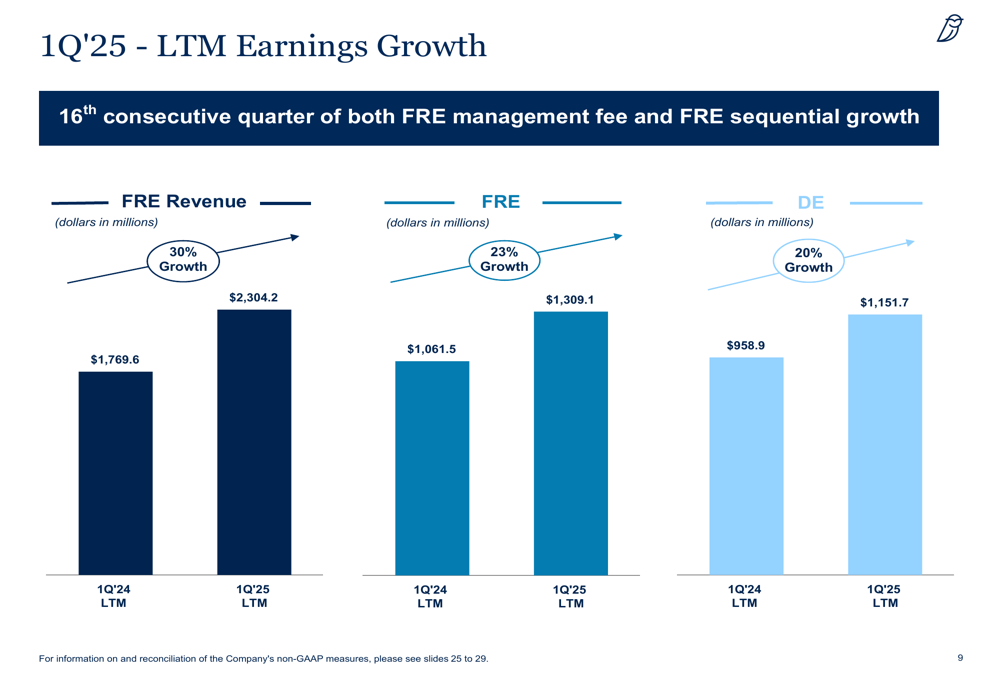
FRE revenue grew 30% year-over-year to $2.3 billion for the last twelve months ended March 31, 2025, while FRE increased 23% to $1.3 billion and DE rose 20% to $1.2 billion during the same period.
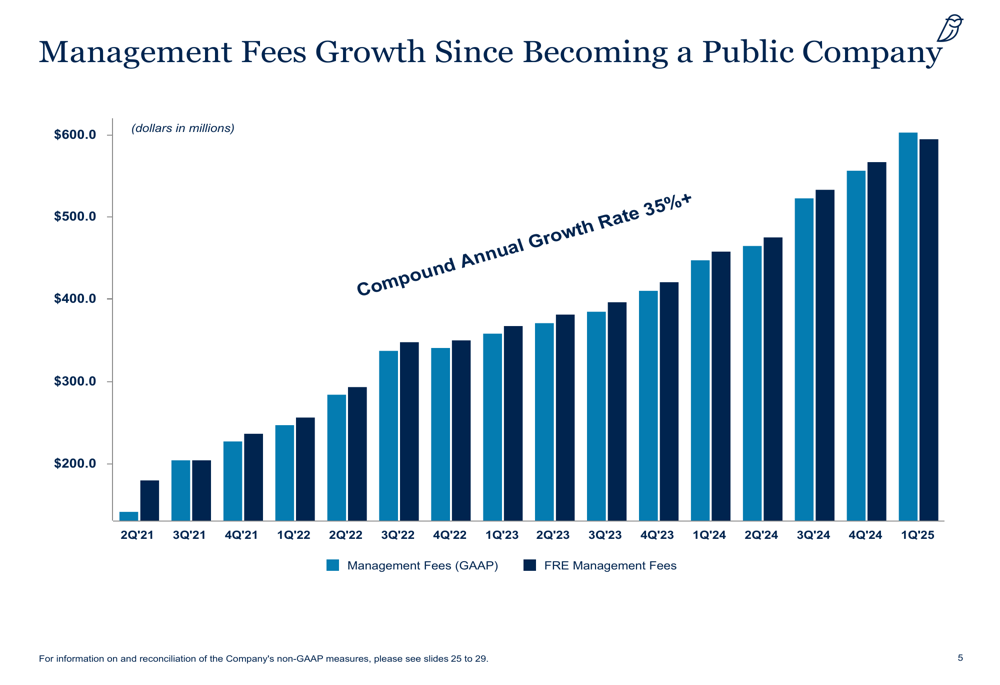
The company’s management fees have shown impressive growth since Blue Owl became a public company, with a compound annual growth rate exceeding 35%:
Strategic Initiatives
Blue Owl operates through three multi-strategy investment platforms: Credit, GP Strategic Capital, and Real Assets. Each platform demonstrated significant growth during the quarter, with particularly strong performance in the Real Assets segment.
As shown in the following overview of Blue Owl’s investment platforms:
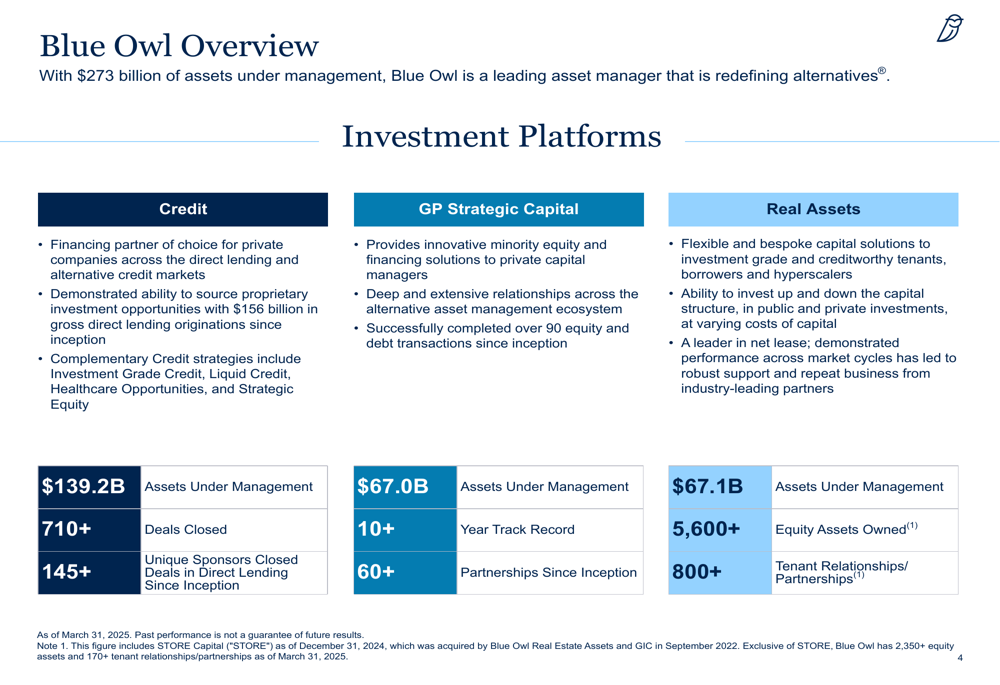
The Credit platform, Blue Owl’s largest segment, reached $139.2 billion in AUM, a 53% increase since March 31, 2024. This growth was primarily driven by the Kuvare and Atalaya acquisitions, as well as capital raised in direct lending products. Direct lending originations during the quarter were $12.8 billion with net deployment of $4.5 billion.
The GP Strategic Capital platform grew to $67.0 billion in AUM, up 20% year-over-year, driven by capital raised in the company’s sixth flagship minority equity stakes product and appreciation across the platform.
Most notably, the Real Assets platform saw explosive growth, with AUM increasing 146% year-over-year to $67.1 billion. This remarkable expansion was primarily attributed to the IPI, Prima, and Kuvare acquisitions, along with capital raised in the company’s real estate investment trust, European net lease product, and third vintage digital infrastructure product.
The following chart illustrates the substantial growth across all three platforms:
Forward-Looking Statements
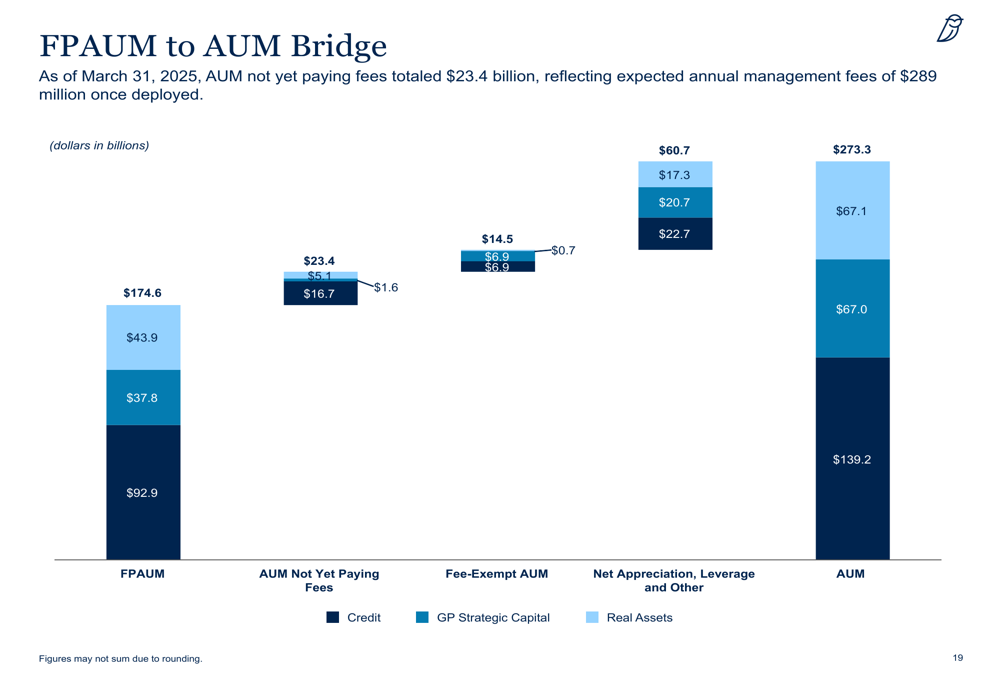
Blue Owl’s AUM not yet paying fees totaled $23.4 billion as of March 31, 2025, representing expected annual management fees of $289 million once deployed. This significant pipeline suggests continued growth in fee-generating assets in the coming quarters.
The following bridge chart provides a clear breakdown of the company’s AUM composition:
The company’s fundraising momentum remains strong, with $10.7 billion in new capital commitments raised during the quarter and $48.6 billion over the last twelve months. The quarterly equity fundraise of $6.7 billion was driven by $4.0 billion in Credit, $2.2 billion in Real Assets, and $0.6 billion in GP Strategic Capital.
Blue Owl’s financial position appears solid, with available liquidity of $1.1 billion and an average debt maturity of approximately 10 years. The company maintains investment-grade credit ratings (BBB+/Baa2) and a cost of debt of 3.8%.
Market Context
Despite the strong growth metrics presented in the earnings slides, Blue Owl’s stock was down 4.48% in premarket trading following the release, with the price at $17.70, according to available market data. This decline suggests investors may be focusing on the relatively modest GAAP net income of $7.4 million, which represents a significant decrease from the $25.1 million reported in Q1 2024.
The contrast between robust AUM growth and weaker bottom-line performance could be attributed to increased expenses related to the company’s acquisition strategy and integration costs. The presentation shows that GAAP expenses totaled $606.1 million for the quarter, with significant contributions from compensation and benefits ($325.9 million) and general, administrative, and other expenses ($190.7 million).
In the company’s previous earnings call for Q3 2024, management had expressed confidence in achieving mid-20% growth in FRE for both 2024 and 2025. The Q1 2025 results appear to be on track with those projections, as evidenced by the 23% year-over-year growth in FRE for the last twelve months.
The 25% increase in the annual dividend to $0.90 per Class A share for 2025 signals management’s confidence in the company’s continued growth trajectory and ability to generate strong cash flows, despite the modest GAAP earnings results.
Full presentation:
This article was generated with the support of AI and reviewed by an editor. For more information see our T&C.