BETA Technologies launches IPO of 25 million shares priced $27-$33

Introduction & Market Context
BOK Financial Corporation (NASDAQ:BOKF) reported first quarter 2025 earnings of $119.8 million, or $1.86 per diluted share, according to its Q1 earnings presentation released on April 22, 2025. This represents a decline from both the previous quarter ($136.2 million) and the same period last year ($163.7 million), continuing a downward trend in quarterly earnings performance.
The company’s stock has been under pressure recently, trading at $89.65 at the previous close, down 1.67% and significantly below its 52-week high of $121.58. In premarket trading following the earnings release, BOKF shares fell an additional 0.95% to $88.80.
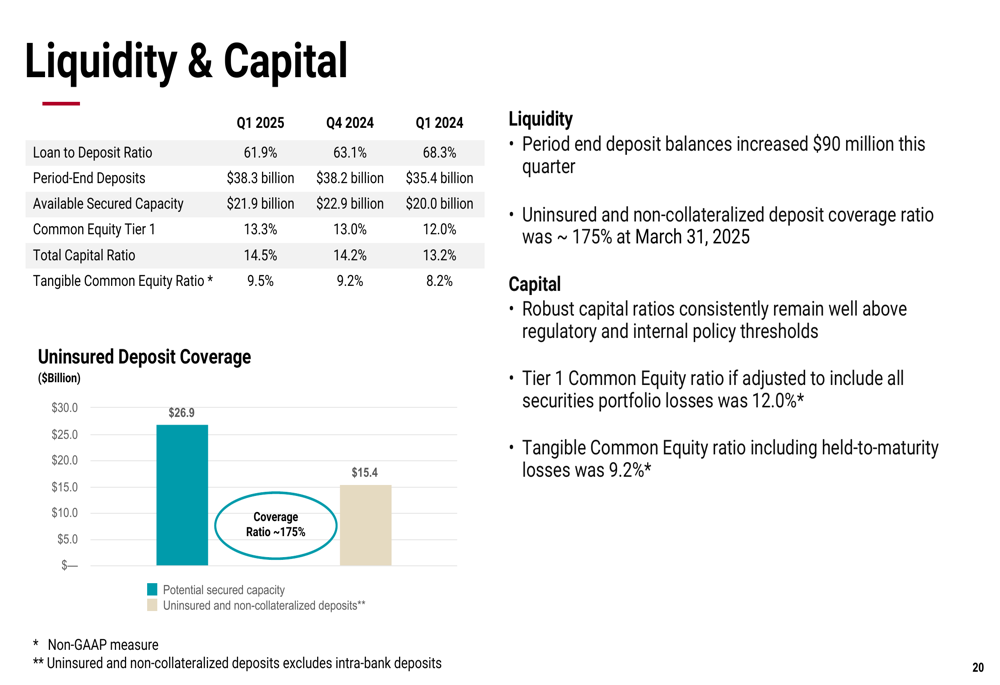
Despite the earnings decline, BOK Financial maintained strong capital and liquidity positions, with the tangible common equity ratio reaching 9.5% and a loan-to-deposit ratio of 62%, positioning the bank well for potential growth opportunities in the remainder of 2025.
Quarterly Performance Highlights
BOK Financial’s Q1 2025 results showed mixed performance across key metrics. Net income of $119.8 million represented a 12% decrease from the previous quarter’s $136.2 million and a 27% decline from $163.7 million in Q1 2024. The efficiency ratio deteriorated to 68.3% from 65.6% in the previous quarter.
Net interest income showed modest improvement, increasing by $3.2 million from the previous quarter to $316.3 million. The net interest margin expanded by 3 basis points to 2.78%, though the core net interest margin excluding trading declined by 4 basis points, indicating some pressure on the underlying lending business.
As shown in the following financial highlights chart, the company has experienced a consistent downward trend in quarterly earnings over the past year:
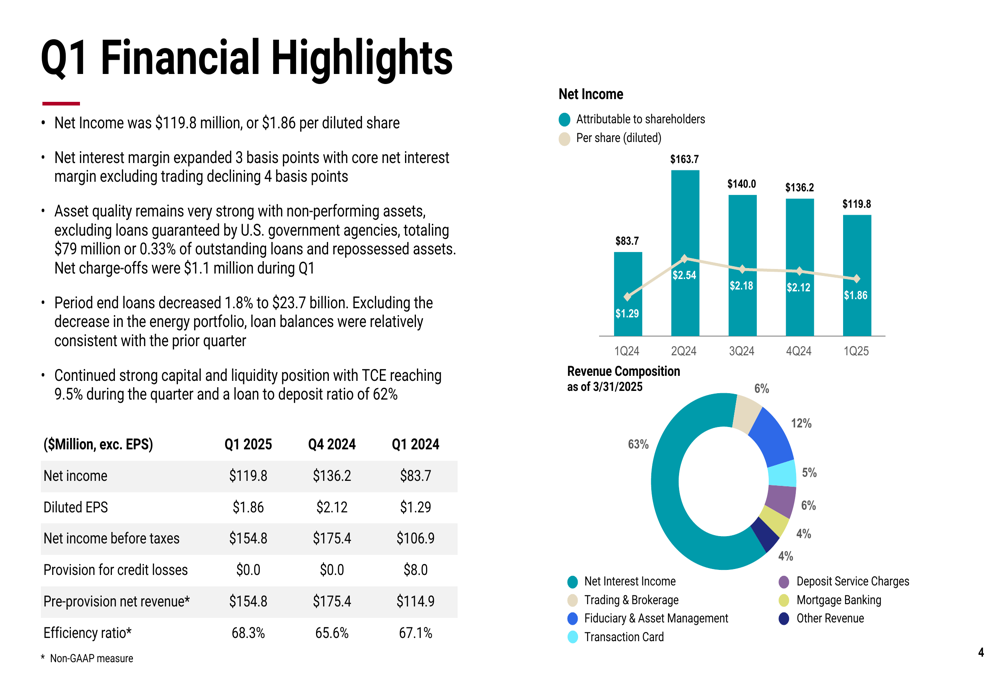
Period-end loans decreased 1.8% to $23.7 billion, though average loans remained relatively stable with a slight 0.2% increase. The company reported strong deposit performance with period-end deposits of $38.3 billion, representing an 8.2% increase year-over-year, while average deposits grew 9.5% compared to Q1 2024.
The company’s revenue composition remained diversified with net interest income accounting for 63% of total revenue, while various fee income streams contributed the remaining 37%, providing some resilience against interest rate fluctuations.
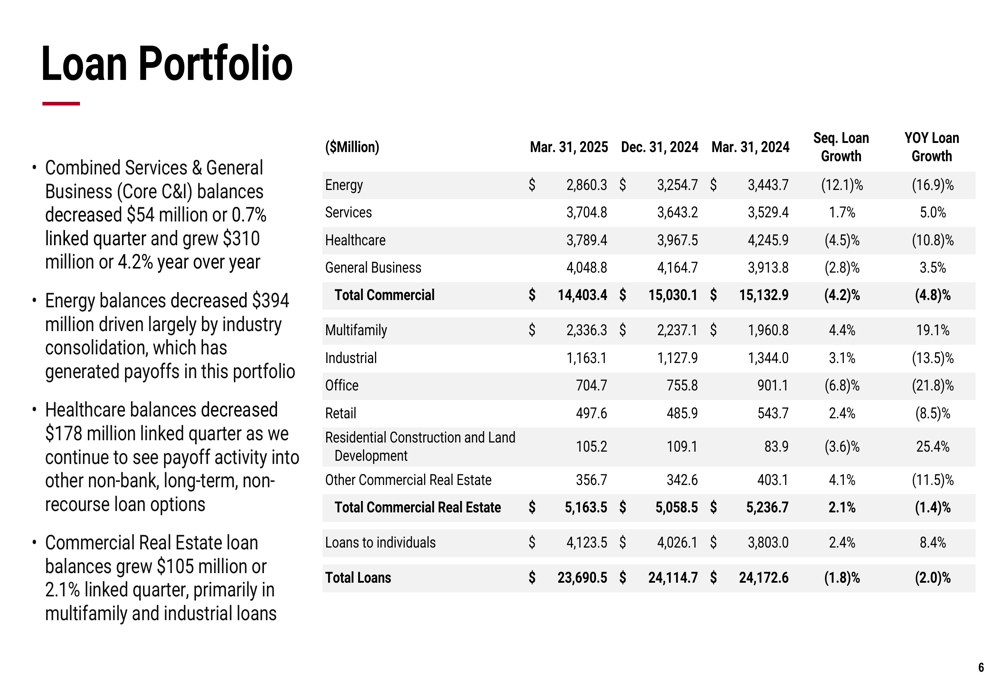
Loan Portfolio & Credit Quality
BOK Financial’s loan portfolio underwent significant compositional shifts during Q1 2025. The energy portfolio experienced the most dramatic change, decreasing 12.1% sequentially and 16.9% year-over-year to $2.86 billion. Healthcare loans also declined 4.5% from the previous quarter to $3.79 billion.
These decreases were partially offset by growth in other segments, with multifamily loans increasing 4.4% sequentially to $2.34 billion and loans to individuals growing 2.4% to $4.12 billion. Overall, commercial loans decreased 4.2% while commercial real estate loans increased 2.1%.
The detailed breakdown of the loan portfolio shows these significant shifts across various lending segments:
Despite the changes in loan composition, credit quality remained exceptionally strong. Non-performing assets, excluding loans guaranteed by U.S. government agencies, totaled just $79 million or 0.33% of outstanding loans and repossessed assets. Net charge-offs were minimal at $1.1 million during Q1, representing just 0.02% of average loans on an annualized basis.
The company’s credit metrics demonstrate continued strength in asset quality:
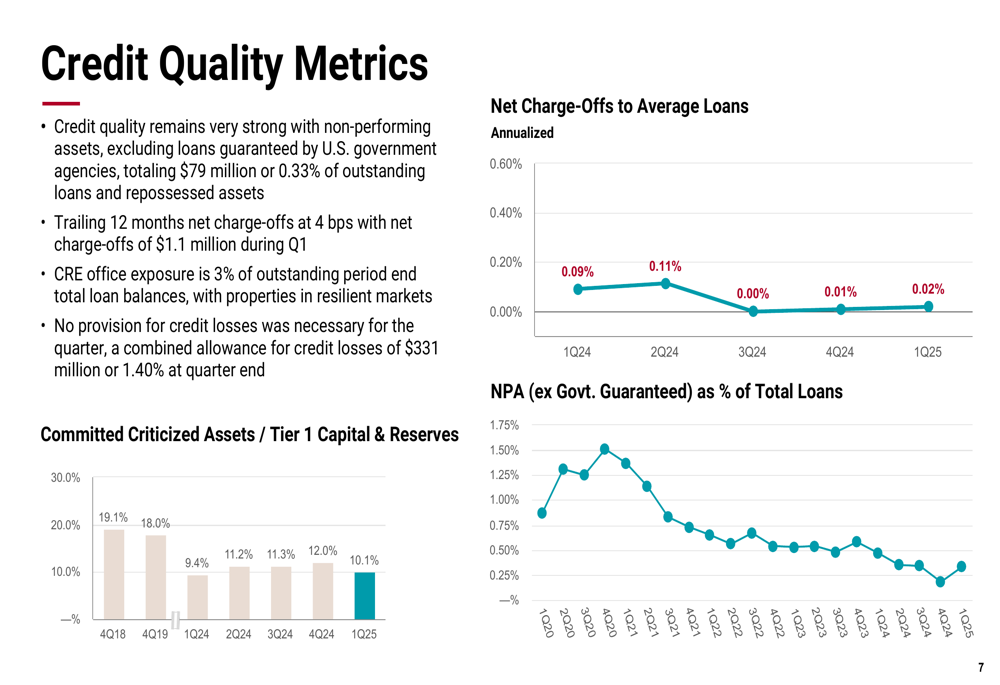
No provision for credit losses was necessary for the quarter, and the combined allowance for credit losses stood at $331 million, or 1.40% of outstanding loans at quarter-end. The company’s office CRE exposure remains limited at just 3% of total loan balances, reducing risk in this challenged sector.
Fee Income Performance
Fee income results were mixed in Q1 2025, with significant pressure in certain segments. Trading fee income declined dramatically by $25.0 million to $8.1 million, driven by lower trading volumes and tightened spreads affected by policy uncertainty. However, trading-related net interest income grew by $10.6 million as the yield curve steepened, partially offsetting this decline.
Mortgage banking revenue showed improvement, growing $1.7 million from the previous quarter to $19.8 million, driven by higher mortgage production as client demand began to increase and inventory constraints started to ease.
The following chart details the performance of various fee income streams:
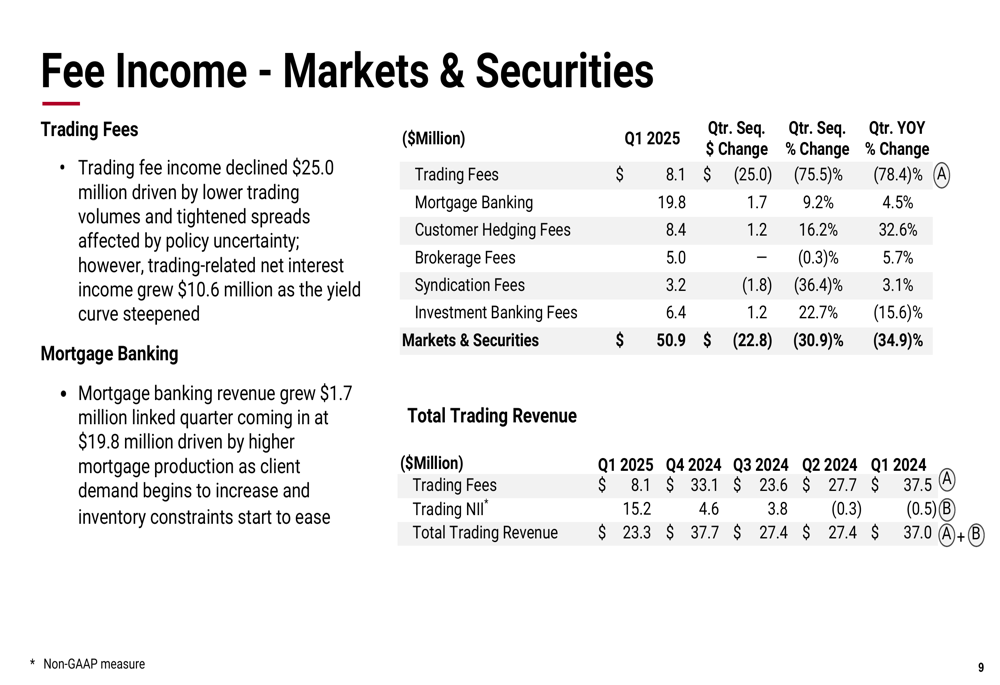
Fiduciary and asset management fees contributed $61.0 million to revenue, though assets under management or administration decreased by $659 million during the quarter due to decreased market valuations. Transaction (JO:NTUJ) card revenue grew to $27.1 million, representing a 6.3% increase from the previous quarter.
Interest Rate Positioning & Expenses
BOK Financial’s net interest income increased by $3.2 million from the previous quarter, driven by the continued upward repricing of fixed-rate securities and loans, as well as growth in trading portfolio net interest income, partially offset by lower loan fees.
The company’s yield on loans decreased to 6.71% from 7.01% in the previous quarter, while the cost of interest-bearing deposits also declined to 3.24% from 3.48%, reflecting the changing interest rate environment.
The following chart illustrates the trends in yields, rates, and margin:
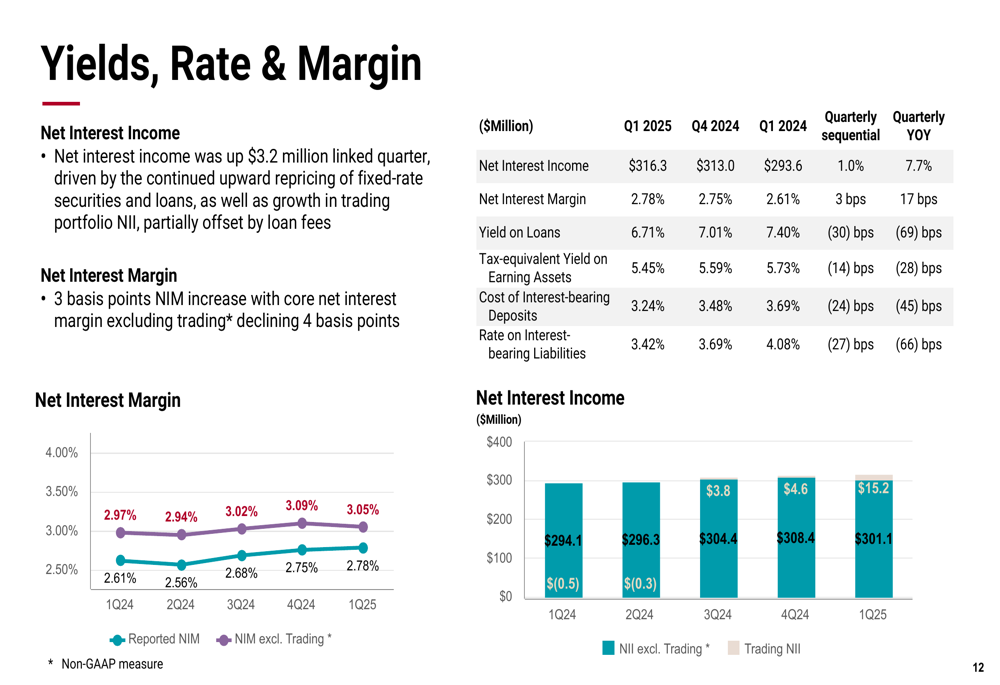
Operating expenses remained relatively flat at $347.5 million compared to $347.7 million in the previous quarter. Personnel expenses increased by $3.5 million, largely driven by annual merit increases, while non-personnel expenses decreased by $3.6 million, primarily due to a reduction in mortgage banking costs.
Forward-Looking Statements
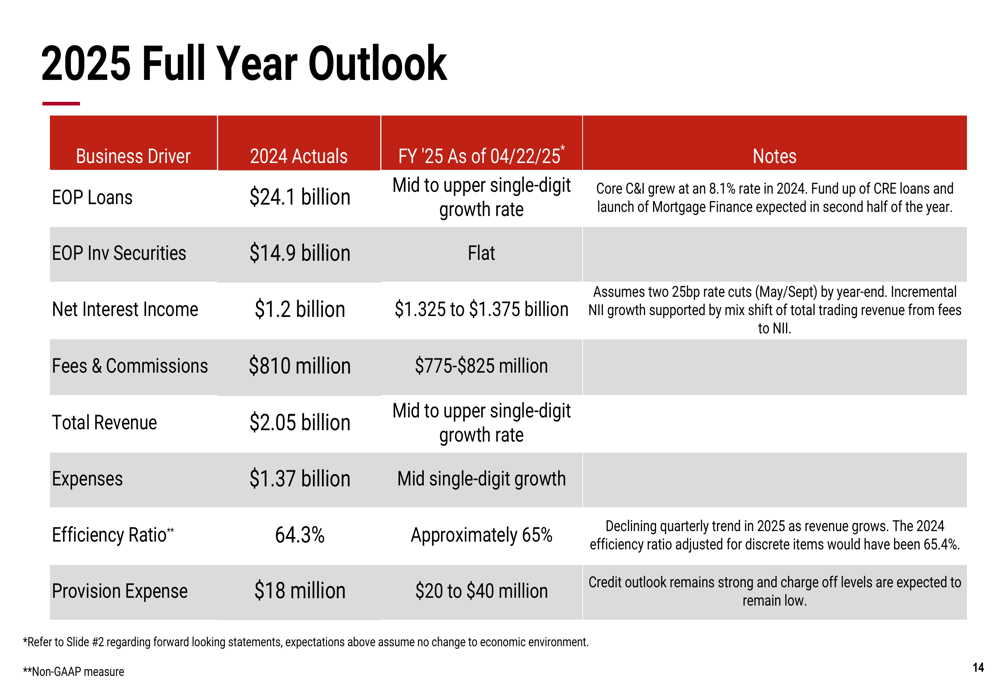
Despite the challenges in Q1, BOK Financial provided an optimistic outlook for the full year 2025. The company projects mid to upper single-digit loan growth, with net interest income expected to reach $1.325 to $1.375 billion, up from $1.2 billion in 2024.
Fee and commission income is forecast to range between $775 million and $825 million, while total revenue is expected to grow at a mid to upper single-digit rate. The company anticipates mid-single-digit expense growth with an efficiency ratio of approximately 65%, slightly higher than the 64.3% reported for 2024.
The detailed 2025 outlook provides specific guidance across key financial metrics:
The company’s capital and liquidity positions remain strong, with robust capital ratios well above regulatory and internal policy thresholds. The Tier 1 Common Equity ratio adjusted to include all securities portfolio losses was 12.0%, and the tangible common equity ratio including held-to-maturity losses was 9.2%.
BOK Financial’s uninsured and non-collateralized deposit coverage ratio was approximately 175% at March 31, 2025, demonstrating significant liquidity strength:
Risk Management & Credit Resilience
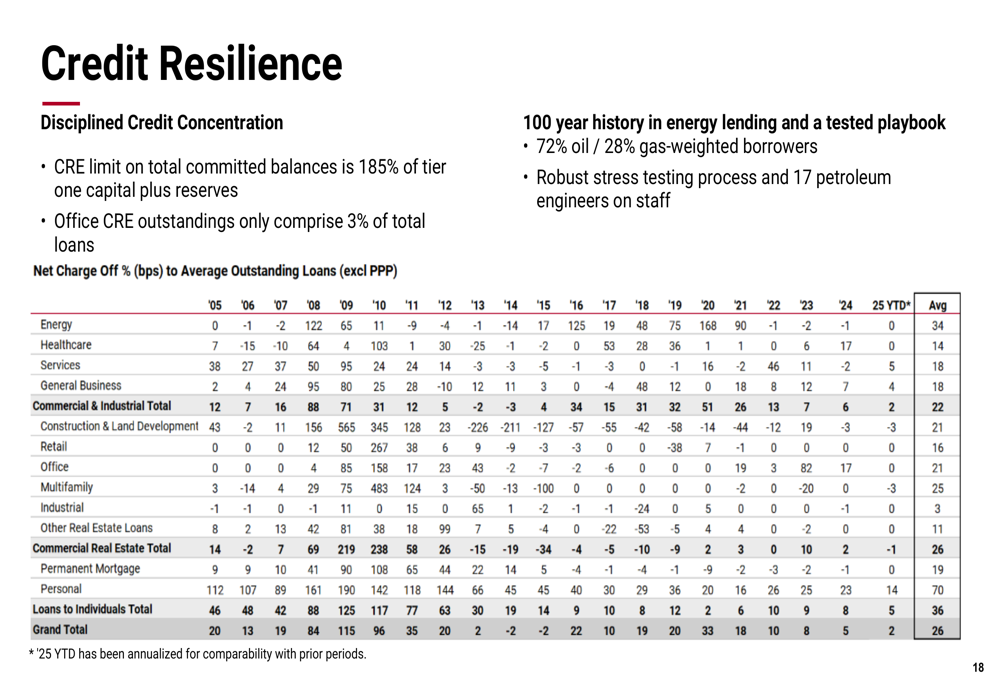
BOK Financial emphasized its disciplined approach to credit risk management, highlighting its CRE concentration limit of 185% of tier one capital plus reserves. The company’s 100-year history in energy lending provides it with a tested playbook for managing risks in this volatile sector.
The following chart illustrates the company’s long-term credit resilience across various economic cycles:
The company’s securities portfolio is positioned with a relatively short duration of 3.2 years, extending to only 3.8 years if rates increase 300 basis points. The RMBS portfolio is entirely "AAA" rated with an average credit enhancement of approximately 17%, and the portfolio runoff for Q1 2025 was $611 million.
Approximately 74% of the total loan portfolio is variable rate or fixed rate that reprices within a year, providing some protection against interest rate fluctuations. The company’s interest rate risk sensitivity analysis indicates a 0.28% positive impact on net interest income in a down 100 basis point scenario.
In conclusion, while BOK Financial faces earnings pressure and significant shifts in its loan portfolio, the company’s strong capital position, excellent credit quality, and diversified revenue streams provide a foundation for potential growth as outlined in its optimistic 2025 guidance.
Full presentation:
This article was generated with the support of AI and reviewed by an editor. For more information see our T&C.