Gold prices steady, holding sharp gains in wake of soft U.S. jobs data

Brown & Brown Inc (NYSE:BRO) reported strong first-quarter 2025 results on April 28, with double-digit growth in revenue and earnings per share, continuing the momentum from its solid performance in the previous quarter.
Quarterly Performance Highlights
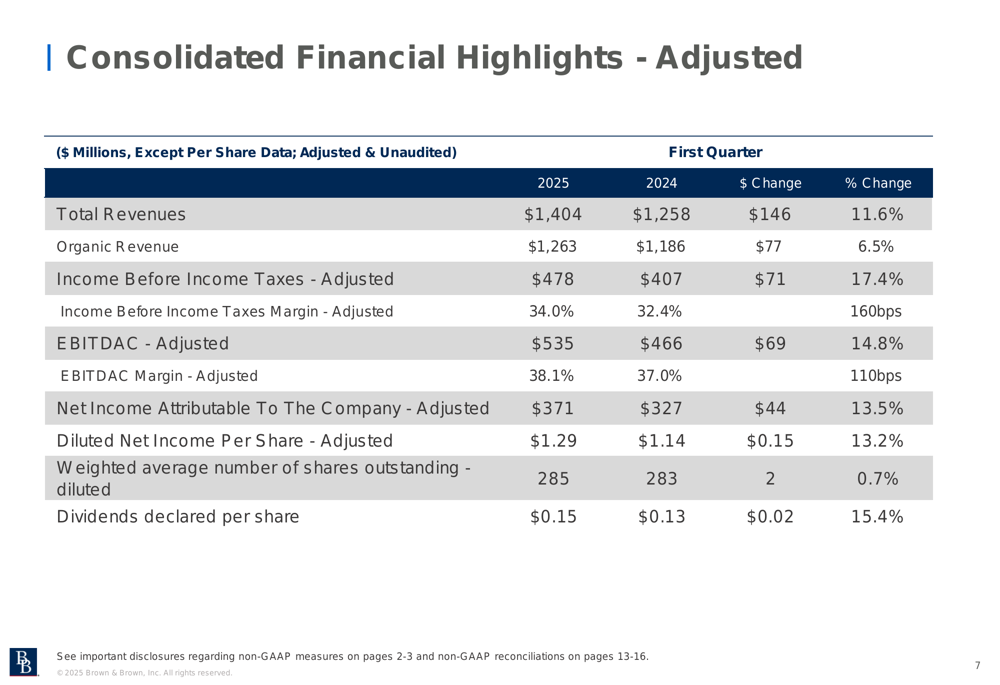
The insurance brokerage firm delivered total revenue of $1.4 billion in Q1 2025, representing an 11.6% increase compared to the same period last year. Organic revenue growth came in at 6.5%, while adjusted diluted net income per share rose 13.2% to $1.29, up from $1.14 in Q1 2024.
The company’s adjusted EBITDAC margin expanded by 110 basis points to 38.1%, reflecting improved operational efficiency. Brown & Brown also increased its quarterly dividend by 15.4% to $0.15 per share.
As shown in the following summary of Q1 2025 results:
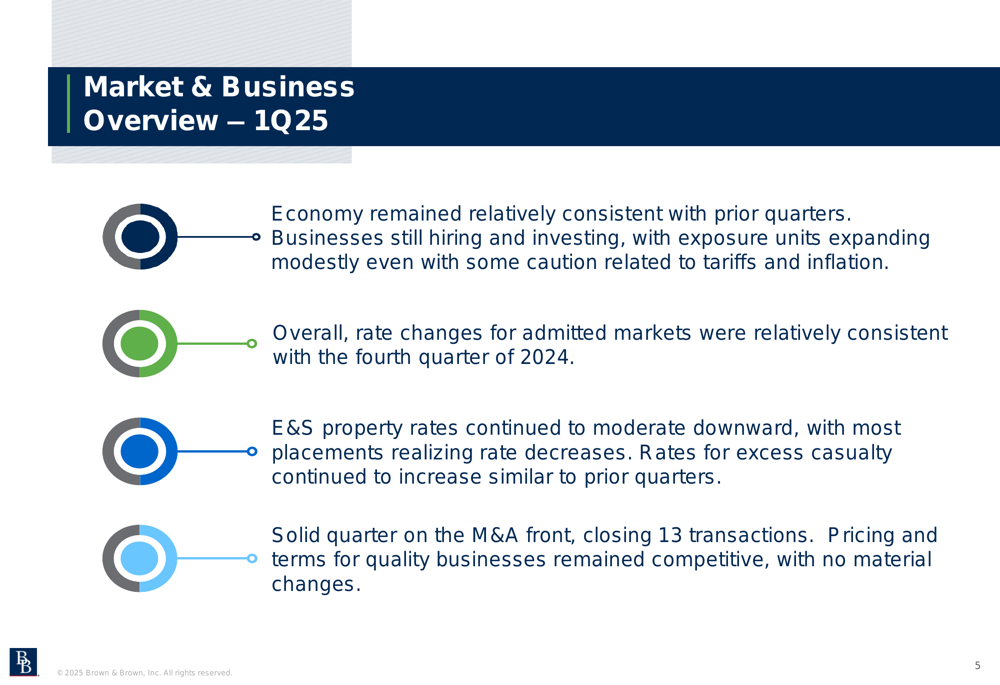
"The economy remained relatively consistent with prior quarters," noted the company in its presentation. "Businesses are still hiring and investing, with exposure units expanding modestly even with some caution related to tariffs and inflation."
The company completed 13 acquisitions during the quarter, adding approximately $36 million in annual revenue, demonstrating its continued focus on inorganic growth opportunities.
Detailed Financial Analysis
Brown & Brown’s consolidated financial performance showed significant improvement across multiple metrics. Income before income taxes (adjusted) increased by 17.4% to $478 million, while net income attributable to the company (adjusted) grew by 13.5% to $371 million.
The following table provides a comprehensive view of the company’s financial performance:
In the insurance market, Brown & Brown observed that rate changes for admitted markets remained relatively consistent with the fourth quarter of 2024. However, excess and surplus (E&S) property rates continued to moderate downward, with most placements realizing rate decreases, while rates for excess casualty continued to increase.
Segment Performance Analysis
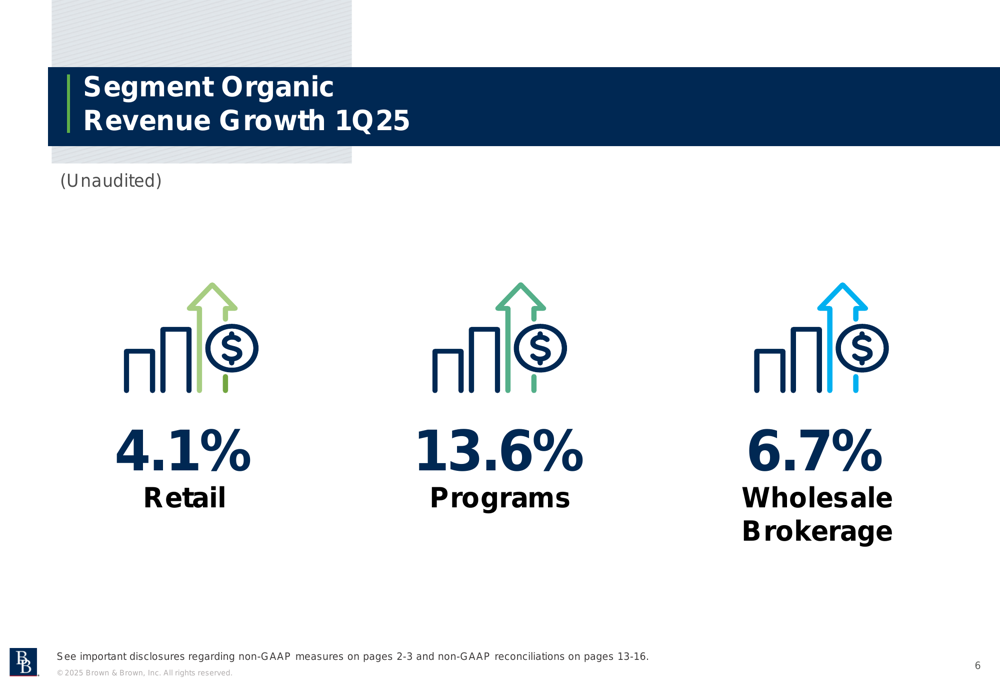
All three of Brown & Brown’s main operating segments delivered positive organic revenue growth, with the Programs segment leading the way at 13.6%, followed by Wholesale Brokerage at 6.7% and Retail at 4.1%.
The segment performance breakdown is illustrated in the following chart:
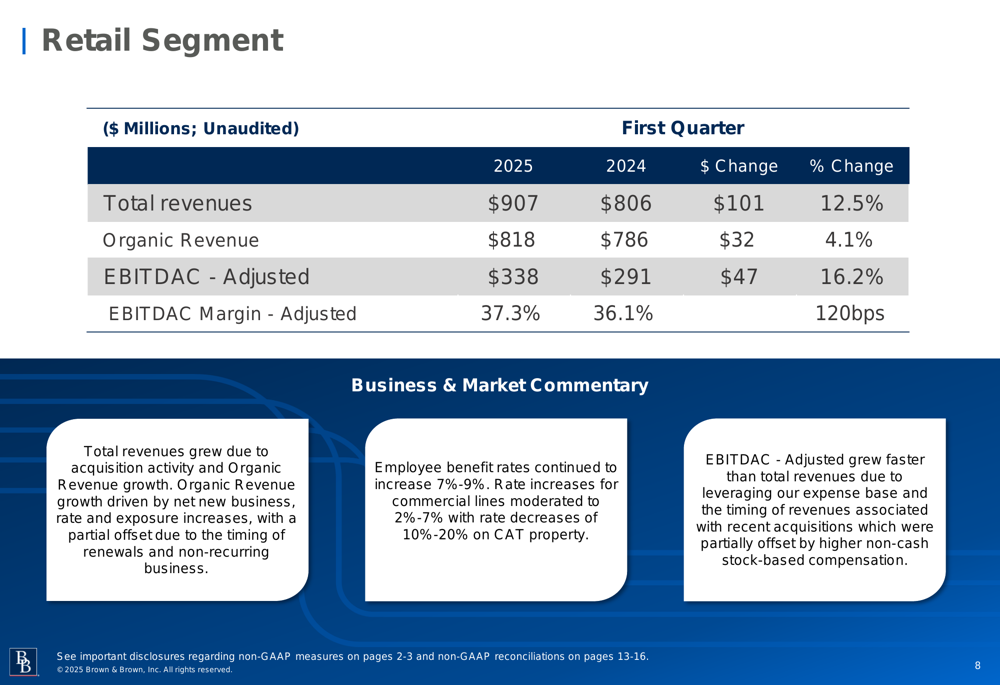
The Retail segment, which represents the largest portion of the company’s business, generated $907 million in total revenue, up 12.5% from the previous year. Organic revenue growth for this segment was 4.1%, while adjusted EBITDAC increased by 16.2% to $338 million. The segment’s adjusted EBITDAC margin expanded by 120 basis points to 37.3%.
The following slide details the Retail segment’s performance:
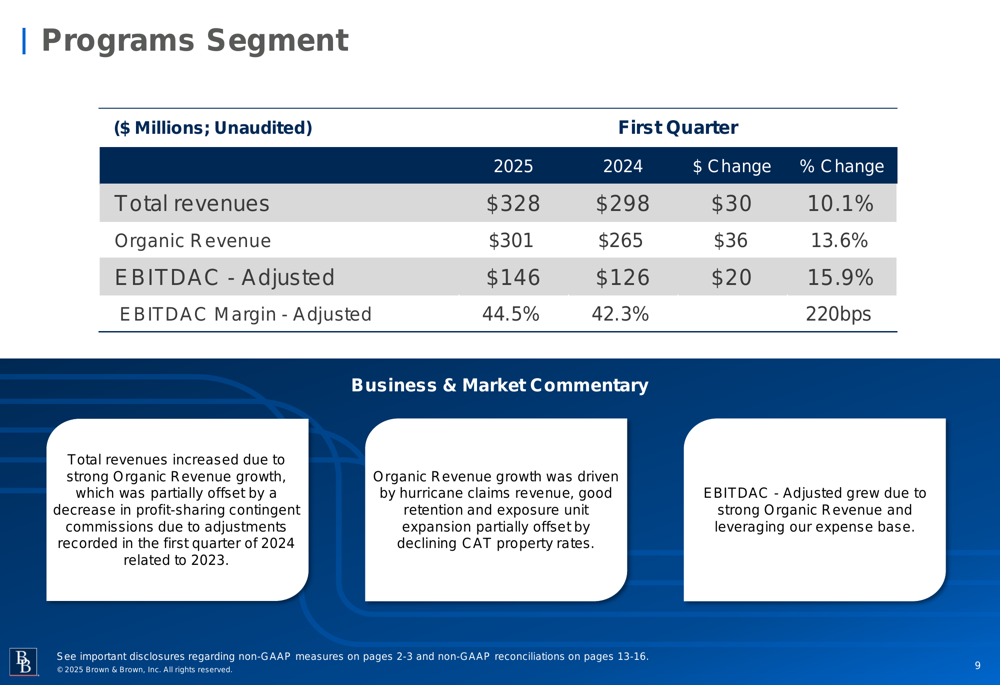
The Programs segment delivered the strongest organic growth at 13.6%, with total revenue increasing by 10.1% to $328 million. This segment also achieved the highest adjusted EBITDAC margin at 44.5%, an improvement of 220 basis points from the previous year.
The Programs segment’s performance is summarized below:
Meanwhile, the Wholesale Brokerage segment saw total revenue increase by 12.0% to $159 million, with organic revenue growth of 6.7%. However, this was the only segment to experience a margin contraction, with adjusted EBITDAC margin declining by 30 basis points to 32.1%.
Details of the Wholesale Brokerage segment’s performance are shown here:
Strategic Initiatives & Market Outlook
Brown & Brown continues to leverage its strong balance sheet and cash generation capabilities to pursue strategic acquisitions. The company noted that pricing and terms for quality businesses remained competitive, with no material changes in the M&A landscape.
Looking ahead, Brown & Brown expressed cautious optimism while acknowledging several factors that could influence future performance. "The outcome of trade negotiations, inflation and interest rate changes will influence the level of business investment in the future," the company stated in its outlook.
For the insurance market, Brown & Brown expects admitted rates to remain similar for the next couple of quarters, while catastrophe property rates for the second quarter are anticipated to decrease at levels similar to or slightly more than those seen in Q1 2025. The company specifically highlighted that "the ultimate impact of California wildfires continues to be an unknown," echoing concerns mentioned in its previous quarterly report.
Despite these challenges, Brown & Brown maintained a positive outlook regarding its ability to continue winning more net new business by leveraging its collective capabilities across segments.
In premarket trading following the presentation, Brown & Brown’s stock was down 0.68% at $114.10, after closing the previous session at $114.88. The stock has traded between $81.07 and $125.68 over the past 52 weeks, reflecting investor confidence in the company’s growth trajectory despite occasional market fluctuations.
Full presentation:
This article was generated with the support of AI and reviewed by an editor. For more information see our T&C.