Street Calls of the Week

Introduction & Market Context
Bufab Holding AB (BUFAB) presented its Q1 2025 financial results on April 24, 2025, highlighting a return to positive sales growth after several challenging quarters. The Swedish supplier of components and C-parts reported modest but encouraging results amid what management described as an "uncertain market climate." The company’s stock closed at 372.8 SEK on the day of the presentation, showing a minimal change of -0.05%.
President and CEO Erik Lundén emphasized the company’s improved profitability metrics despite mixed regional performance, pointing to successful margin enhancement initiatives and cost control measures as key drivers of the quarter’s results.
Quarterly Performance Highlights
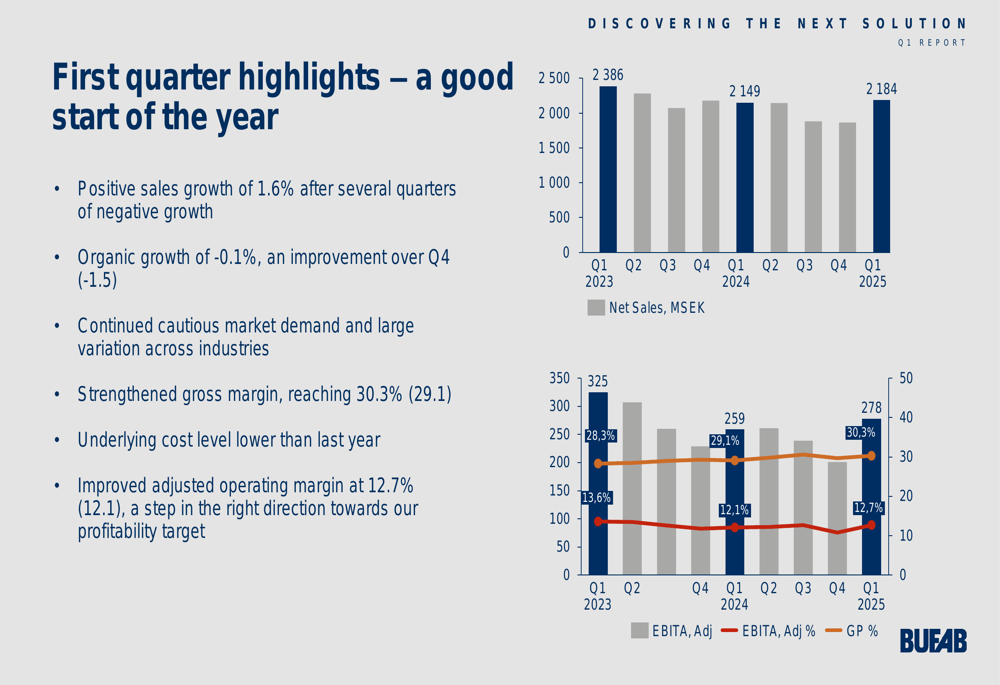
Bufab reported sales growth of 1.6% for Q1 2025, marking a positive turn after several quarters of contraction. While organic growth remained slightly negative at -0.1%, the company achieved significant improvements in profitability metrics, with gross margin strengthening to 30.3% (up from 29.1% in Q1 2024) and adjusted operating margin improving to 12.7% (up from 12.1%).
As shown in the following chart of key financial metrics, the company has demonstrated consistent margin improvement despite fluctuating sales:
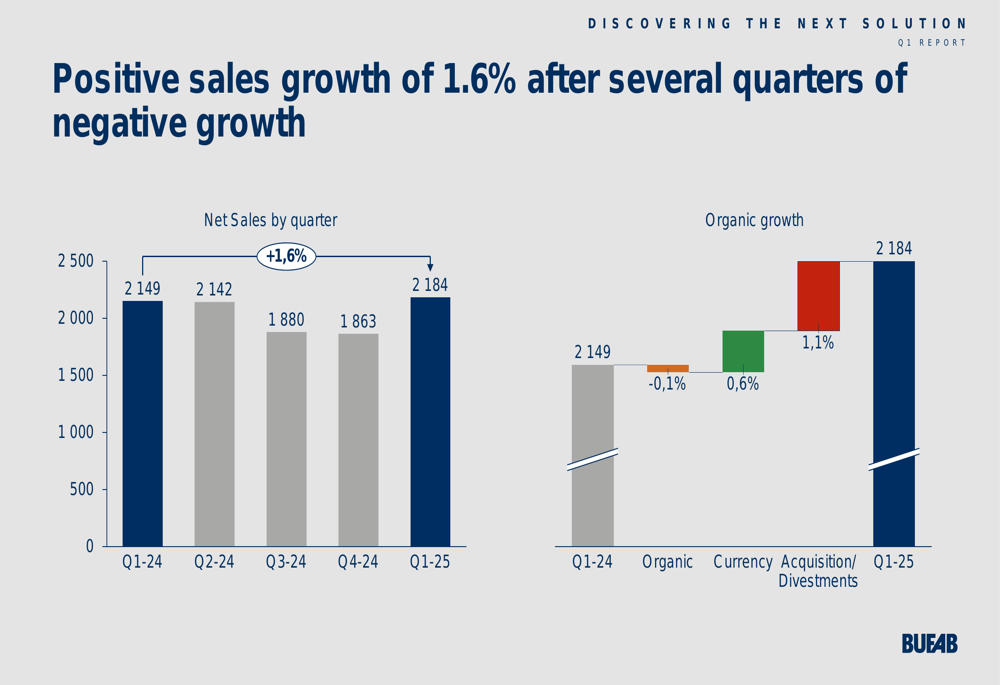
The return to sales growth was primarily driven by currency effects (0.6%) and acquisitions/divestments (1.1%), which more than offset the slight organic decline. This breakdown illustrates how Bufab has leveraged multiple growth levers to achieve positive momentum:
Detailed Financial Analysis
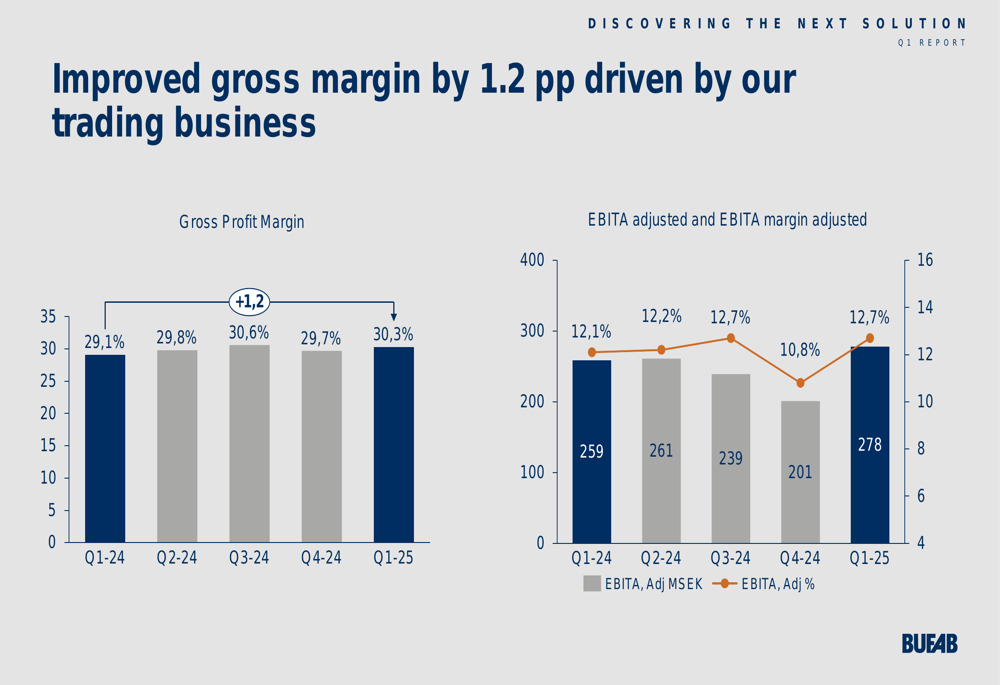
Bufab’s gross margin improvement of 1.2 percentage points was a standout achievement in the quarter, driven primarily by its trading business. This margin expansion, coupled with improved EBITA performance, reflects the company’s focus on value-added services and operational efficiency.
The following chart illustrates the consistent upward trend in gross margin over recent quarters:
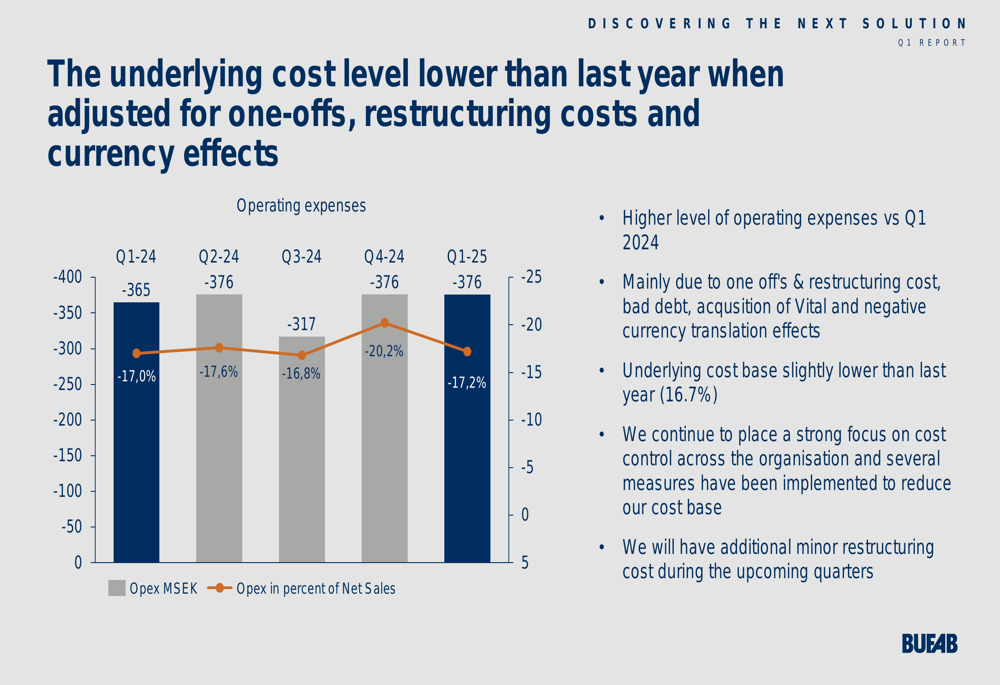
On the cost front, Bufab reported that its underlying cost level was lower than the previous year when adjusted for one-offs, restructuring costs, and currency effects. However, reported operating expenses were higher due to these factors, along with bad debt expenses and the acquisition of Vital.
The company’s cost control initiatives are detailed in this breakdown:
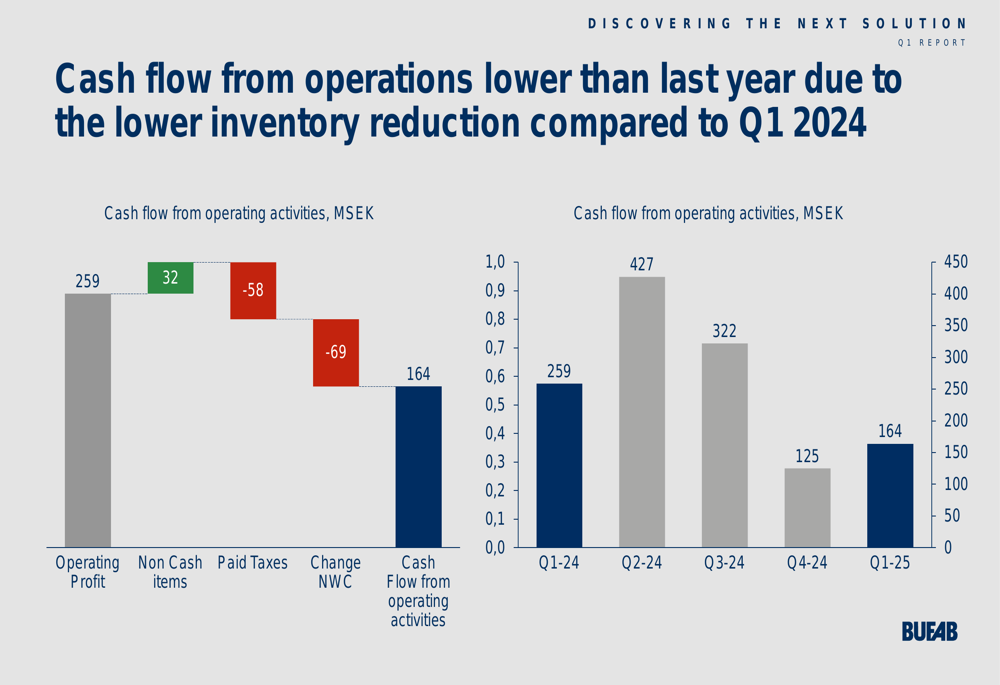
Cash flow from operations reached 164 MSEK in Q1 2025, lower than the 259 MSEK reported in Q1 2024. This decline was primarily attributed to a smaller inventory reduction compared to the previous year. The components of cash flow performance are illustrated here:
Bufab also made progress in reducing its debt position, with net debt declining to 2,548 MSEK from 2,757 MSEK in the previous quarter. The net debt to EBITDA ratio improved to 2.5, down from 2.8 in Q4 2024, indicating strengthened financial stability.
Regional Performance Analysis
Bufab’s regional performance showed significant variation across its global operations, with Europe West and Asia-Pacific delivering strong growth while other regions faced challenges.
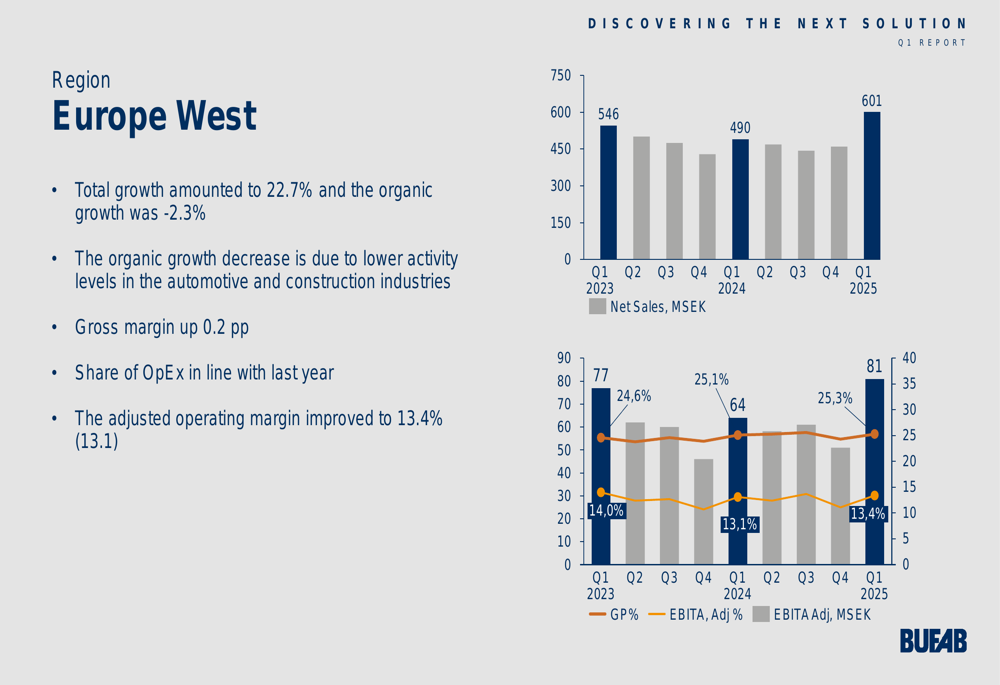
Europe West emerged as a standout performer with 22.7% total growth, though organic growth was negative at -2.3% due to lower activity in automotive and construction industries. The adjusted operating margin improved slightly to 13.4% from 13.1% in Q1 2024.
The regional breakdown is shown in this chart:
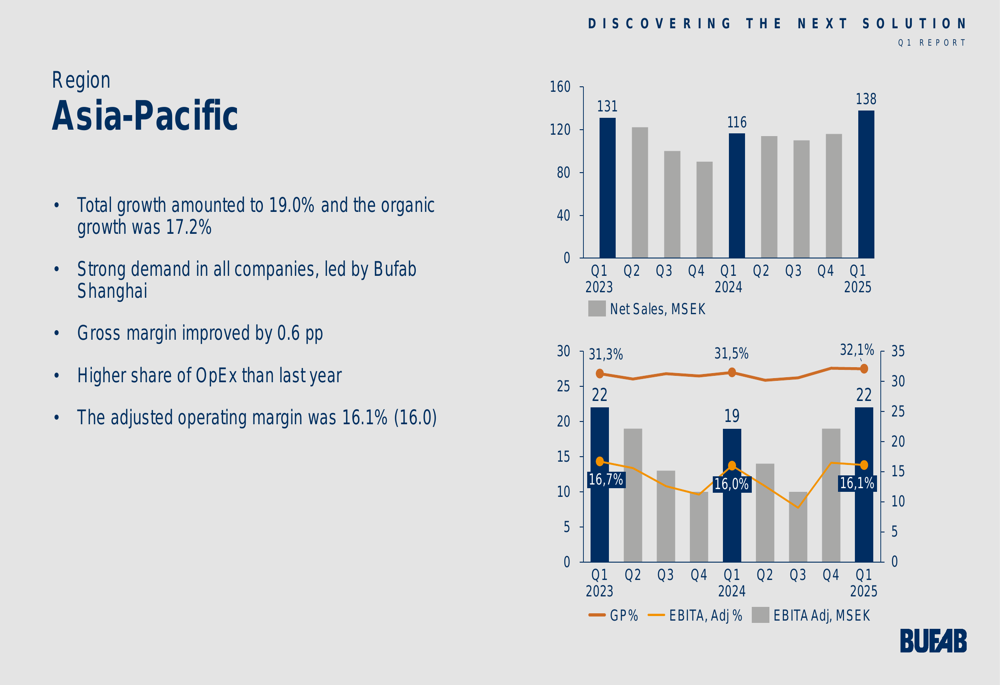
Asia-Pacific delivered impressive 19.0% total growth, with strong demand across all companies, particularly in Shanghai. The region maintained a robust adjusted operating margin of 16.1%, slightly up from 16.0% in the prior year.
In contrast, Europe North & East experienced an 11.0% decline in total sales, though organic growth was positive at 0.8%. Despite the sales contraction, the region achieved a significant improvement in adjusted operating margin, reaching 14.2% compared to 10.6% in Q1 2024.
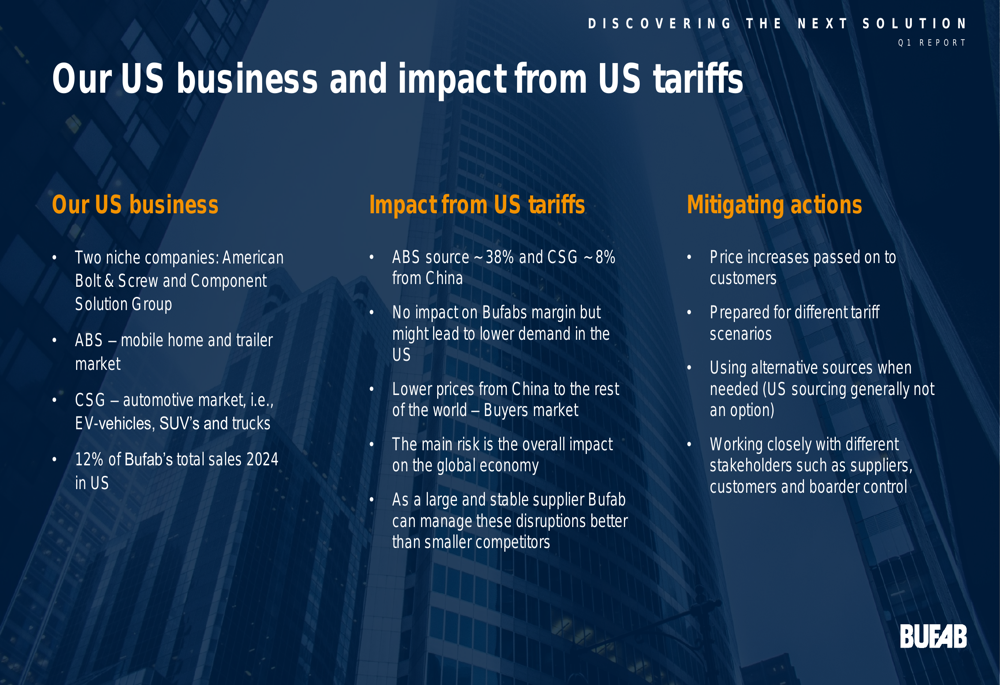
The Americas region faced headwinds with total growth of -1.5% and organic growth of -4.2%, though demand remained stable in the important RV and trailer markets. The adjusted operating margin declined slightly to 12.5% from 12.9%.
A particular challenge for Bufab’s US operations is the impact of tariffs on Chinese imports. The company outlined its exposure and mitigation strategies:
Strategic Initiatives & Outlook
Despite the mixed regional performance and ongoing market uncertainties, Bufab’s management expressed optimism about the company’s trajectory. The strategic focus remains on securing new business, improving margins, and optimizing net working capital.
The company’s leadership highlighted several measures implemented to reduce the cost base, which should continue to support margin improvement in coming quarters. However, they also noted that additional minor restructuring costs are expected in upcoming periods.
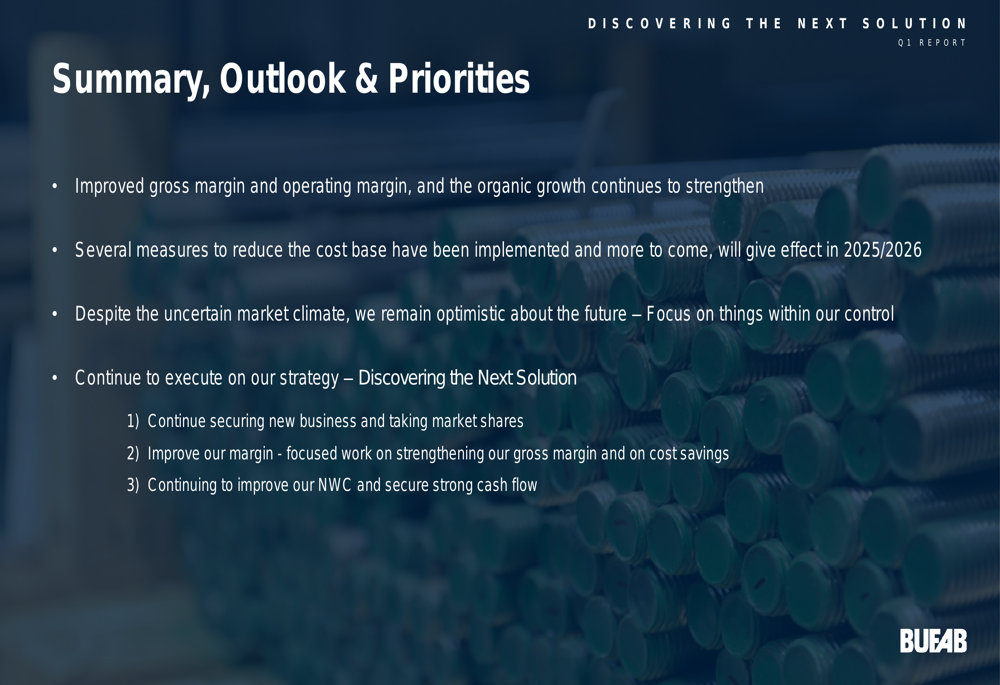
As shown in the summary slide, Bufab’s priorities reflect a balanced approach to growth and operational efficiency:
In conclusion, Bufab’s Q1 2025 results demonstrate the company’s resilience in challenging market conditions, with its focus on margin improvement and cost control yielding positive results despite uneven regional performance. The return to sales growth, coupled with strengthened profitability metrics, positions the company well for continued progress as it navigates an uncertain global economic environment.
Full presentation:
This article was generated with the support of AI and reviewed by an editor. For more information see our T&C.