Gold soars to record high over $3,900/oz amid yen slump, US rate cut bets

Introduction & Market Context
Bufab Holding AB (STO:BUFAB) presented its Q2 2025 results on July 15, revealing a mixed performance characterized by revenue challenges but improved profitability. The company’s stock closed at 94.05 SEK on July 14, down 1.63% ahead of the earnings presentation, reflecting cautious market sentiment.
The C-suite team, led by President & CEO Erik Lundén and CFO Pär Ihrskog, emphasized the company’s ability to strengthen margins despite facing headwinds from currency effects and varied demand across industries. This performance comes against a backdrop of global economic uncertainties and continued impact from US tariffs.
Quarterly Performance Highlights
Bufab reported total revenue of 2,039 MSEK for Q2 2025, down 4.8% compared to Q2 2024, with the decline primarily attributed to currency effects (-4.9%). Organic growth remained slightly negative at -0.3%, while acquisitions/divestments contributed 0.4% to growth.
As shown in the following chart detailing the company’s quarterly performance, Bufab managed to strengthen its gross margin to 31.1% (from 29.8% in Q2 2024) while improving its adjusted operating margin to 13.1% (from 12.2%):
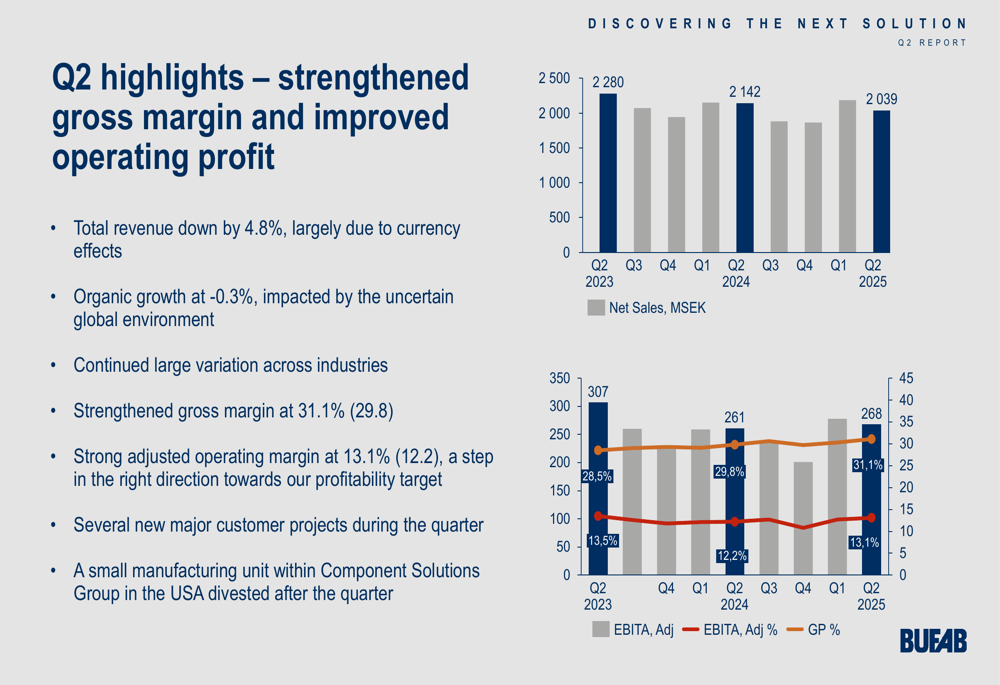
This margin improvement demonstrates Bufab’s effective pricing strategy and cost control measures. The company’s operating expenses decreased by 8 million SEK year-on-year, reflecting good cost control and favorable currency effects, though the cost level as a share of revenue increased slightly due to lower sales volumes and inflation.
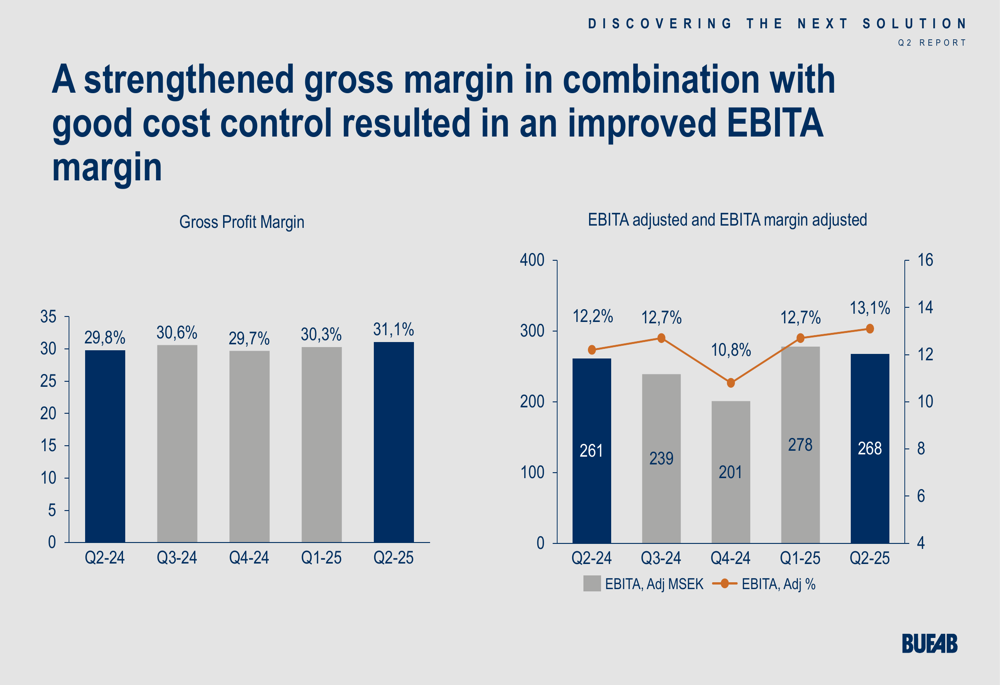
The following chart illustrates the consistent improvement in gross profit margin over recent quarters, alongside the strong adjusted EBITA performance:
Regional Performance Analysis
Bufab’s regional performance showed significant variation, with some regions demonstrating remarkable resilience despite challenging market conditions.
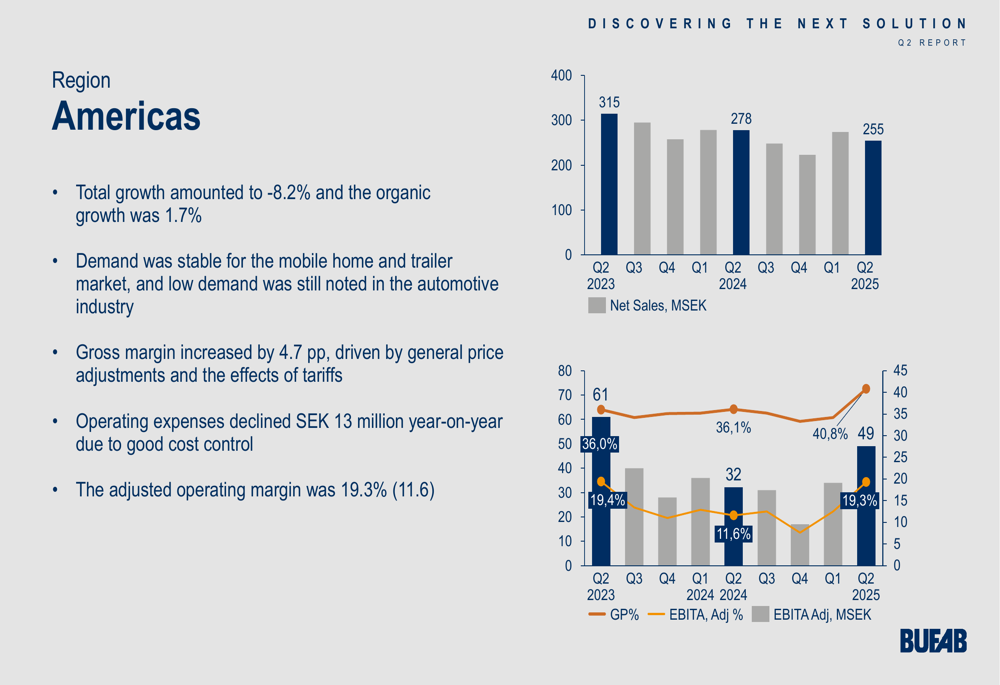
The Americas region delivered the most impressive margin improvement, with adjusted operating margin jumping to 19.3% from 11.6% in Q2 2024. This was achieved despite an 8.2% decline in total growth, as organic growth remained positive at 1.7%. The gross margin increased by 4.7 percentage points to 40.8%, driven by general price adjustments and tariff effects.
As shown in the following chart of the Americas performance:
Europe North & East experienced a 14.9% decline in total growth, though organic growth was nearly flat at -0.1%. Despite this, the region improved its adjusted operating margin to 14.0% (from 11.7%), with gross margin improving by 2.8 percentage points to 31.2%.
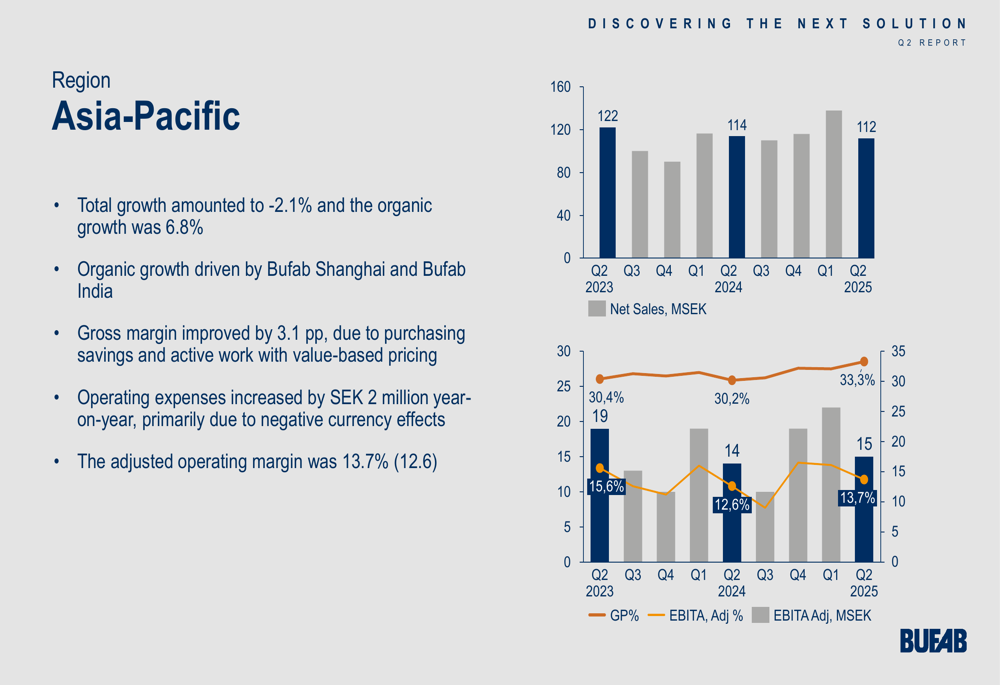
The Asia-Pacific region demonstrated strong organic growth of 6.8%, though total growth declined by 2.1% due to currency effects. The region improved its gross margin by 3.1 percentage points to 33.3% and its adjusted operating margin to 13.7% (from 12.6%).
Europe West was the only region to post significant total growth at 18.5%, though organic growth was slightly negative at -0.4%. The adjusted operating margin decreased slightly to 11.8% (from 12.4%).
The UK & Ireland region faced the most significant challenges, with total growth down 8.5% and organic growth down 4.1%. The adjusted operating margin declined to 10.8% (from 12.7%), with gross margin declining by 0.7 percentage points to 32.5%.
US Tariffs Impact
Bufab provided a detailed analysis of the impact of US tariffs on its business. The company’s US operations, which account for 12% of total sales, are conducted through two niche companies: American Bolt & Screw (ABS) and Component Solution Group (CSG). ABS sources approximately 38% of its products from China, while CSG sources about 8%.
The following slide details the company’s US business structure and the impact of tariffs:
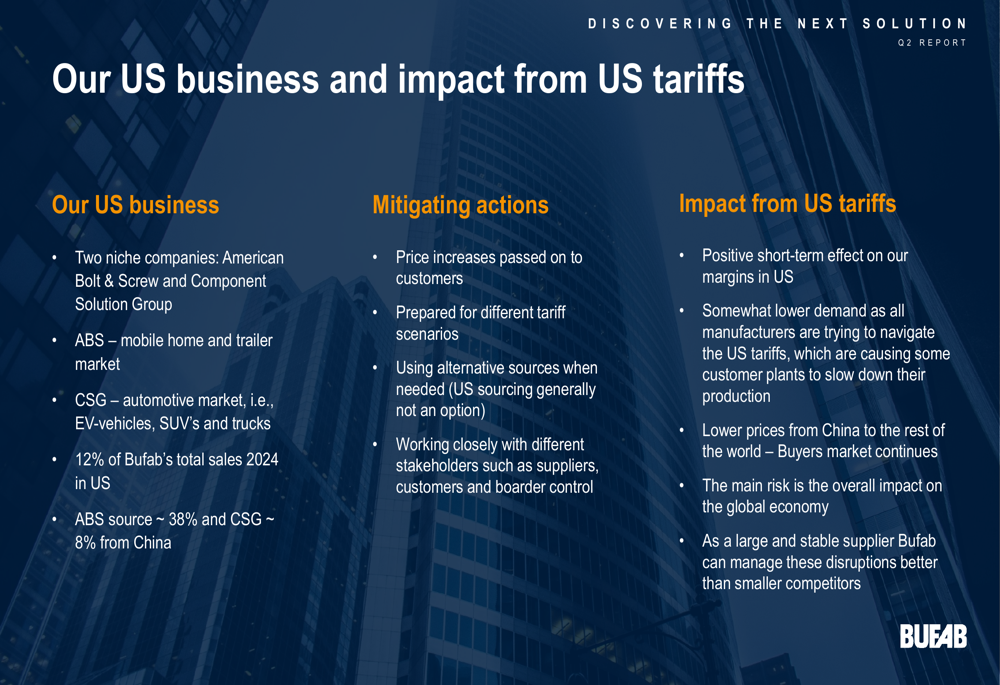
The company noted several effects from US tariffs, including a positive short-term impact on US margins as price increases were passed on to customers. However, overall demand has been affected as manufacturers navigate the tariff landscape, causing some customer plants to slow production. Bufab emphasized that as a large and stable supplier, it can manage these disruptions better than smaller competitors.
Cash Flow and Debt Position
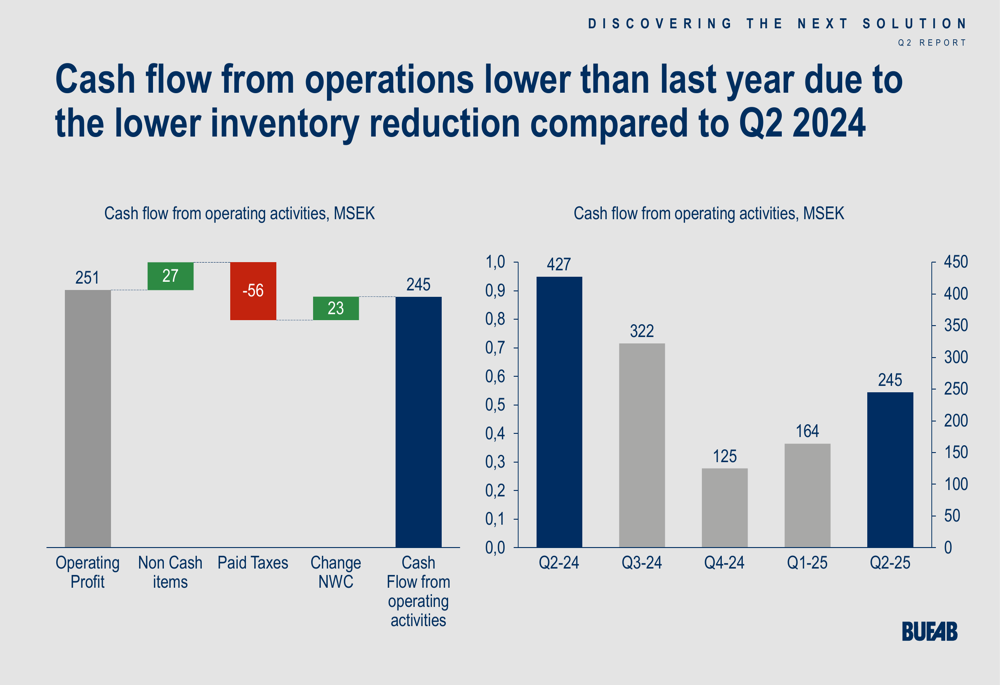
Cash flow from operations reached 245 MSEK in Q2 2025, lower than the 427 MSEK reported in Q2 2024. This decrease was primarily due to a smaller inventory reduction compared to the previous year. The following waterfall chart breaks down the components of cash flow:
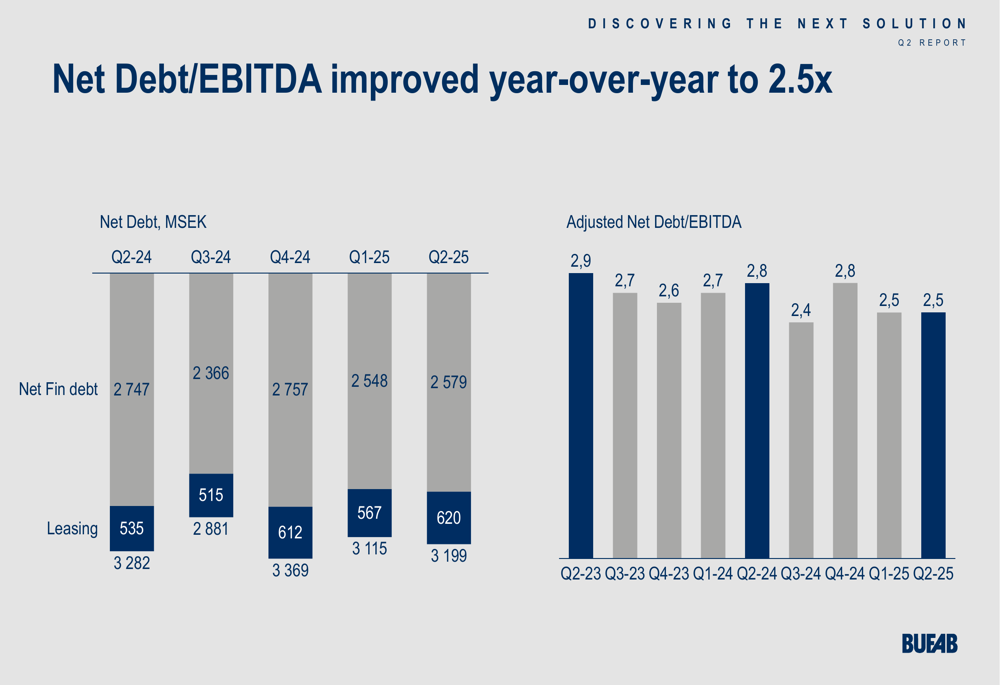
Bufab’s Net Debt/EBITDA ratio improved year-over-year to 2.5x, consistent with the level reported in Q1 2025. This stability in the debt ratio indicates the company’s continued focus on maintaining financial discipline despite challenging market conditions.
Forward-Looking Statements
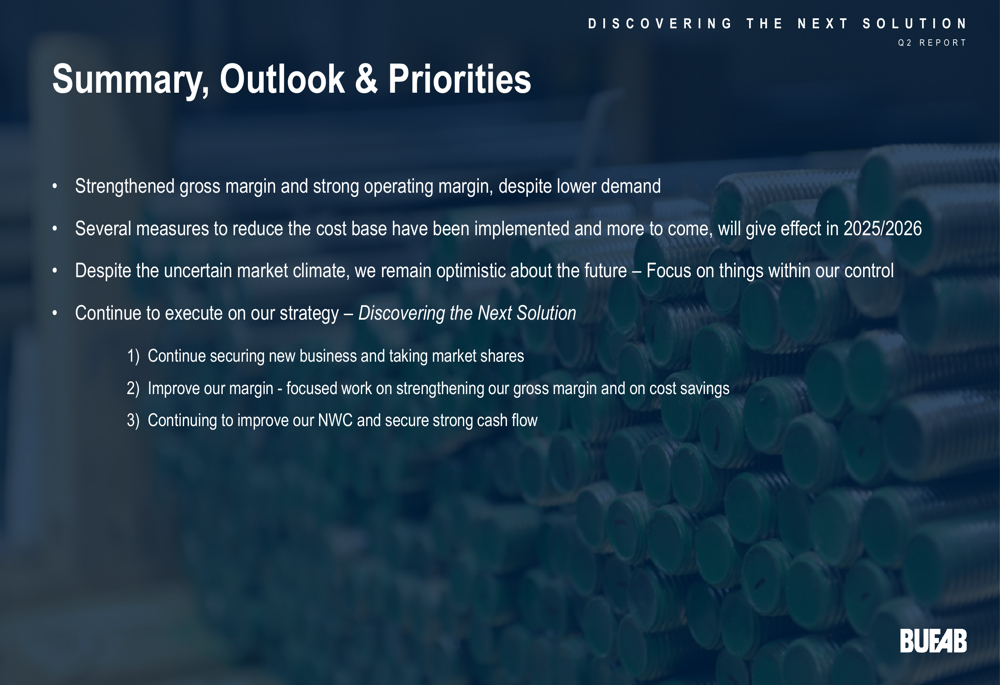
Looking ahead, Bufab remains optimistic despite the uncertain market climate. The company plans to continue executing its "Discovering the Next (LON:NXT) Solution" strategy, focusing on three key priorities:
1. Securing new business and taking market share
2. Improving margins through strengthening gross margin and cost savings
3. Improving net working capital and securing strong cash flow
The company highlighted that several measures to reduce the cost base have been implemented, with more to come, which are expected to show effects in 2025/2026.
Bufab also emphasized its sustainability credentials, noting that 96% of the products it sells are recyclable and 76% of its operational energy is renewable, with 5% generated on-site. These sustainability initiatives are increasingly important to customers, with the company highlighting customer Griesser’s focus on sustainability as an example.
Comparing Q2 2025 results with Q1 2025, Bufab has maintained its trajectory of margin improvement, with gross margin increasing from 30.3% to 31.1% and operating margin improving from 12.7% to 13.1%. However, the revenue trend has reversed from the 1.6% growth reported in Q1 to a 4.8% decline in Q2, indicating increasing market challenges that the company will need to navigate in coming quarters.
Full presentation:
This article was generated with the support of AI and reviewed by an editor. For more information see our T&C.