These are top 10 stocks traded on the Robinhood UK platform in July

Introduction & Market Context
Cadence Bank (NASDAQ:CADE) released its first quarter 2025 earnings presentation on April 21, showcasing improved profitability metrics driven by net interest margin expansion and disciplined expense management. The bank reported net income available to common shareholders of $130.9 million, or $0.70 per diluted share, with adjusted earnings of $131.4 million, or $0.71 per share. Following the release, Cadence shares traded slightly higher in premarket activity, up 0.11% to $27.62.
The results come as Cadence prepares to complete its merger with FCB Financial Corp, which received both regulatory and shareholder approvals and is expected to close on May 1, 2025. This strategic move follows the bank’s solid performance in the previous quarter, when it exceeded analyst expectations with an EPS of $0.70 against forecasts of $0.69.
Quarterly Performance Highlights
Cadence Bank’s Q1 2025 results reflect continued improvement in key performance metrics. The bank achieved quarterly adjusted pre-tax pre-provision net revenue (PPNR) of $189.9 million and improved its return on average assets to 1.15%. The adjusted efficiency ratio improved by 151 basis points compared to the previous quarter, reaching 57.6%.
As shown in the following financial highlights slide, the bank delivered solid net income while improving operational efficiency:
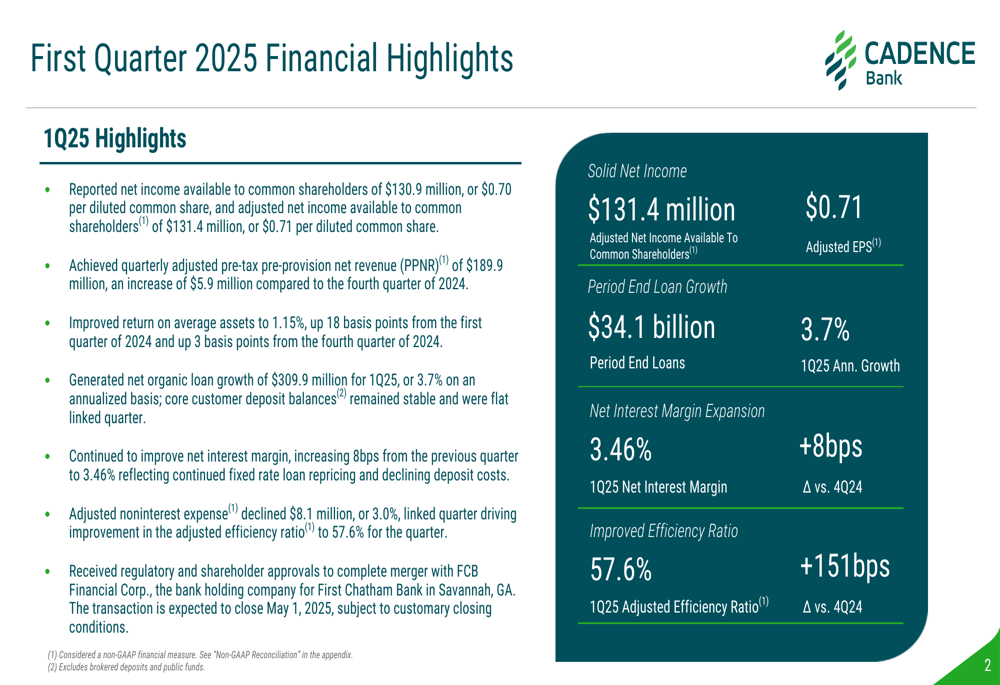
Expense management was a notable bright spot, with adjusted noninterest expense declining by $8.1 million, or 3.0%, compared to the linked quarter. This disciplined approach to expenses, combined with revenue growth, contributed to the improved efficiency ratio.
Loan and Deposit Trends
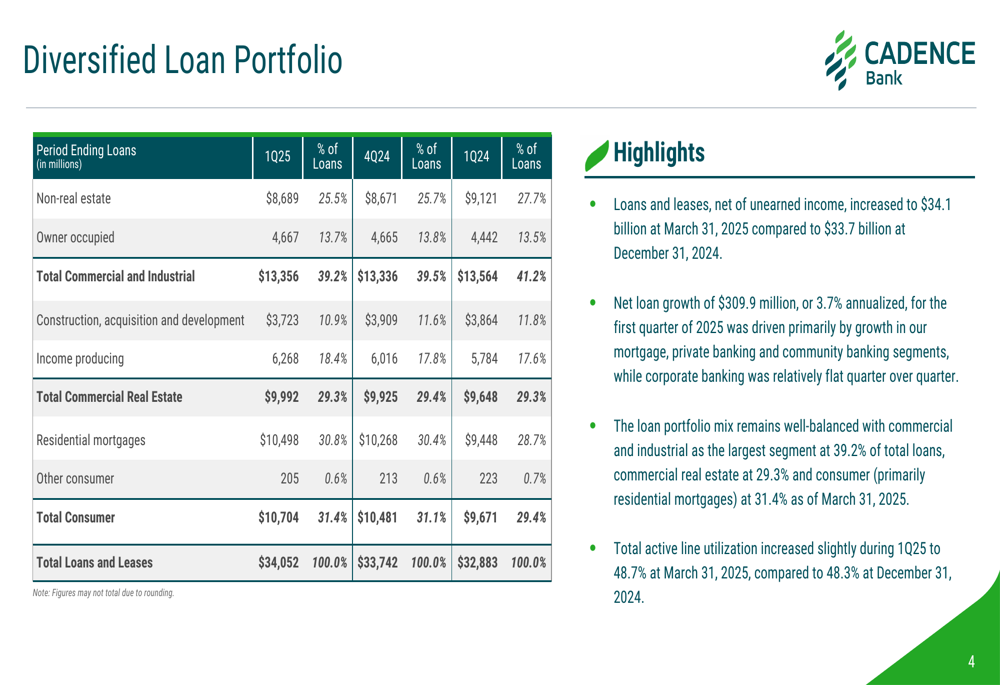
Cadence generated net organic loan growth of $309.9 million during the first quarter, representing an annualized growth rate of 3.7%. Total (EPA:TTEF) loans reached $34.1 billion at quarter-end, with the portfolio maintaining a well-balanced mix across commercial, real estate, and consumer segments.
The following slide illustrates the diversification of Cadence’s loan portfolio, which helps mitigate concentration risks:
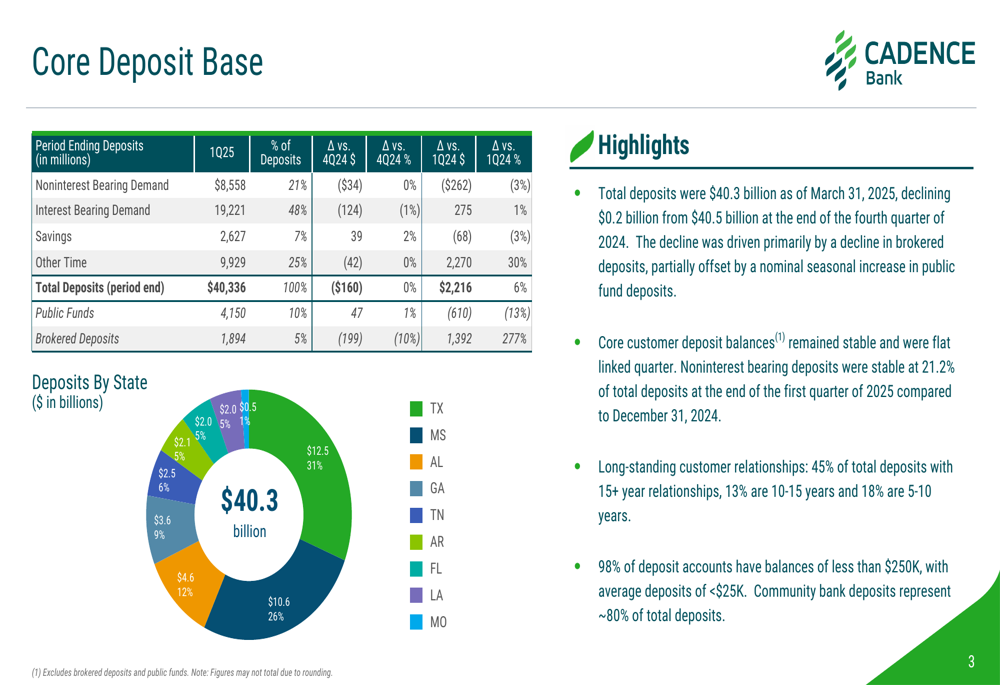
On the deposit side, Cadence reported total deposits of $40.3 billion as of March 31, 2025, a slight decline of $0.2 billion from the previous quarter. The bank’s deposit base benefits from long-standing customer relationships, with 45% of total deposits coming from relationships of 15 years or more. Additionally, 98% of deposit accounts have balances under $250,000, with average deposits below $25,000, indicating a stable and granular funding base.
The following slide provides a detailed breakdown of the bank’s core deposit composition:
Net Interest Margin and Revenue
A key driver of Cadence’s improved performance was the expansion of its net interest margin (NIM), which increased by 8 basis points from the previous quarter to 3.46%. This improvement reflects the bank’s success in managing funding costs while maintaining loan yields.
The following chart illustrates the positive trend in Cadence’s net interest margin over the past five quarters:
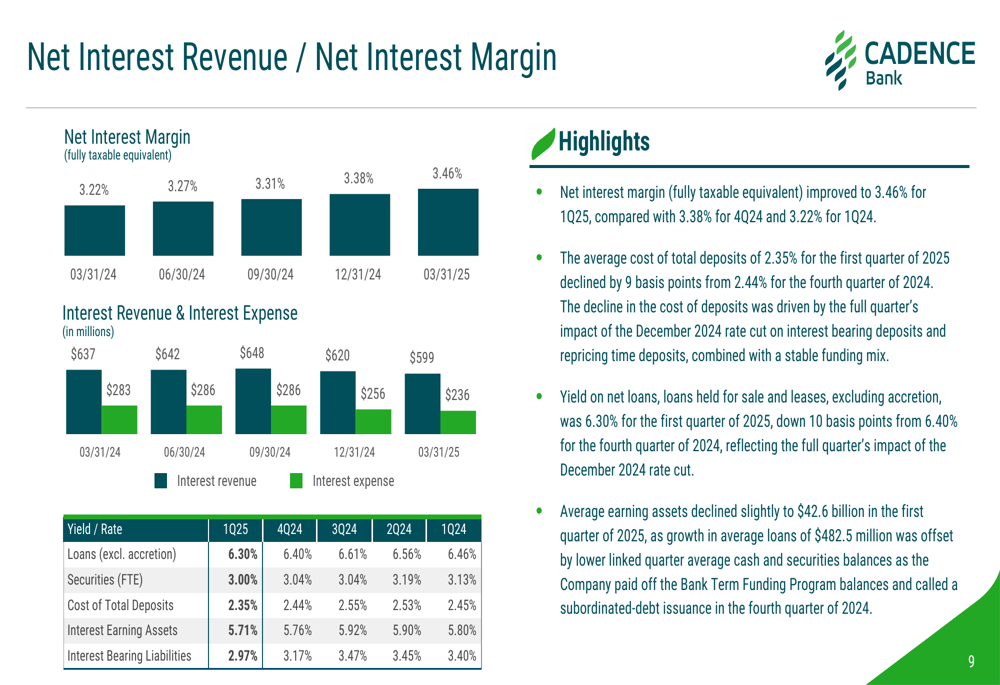
The average cost of total deposits decreased to 2.35% for the first quarter of 2025, down 9 basis points from the previous quarter. Meanwhile, the yield on net loans, excluding accretion, was 6.30%, down 10 basis points but still maintaining a healthy spread over funding costs.
This margin expansion aligns with trends observed in the previous quarter, when the bank reported a NIM of 3.31%, up 4 basis points. Management had expressed confidence in continued margin improvement during the Q4 2024 earnings call, a prediction that materialized in Q1 2025.
Credit Quality and Capital Position
Cadence maintained solid credit quality metrics in the first quarter. Net charge-offs totaled $23.0 million, while the provision for credit losses was $20.0 million. The allowance for credit losses stood at 1.34% of net loans and leases at quarter-end.
The following slide provides a comprehensive overview of the bank’s credit quality metrics:
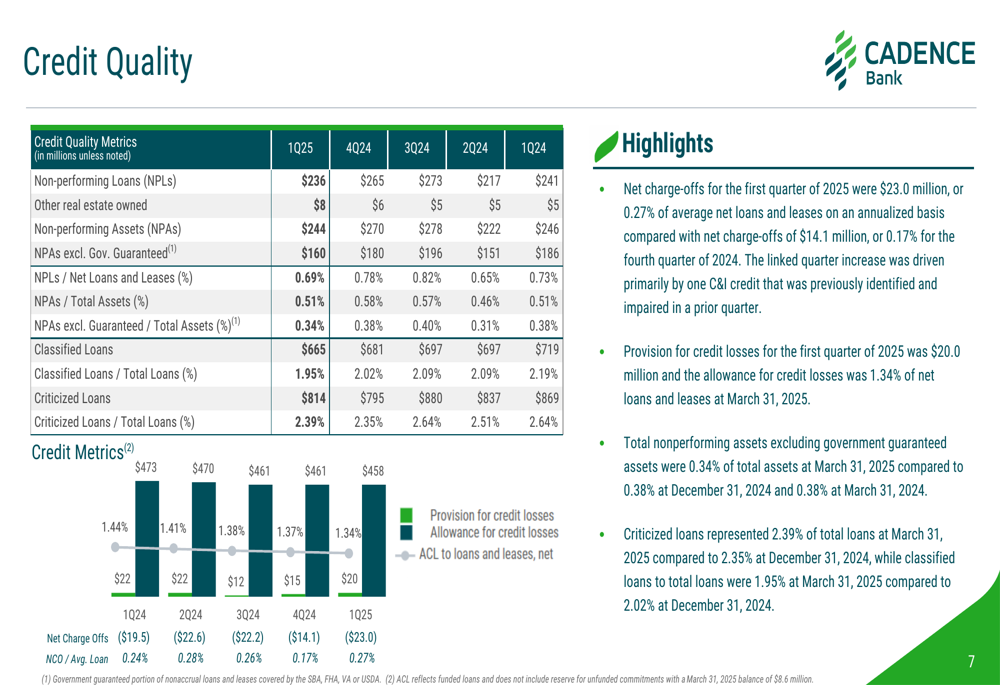
Total nonperforming assets excluding government guaranteed assets were 0.34% of total assets, while criticized loans represented 2.39% of total loans, compared to 2.35% at December 31, 2024.
From a capital perspective, Cadence reported strong regulatory ratios, with Common Equity Tier 1 capital of 12.4%, Tier 1 capital of 12.9%, and total risk-based capital of 14.1%. The bank’s tangible book value per common share increased to $22.30, and the quarterly cash dividend was raised from $0.25 to $0.275 per common share.
Strategic Initiatives and Outlook
The most significant strategic development for Cadence is the upcoming merger with FCB Financial Corp, which has received all necessary regulatory and shareholder approvals and is expected to close on May 1, 2025. This transaction represents an important expansion opportunity for the bank.
Looking ahead, Cadence provided the following financial expectations for 2025:
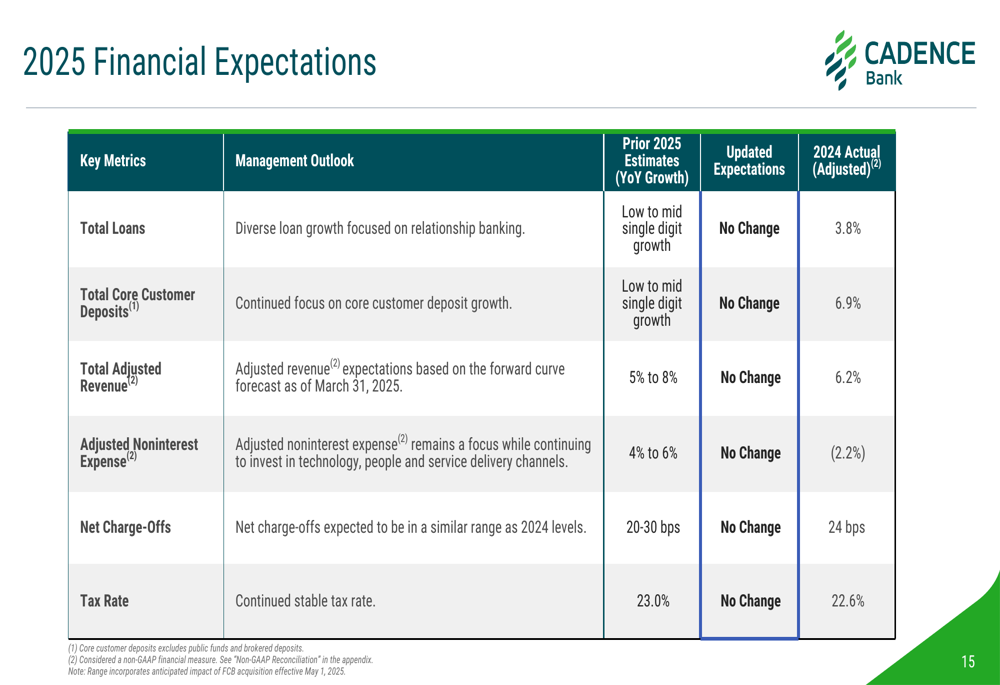
The bank anticipates low to mid-single-digit growth in both loans and core customer deposits, with total adjusted revenue expected to increase by 5% to 8%. Management expects adjusted noninterest expense to grow in line with inflation, while net charge-offs are projected to remain within the range of 15 to 25 basis points.
These projections align with comments made during the previous quarter’s earnings call, where management expressed optimism about continued improvement in net interest margins and highlighted the company’s focus on market expansion.
Commercial Portfolio Composition
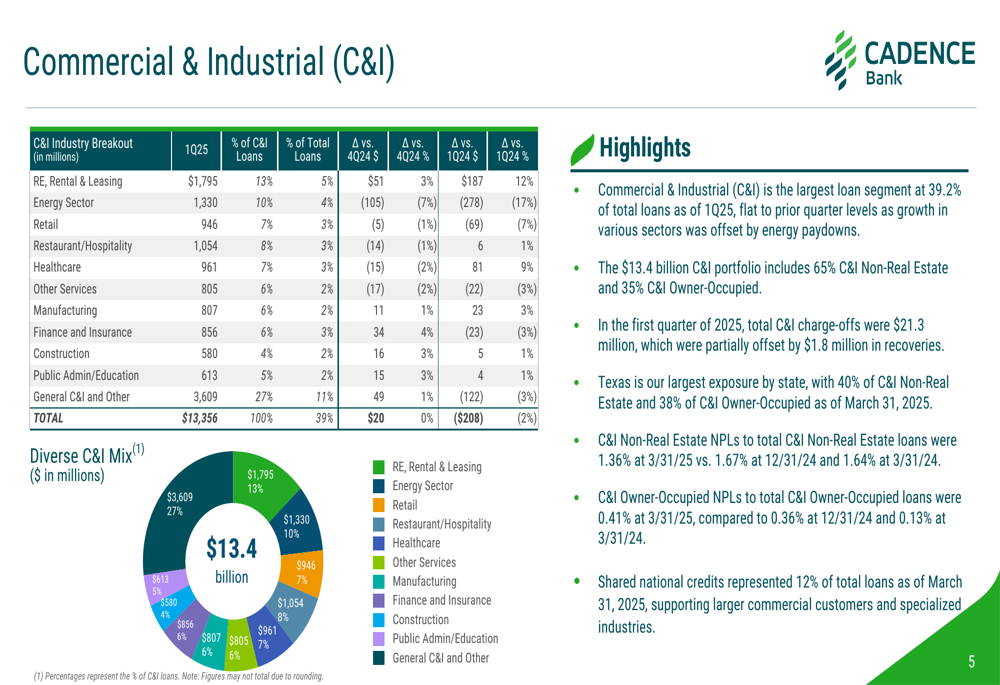
As Commercial & Industrial (C&I) loans represent the largest segment of Cadence’s loan portfolio at 39.2% of total loans, understanding this exposure is critical for investors. The bank’s $13.4 billion C&I portfolio includes 65% C&I Non-Real Estate and 35% C&I Owner-Occupied loans.
The following slide provides a detailed breakdown of the C&I portfolio by industry:
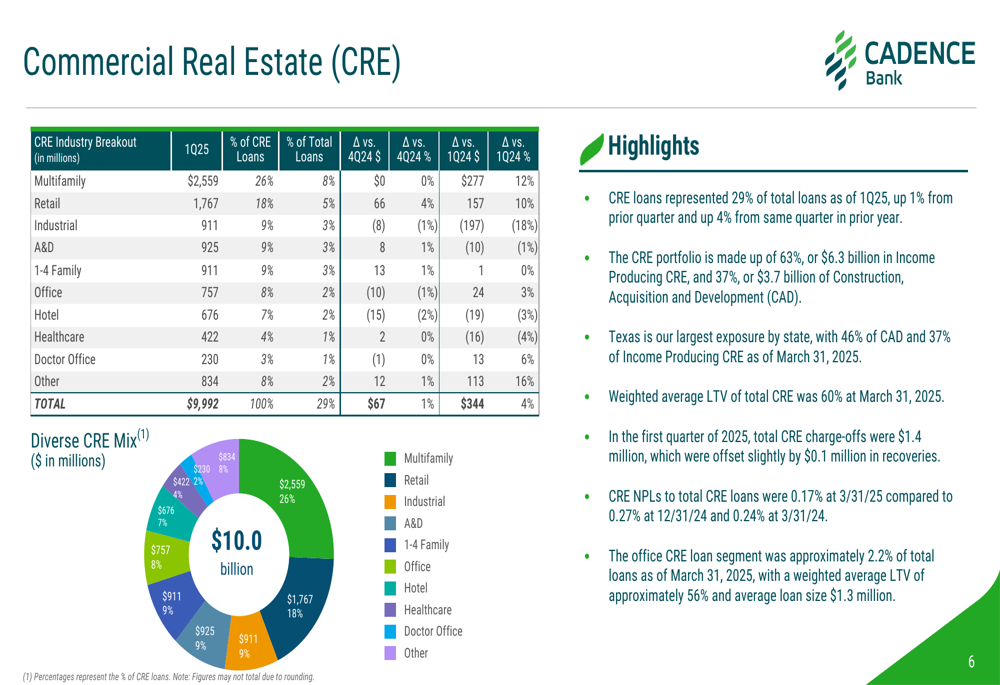
Similarly, Commercial Real Estate (CRE) loans represent 29% of total loans, with a weighted average loan-to-value ratio of 60%, indicating conservative underwriting standards. The CRE portfolio is diversified across property types, with limited exposure to office properties at approximately 2.2% of total loans.
The following slide illustrates the composition of the CRE portfolio:
Cadence’s diversified commercial loan portfolio and conservative underwriting approach position the bank well to navigate potential economic challenges while supporting continued growth in its core markets.
Full presentation:
This article was generated with the support of AI and reviewed by an editor. For more information see our T&C.