5 big analyst AI moves: Nvidia guidance warning; Snowflake, Palo Alto upgraded

Capital Bancorp, Inc. (NASDAQ:CBNK) delivered impressive year-over-year growth across key metrics in the second quarter of 2025, according to the company’s investor presentation. The regional bank reported substantial expansion in assets, loans, and deposits, while showcasing a significant transformation in its business model with Windsor Advantage emerging as the dominant contributor to net income.
Quarterly Performance Highlights
Capital Bancorp reported total assets of $3.39 billion as of June 30, 2025, representing a remarkable 39.0% increase from the same period last year. Portfolio loans grew 35.5% year-over-year to $2.74 billion, while deposits increased 40.0% to $2.94 billion.
The company’s earnings performance was equally strong, with diluted earnings per share of $0.78, up 32.2% from Q2 2024. Core earnings per share, which excludes merger-related expenses, reached $0.85, representing a 44.1% year-over-year increase.
As shown in the following comprehensive financial highlights chart:
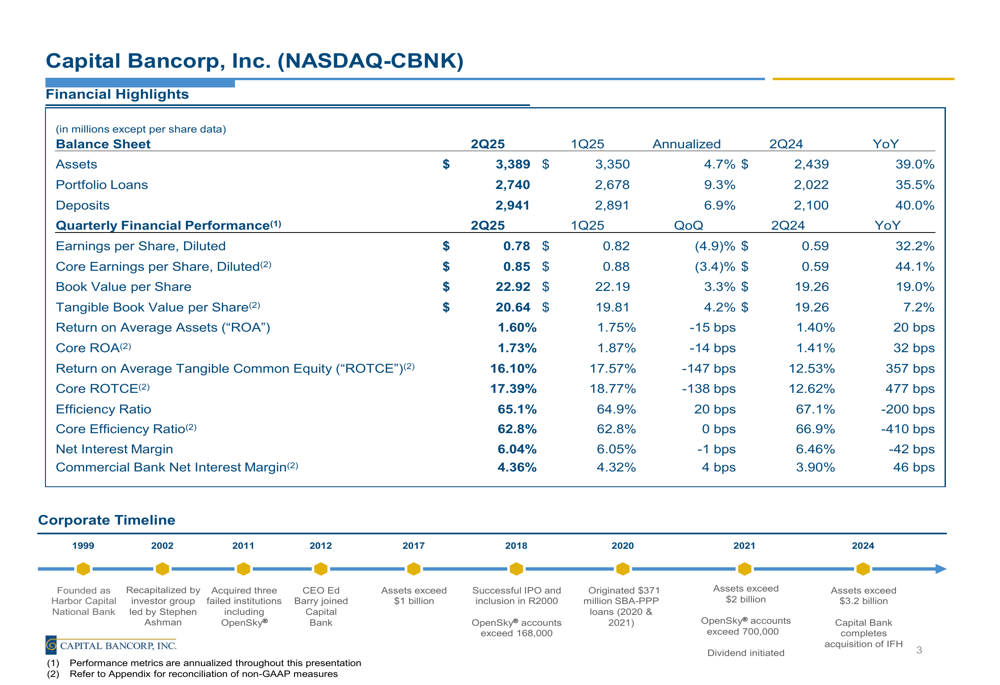
Profitability metrics also showed significant improvement, with return on average assets (ROA) reaching 1.60%, up 20 basis points year-over-year, while core ROA increased to 1.73%. Return on average tangible common equity (ROTCE) climbed to 16.10%, a substantial 357 basis point improvement from the prior year.
The efficiency ratio, which measures overhead costs as a percentage of revenue (lower is better), improved to 65.1% from 67.1% a year earlier, indicating enhanced operational efficiency.
Business Model Transformation
Perhaps the most striking development revealed in the presentation is the dramatic shift in Capital Bancorp’s income contribution sources. The company’s diversified business model now spans Commercial Banking, Government Guaranty Lending (GGL), Capital Bank Home Loans, OpenSky™ credit card operations, and Windsor Advantage.
As illustrated in the following business segment breakdown:
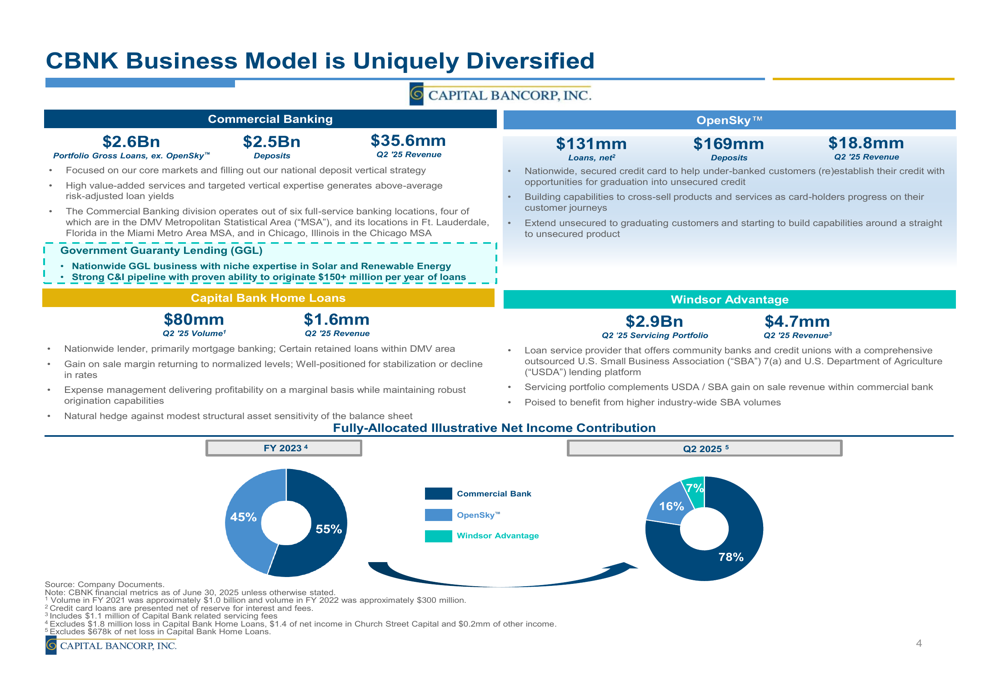
Windsor Advantage has emerged as the dominant contributor to net income, representing 78% of Q2 2025 income compared to virtually none in FY 2023. This transformation reflects Capital Bancorp’s strategic diversification beyond traditional banking. Meanwhile, Commercial Banking’s contribution decreased to 7% from 55% in FY 2023, while OpenSky™ declined to 16% from 45%.
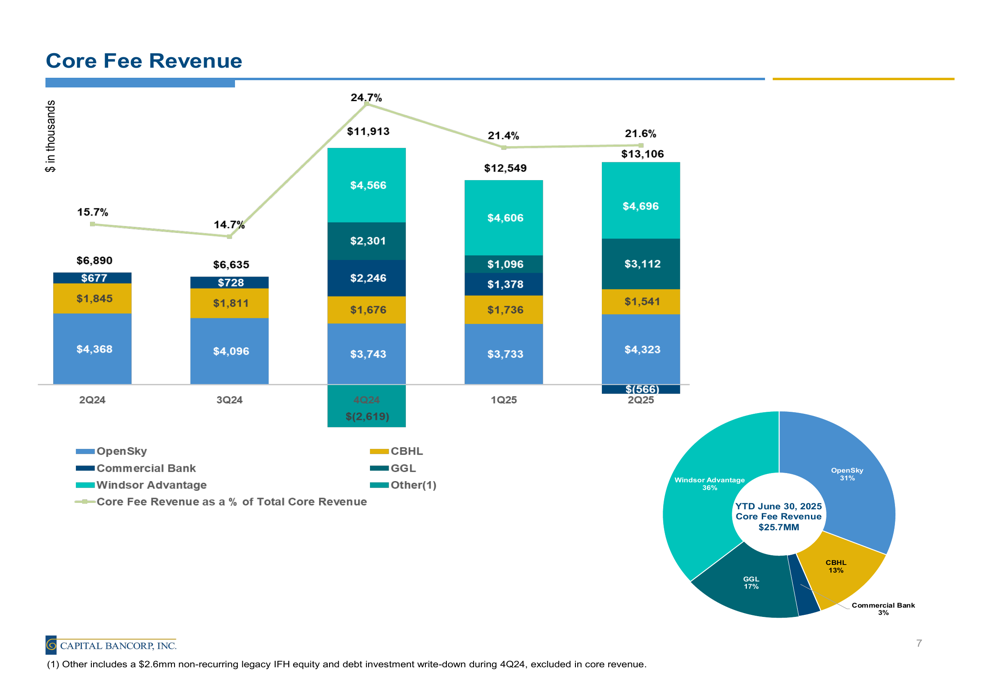
The company’s fee revenue streams have also diversified significantly. Core fee revenue reached $13.1 million in Q2 2025, with Windsor Advantage accounting for 36% of year-to-date fee revenue, followed by OpenSky at 31%.
The following chart illustrates this fee revenue diversification:
Balance Sheet Strength and Composition
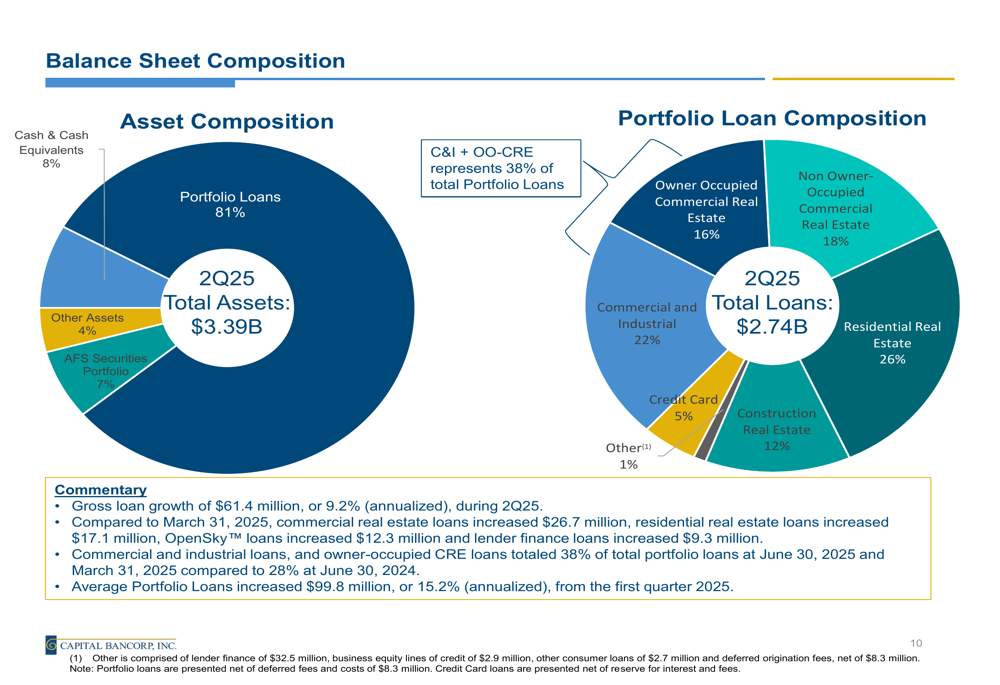
Capital Bancorp’s loan portfolio shows healthy diversification across various sectors. Residential real estate comprises 26% of the portfolio, followed by commercial and industrial loans at 22%, non-owner-occupied commercial real estate at 18%, and owner-occupied commercial real estate at 16%.
The company highlighted that commercial and industrial loans combined with owner-occupied CRE now represent 38% of total portfolio loans, up from 28% a year earlier, indicating a strategic shift toward these segments.
As shown in the balance sheet composition chart:
On the funding side, the deposit base remains well-diversified with noninterest-bearing deposits accounting for 29% of the total, while money markets represent 33%, and various time deposits make up 27%. Transaction accounts (noninterest-bearing and interest-bearing demand) constitute 39% of overall deposit funding.
The deposit composition is illustrated in the following chart:
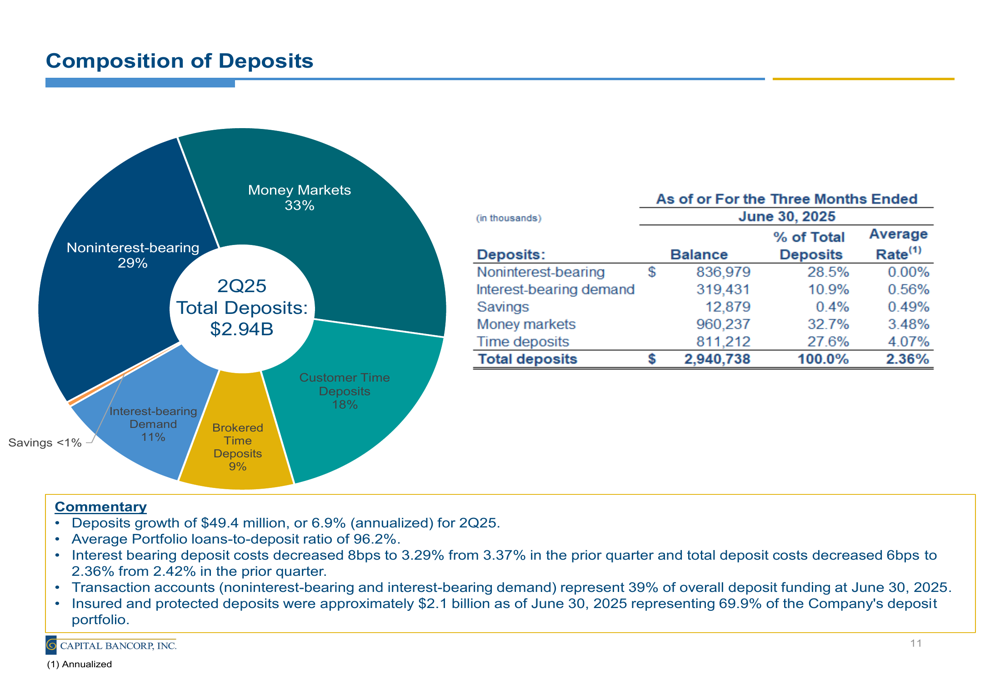
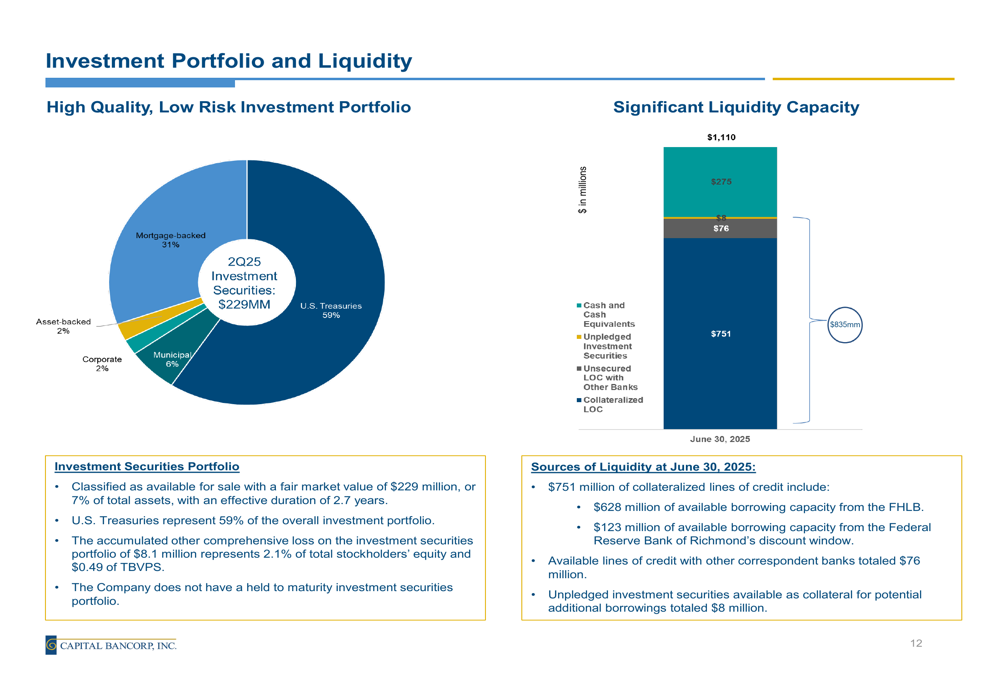
Capital Bancorp maintains a strong liquidity position with $1.11 billion in available sources, including $751 million in cash and cash equivalents and $835 million in total available borrowing capacity. The company reported that approximately 69.9% of its deposit portfolio was insured or protected as of June 30, 2025.
The investment portfolio, representing 7% of total assets, is primarily composed of U.S. Treasuries (59%) and mortgage-backed securities (31%), with an effective duration of 2.7 years.
As shown in the liquidity position chart:
Profitability and Credit Quality
Capital Bancorp’s net interest margin (NIM) stood at 6.04% in Q2 2025, down 42 basis points year-over-year but relatively stable compared to the previous quarter. However, the Commercial Bank NIM improved to 4.36%, up 46 basis points from Q2 2024.
The company’s loan yield was 8.10% in Q2 2025, while the cost of interest-bearing deposits was 3.29%, down 8 basis points from the previous quarter. The total cost of deposits decreased 6 basis points quarter-over-quarter to 2.36%.
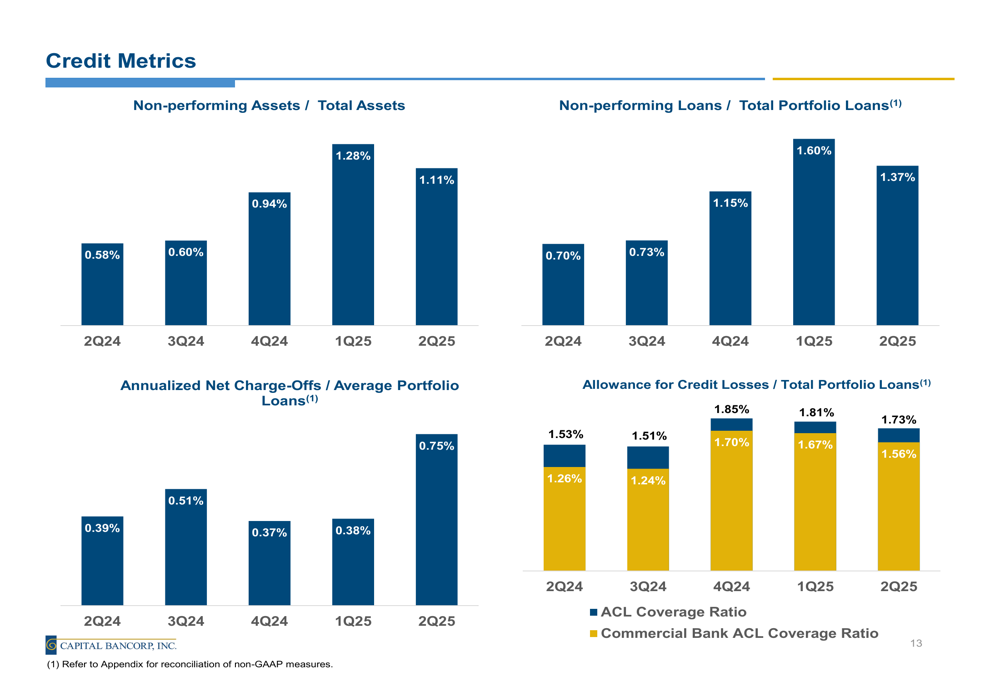
Credit quality metrics remain manageable, with non-performing assets to total assets at 1.11% and non-performing loans to total portfolio loans at 1.37% in Q2 2025. The allowance for credit losses to total portfolio loans ratio stood at 1.73%, providing adequate coverage for potential loan losses.
The following chart details these credit metrics:
Capital Position and Market Performance
Capital Bancorp maintains robust capital ratios, with the Bank Tier-1 Risk Based ratio at 11.87% and Total Risk Based ratio at 13.13% as of Q2 2025. The Tangible Common Equity ratio stood at 8.84%, reflecting a strong capital position.
Book value per share increased 19.0% year-over-year to $22.92, while tangible book value per share grew 7.2% to $20.64. According to the presentation, Capital Bancorp’s share price has significantly outperformed industry benchmarks since its IPO in September 2018, with tangible book value plus dividend growth exceeding peer medians by 170%.
Overall, Capital Bancorp’s Q2 2025 presentation depicts a financial institution undergoing significant transformation while delivering strong financial results. The diversification of its business model, particularly the growing contribution from Windsor Advantage, appears to be reshaping the company’s revenue and income profile while maintaining solid growth in traditional banking metrics.
Full presentation:
This article was generated with the support of AI and reviewed by an editor. For more information see our T&C.