How are energy investors positioned?

Introduction & Market Context
Carpenter Technology Corporation (NYSE:CRS) presented its third-quarter fiscal year 2025 results on April 24, 2025, highlighting substantial growth driven primarily by its aerospace and defense segment. The specialty alloys producer reported an adjusted operating income of $138 million, representing a 53% increase compared to the same period last year.
The company’s stock has shown remarkable momentum, with a 138% return over the past year according to available market data. Following the earnings announcement, shares traded up 0.95% to $192.54, continuing to perform within its 52-week range of $79.14 to $213.66.
Quarterly Performance Highlights
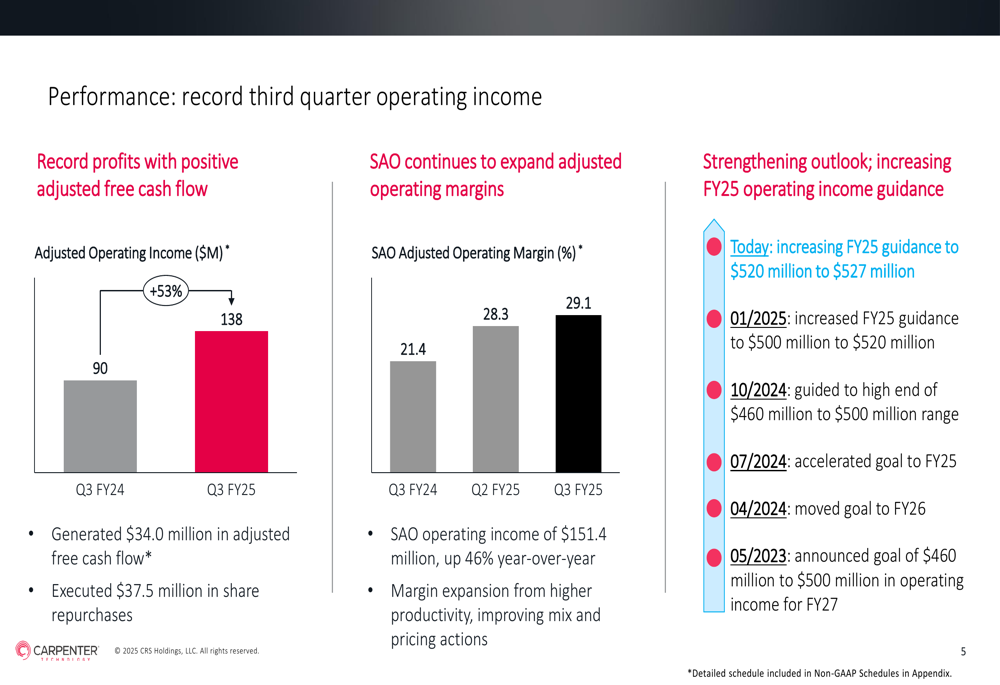
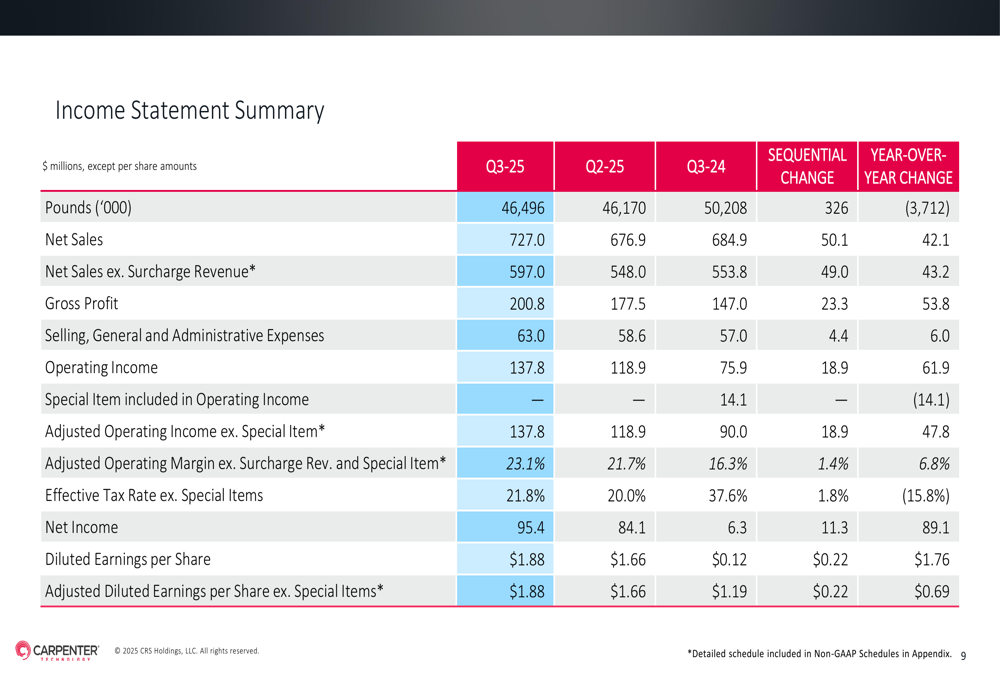
Carpenter Technology delivered strong financial results for Q3 FY2025, with net sales reaching $727 million, up from $684.9 million in the prior year period. The company’s adjusted operating income of $138 million marked a significant improvement from $90 million in Q3 FY2024, demonstrating the company’s ability to expand margins while growing revenue.
As shown in the following financial performance highlights:
Diluted earnings per share reached $1.88, a substantial increase from $0.12 in the same quarter last year. On an adjusted basis excluding special items, EPS was also $1.88, compared to $1.19 in Q3 FY2024. This performance exceeded analyst expectations of $1.73 per share, though revenue slightly missed the forecasted $729.67 million.
The company’s comprehensive income statement reveals improvements across multiple metrics:
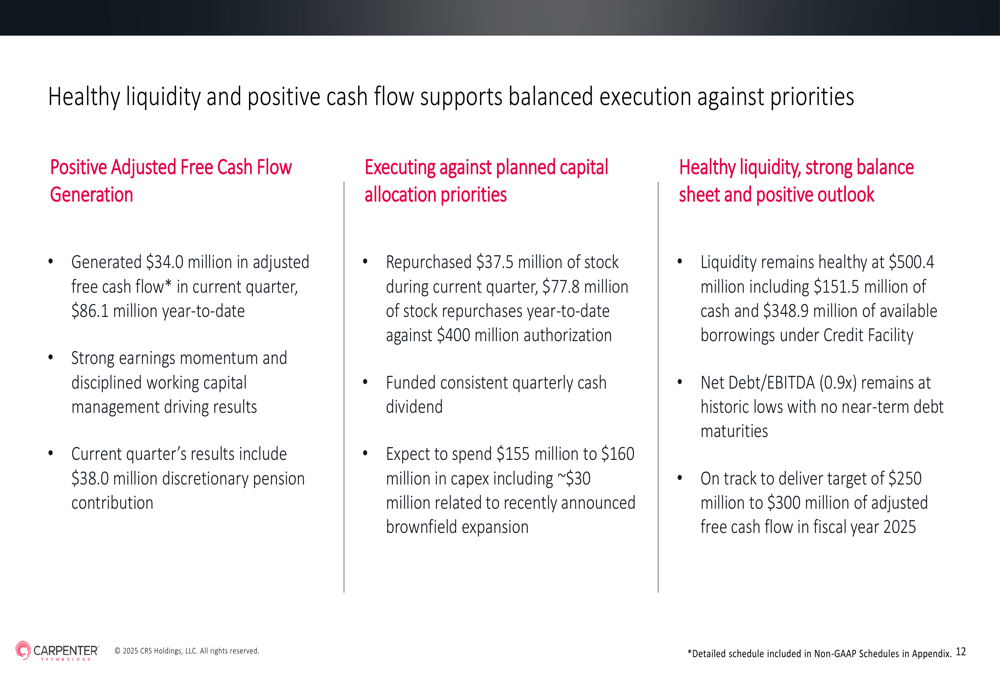
Carpenter Technology generated $34 million in adjusted free cash flow during the quarter and executed $37.5 million in share repurchases, demonstrating its commitment to returning value to shareholders while maintaining financial flexibility.
Segment Analysis
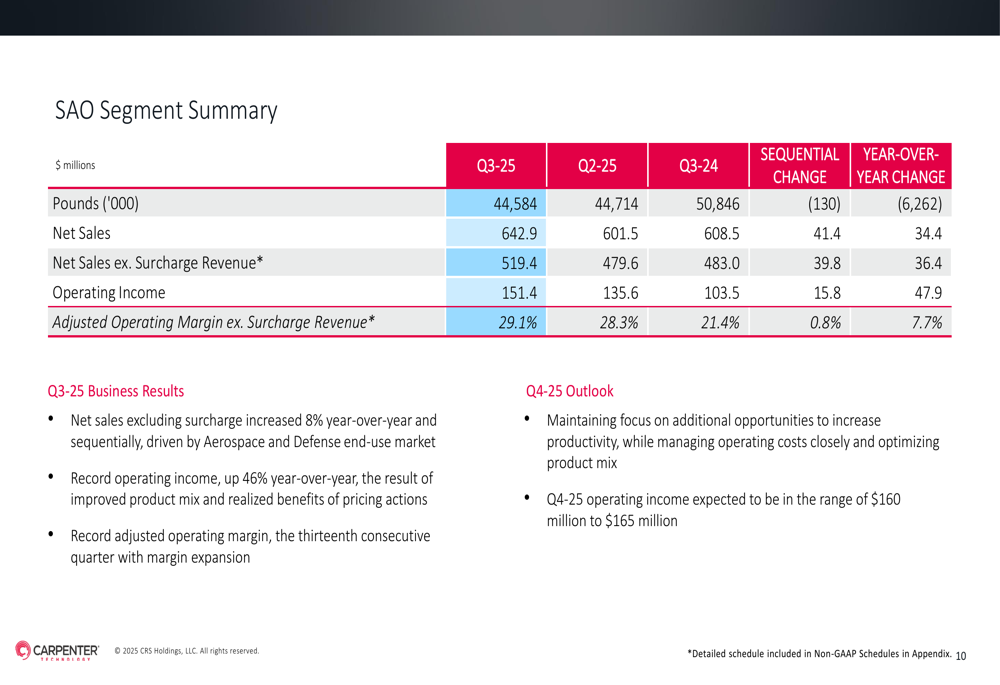
The company’s performance was driven primarily by its Specialty Alloys Operations (SAO) segment, which achieved a record adjusted operating margin of 29.1%, up from 21.4% in the same period last year. This segment, which represents the bulk of Carpenter’s business, posted operating income of $151.4 million on net sales of $642.9 million.
The SAO segment’s impressive performance is illustrated in the following summary:
Meanwhile, the Performance Engineered Products (PEP) segment also showed improvement, with operating income of $10.9 million and an adjusted operating margin of 11.3%, up from 9.7% in Q3 FY2024. The segment benefited from increased titanium sales in the aerospace and defense sector.
Carpenter’s revenue breakdown by market segment reveals the company’s heavy reliance on aerospace and defense, which accounted for 63% of net sales excluding surcharge and grew 18% year-over-year:
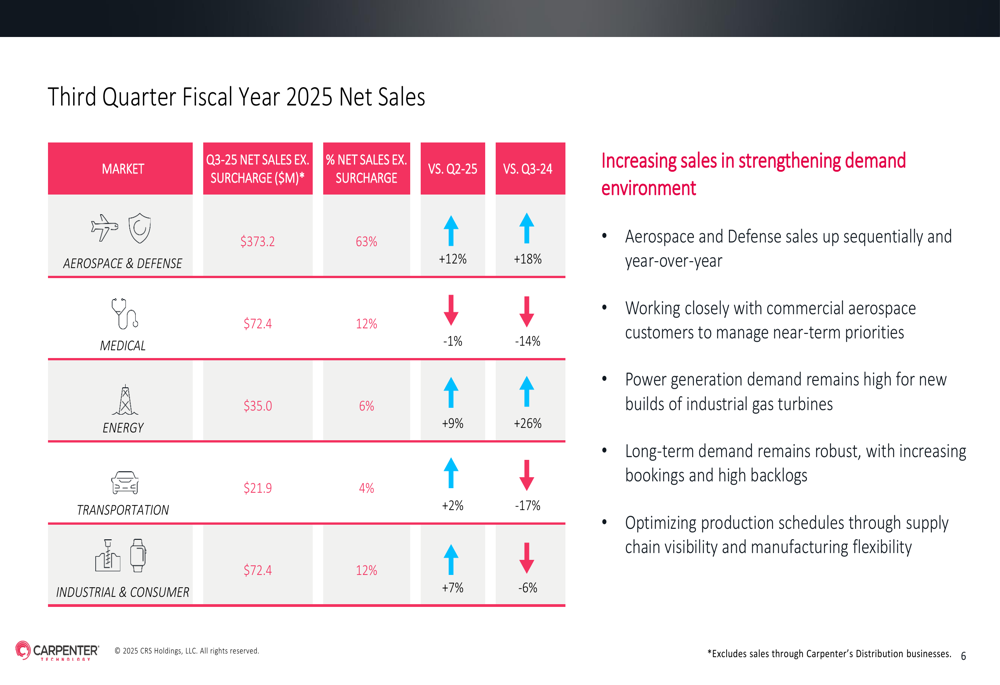
The medical segment, representing 12% of sales, experienced a 14% year-over-year decline, while energy (6% of sales) showed strong growth of 26% compared to Q3 FY2024. Transportation markets declined 17%, while industrial and consumer applications grew 7% year-over-year.
Strategic Initiatives and Market Positioning
Carpenter Technology emphasized its strategic positioning to navigate potential supply chain challenges, including recent tariff concerns. The company noted that increased costs due to tariffs would be passed through to customers via surcharge mechanisms, limiting the financial impact on its operations.
Management highlighted the company’s global multi-sourced supply chain and manufacturing flexibility as key advantages in addressing near-term customer priorities. The company’s broad portfolio of specialized alloys supports various aerospace platforms, providing resilience against platform-specific disruptions.
The company’s liquidity position remains strong, with total liquidity of $500.4 million and a net debt to EBITDA ratio of 0.9x:
Forward-Looking Statements and Guidance
Carpenter Technology raised its fiscal year 2025 guidance for adjusted operating income to $520-$527 million, reflecting confidence in continued strong performance. For Q4 FY2025, the company anticipates operating income in the range of $146-$153 million.
Looking further ahead, management projected an attractive earnings growth trajectory with approximately 25% compound annual growth rate (CAGR) over the next two years. By fiscal year 2027, the company targets adjusted operating income of $765-$800 million, with continued margin expansion driven by volume, mix, and pricing improvements.
As illustrated in the earnings growth outlook:
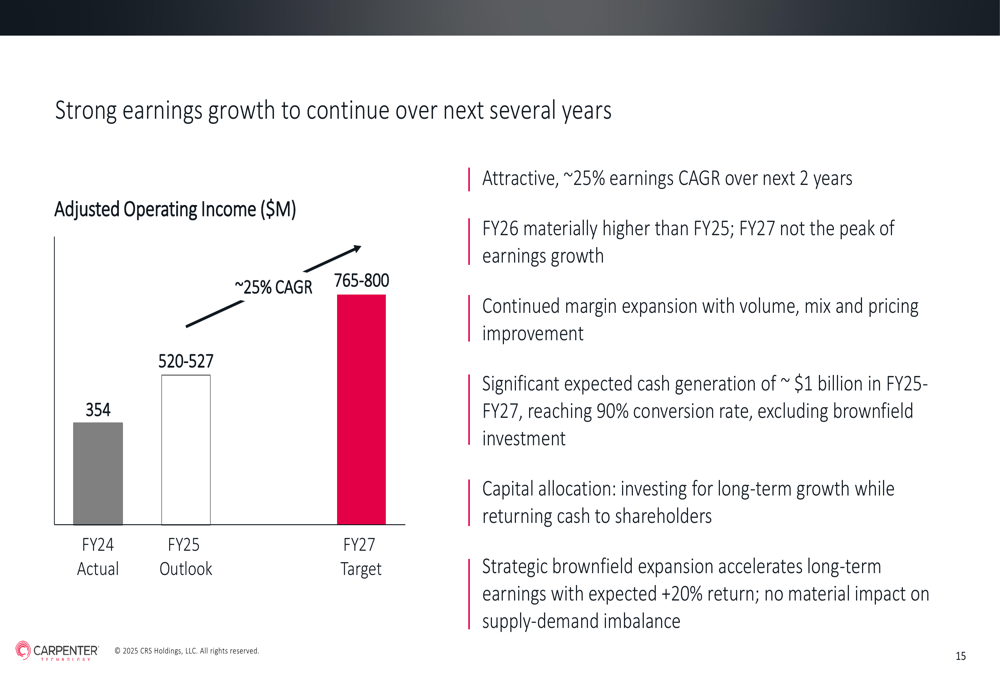
The company expects to generate approximately $1 billion in free cash flow from FY2025 through FY2027, reaching a 90% conversion rate excluding brownfield investment. This strong cash generation will support both long-term growth investments and shareholder returns.
Tony Thene, President and CEO, expressed optimism about the company’s trajectory, stating, "We continue to believe we are in the early stages of our growth journey," according to the earnings article. He emphasized the company’s advantage in serving customers across multiple applications and platforms.
With its strong positioning in high-growth markets, particularly aerospace and defense, and its focus on specialized high-performance alloys, Carpenter Technology appears well-positioned to execute its ambitious growth strategy in the coming years.
Full presentation:
This article was generated with the support of AI and reviewed by an editor. For more information see our T&C.