These are top 10 stocks traded on the Robinhood UK platform in July

Introduction & Market Context
Carvana Co (NYSE:CVNA) released its Q2 2025 supplemental financial tables on July 30, showcasing another quarter of strong growth and operational improvements. The online used car retailer continues to gain market share in the fragmented automotive retail sector, where it currently holds approximately 1% of the market.
The company’s stock closed at $336.50 on July 30, down 0.86% for the day, but remains near its 52-week high of $364.00, reflecting investor confidence in Carvana’s growth trajectory. The stock has shown remarkable recovery from its 52-week low of $118.50, demonstrating the company’s successful execution of its business strategy.

Quarterly Performance Highlights
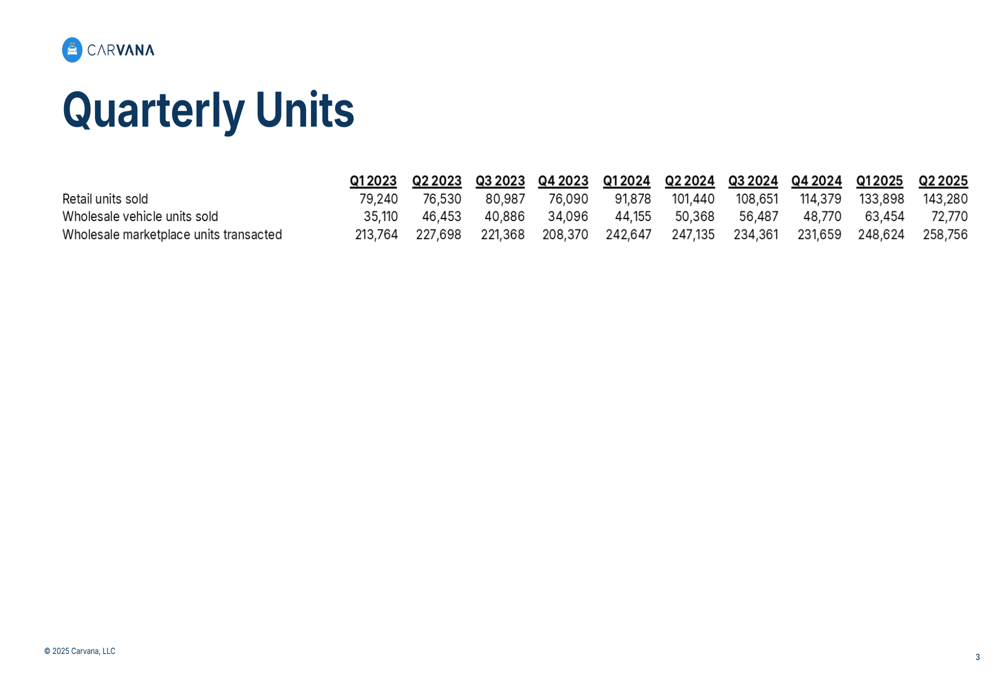
Carvana’s Q2 2025 results demonstrate significant year-over-year growth across key metrics. The company sold 143,280 retail units during the quarter, representing a 41% increase from the 101,440 units sold in Q2 2024. This continues the sequential growth trend from Q1 2025, when the company reported 133,898 retail units sold.
Wholesale operations also showed strong performance, with wholesale vehicle units sold increasing 44.5% year-over-year to 72,770 units, while wholesale marketplace units transacted grew to 258,756, a 4.7% improvement from Q2 2024.
As shown in the following quarterly units table, Carvana has maintained consistent growth across all sales channels:
Detailed Financial Analysis
Carvana’s financial metrics show improvements in both revenue generation and cost management. Total (EPA:TTEF) Gross Profit per Unit (GPU) on a GAAP basis increased to $7,426 in Q2 2025, up $377 (5.3%) from $7,049 in Q2 2024. On a non-GAAP basis, Total GPU rose to $7,580, a $236 (3.2%) improvement year-over-year.
The retail GPU improvement was driven primarily by lower reconditioning and inbound costs, with an additional approximately $100 benefit from tariff-related effects. Wholesale vehicle GPU increased by $75 to $558, benefiting from lower wholesale depreciation rates and higher wholesale units volume.
The following chart details the year-over-year changes in GPU components and the key drivers behind these changes:
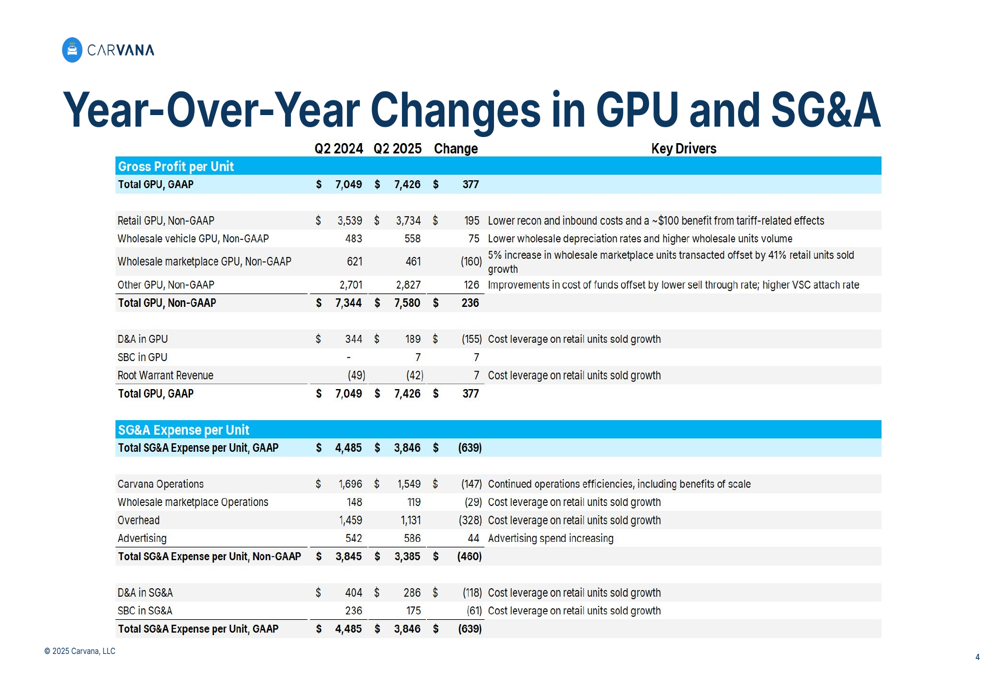
Equally impressive is Carvana’s progress in reducing Selling, General & Administrative (SG&A) expenses. Total SG&A Expense per Unit on a GAAP basis decreased to $3,846 in Q2 2025, down $639 (14.2%) from $4,485 in Q2 2024. On a non-GAAP basis, SG&A Expense per Unit fell to $3,385, a $460 (12%) reduction year-over-year.
The company achieved these cost improvements through continued operational efficiencies and benefits of scale. Overhead costs per unit saw the most significant reduction, declining by $328 (22.5%) to $1,131, primarily due to cost leverage on retail units sold growth. Carvana Operations costs per unit also decreased by $147 (8.7%) to $1,549.
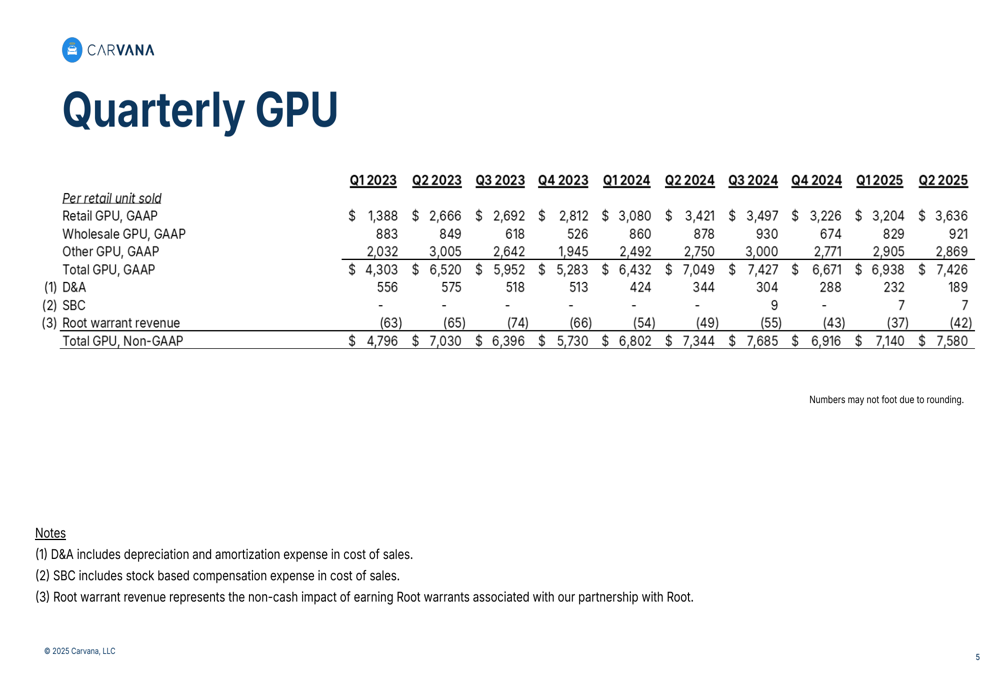
The quarterly GPU breakdown shows the consistent improvement trend across multiple quarters:
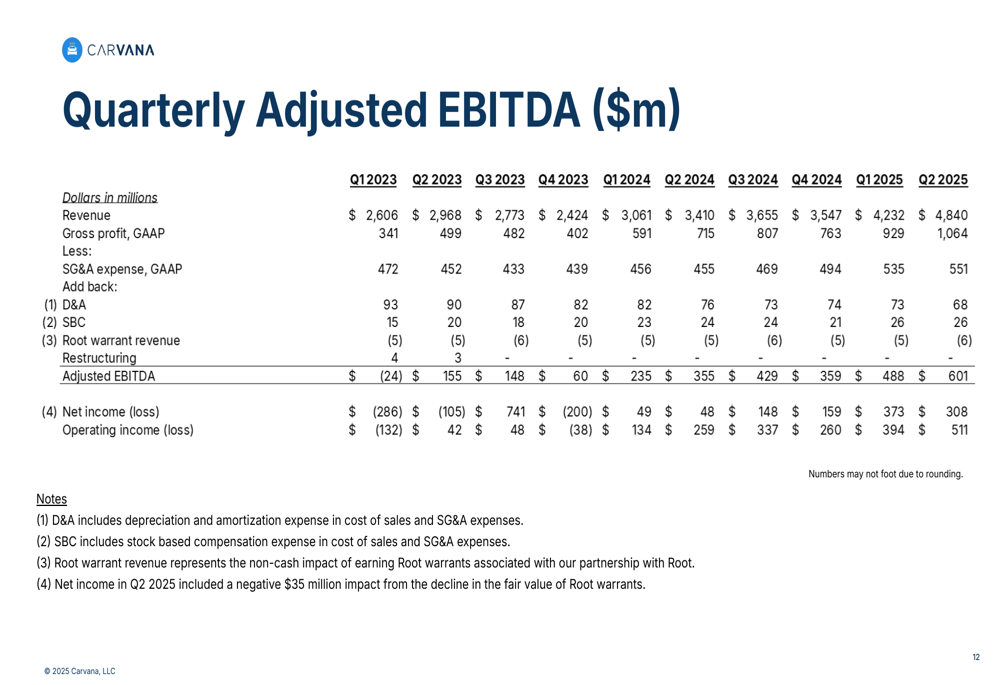
Carvana’s Adjusted EBITDA performance further demonstrates the company’s improving financial health. While the Q2 2025 presentation doesn’t explicitly state the Adjusted EBITDA figure for the quarter, the trend shown in previous quarters indicates continued strength in this metric. In Q1 2025, Carvana reported Adjusted EBITDA of $488 million, representing an 11.5% margin.
The following chart illustrates Carvana’s Adjusted EBITDA progression through recent quarters:
Strategic Initiatives & Forward-Looking Statements
While the Q2 2025 financial tables focus primarily on financial metrics rather than strategic initiatives, they provide insight into Carvana’s operational focus. The company is clearly investing in growth while maintaining cost discipline, as evidenced by the slight increase in advertising spend per unit (up $44 year-over-year to $586) alongside significant reductions in other expense categories.
Based on the company’s Q1 2025 earnings call, Carvana aims to expand its production capacity from 23 to 60 locations and is targeting 3 million annual retail sales within the next 5 to 10 years. The operational efficiencies demonstrated in the Q2 2025 presentation support this ambitious growth strategy.
The company faces potential challenges from supply chain issues, market saturation as it expands, and economic conditions that could affect consumer spending. However, the tariff-related benefit of approximately $100 per unit mentioned in the retail GPU analysis suggests Carvana has been able to navigate some of these challenges effectively.
Carvana’s continued execution on both growth and operational efficiency positions the company well to achieve its long-term goal of becoming the dominant platform for buying and selling cars. With five consecutive quarters of positive net income and improving unit economics, the company appears to be successfully balancing growth investments with profitability improvements.
Full presentation:
This article was generated with the support of AI and reviewed by an editor. For more information see our T&C.