Asahi shares mark weekly slide after cyberattack halts production

Introduction & Market Context
Cathay General Bancorp (NASDAQ:CATY) released its second quarter 2025 financial results on July 22, showing continued momentum with earnings per share of $1.10, a significant improvement from the $0.98 reported in the first quarter. The bank’s total revenue reached $196.6 million, up from $186.35 million in Q1, reflecting successful execution amid evolving economic conditions.
The stock closed at $48.09 on July 22, maintaining its position well above its 52-week low of $36.06, though still below its 52-week high of $55.29. Following a 1.38% rise after Q1 earnings, Cathay’s latest results demonstrate the bank’s resilience in navigating the current financial landscape.
Quarterly Performance Highlights
Cathay General Bancorp reported net income of $77.4 million for Q2 2025, with diluted earnings per share of $1.10. The bank achieved a return on assets (ROAA) of 1.33% and return on equity (ROAE) of 10.72%, while return on tangible equity reached 12.39%.
Pre-tax pre-provision income totaled $119 million, representing a ratio of 2.03%. The efficiency ratio improved to 45.34%, indicating effective cost management and operational efficiency.
As shown in the following financial highlights chart:
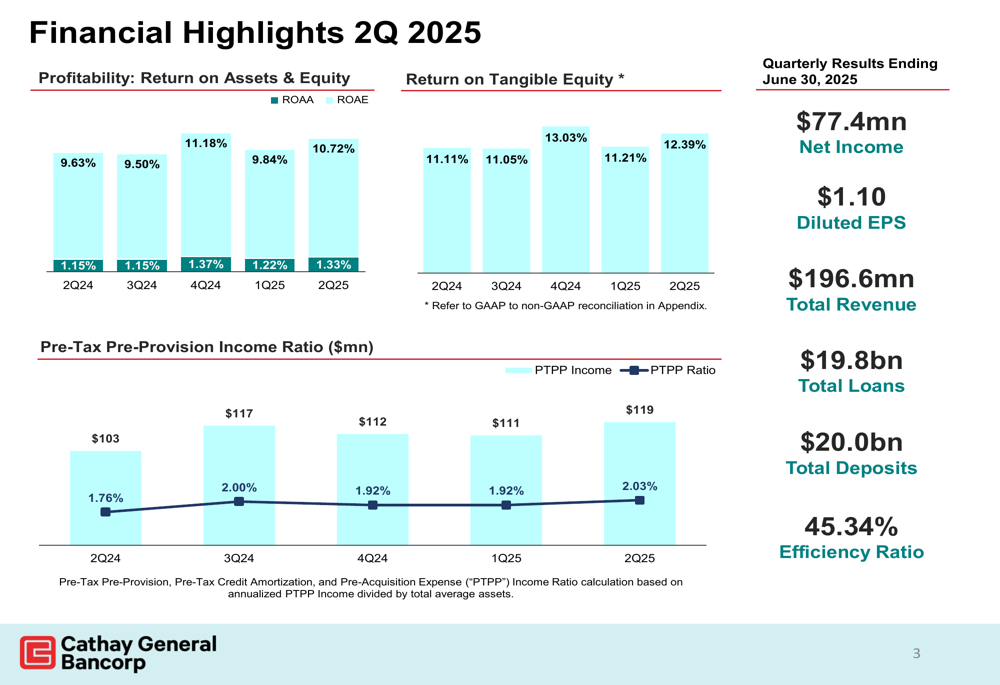
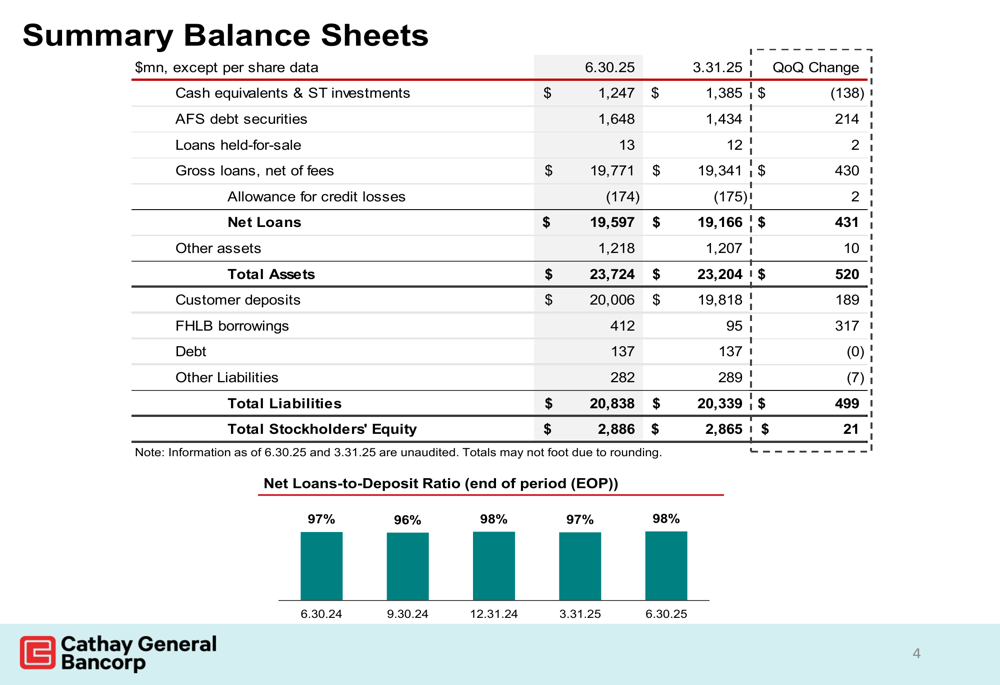
Total (EPA:TTEF) assets grew to $23.7 billion as of June 30, 2025, a $520 million increase from the previous quarter. The bank’s loan portfolio expanded to $19.8 billion, while deposits reached $20.0 billion. The net loans-to-deposit ratio stood at 98%, reflecting a well-balanced funding structure.
The balance sheet summary illustrates these key metrics:
Loan Portfolio Analysis
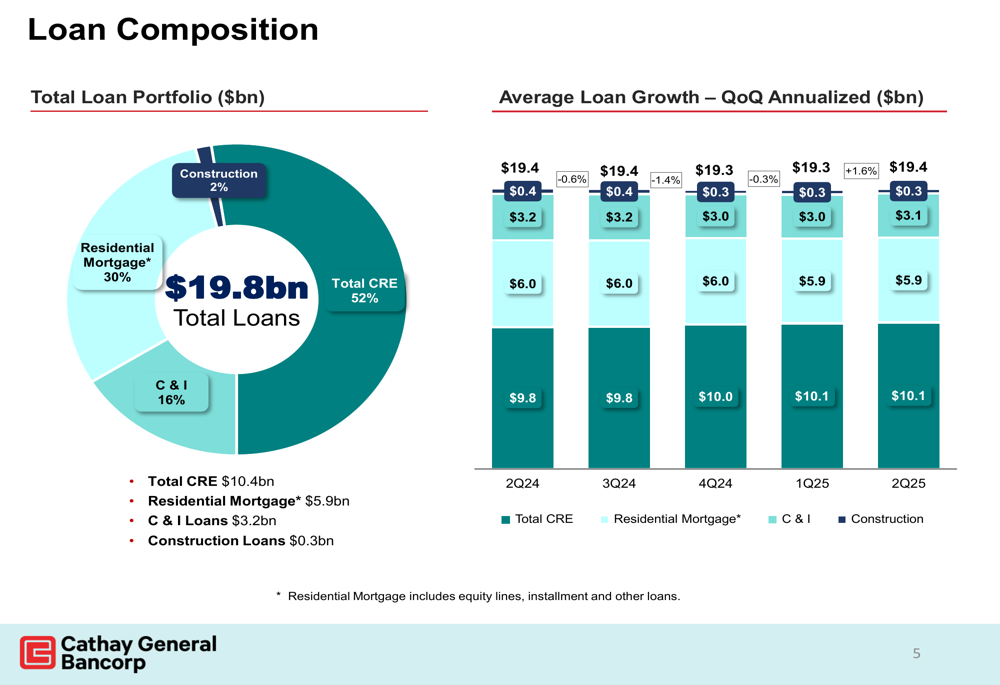
Cathay’s loan portfolio composition remained relatively stable, with commercial real estate (CRE) accounting for 52% ($10.4 billion) of total loans. Residential mortgages represented 30% ($5.9 billion), while commercial and industrial (C&I) loans made up 16% ($3.2 billion) and construction loans constituted 2% ($0.3 billion).
The most notable trend was the accelerated growth in C&I lending, which expanded at an annualized rate of 5.9% quarter-over-quarter. Residential mortgages also showed healthy growth at 3.1%, while CRE loans experienced a slight contraction of $0.3 billion.
The following chart details the loan composition and growth trends:
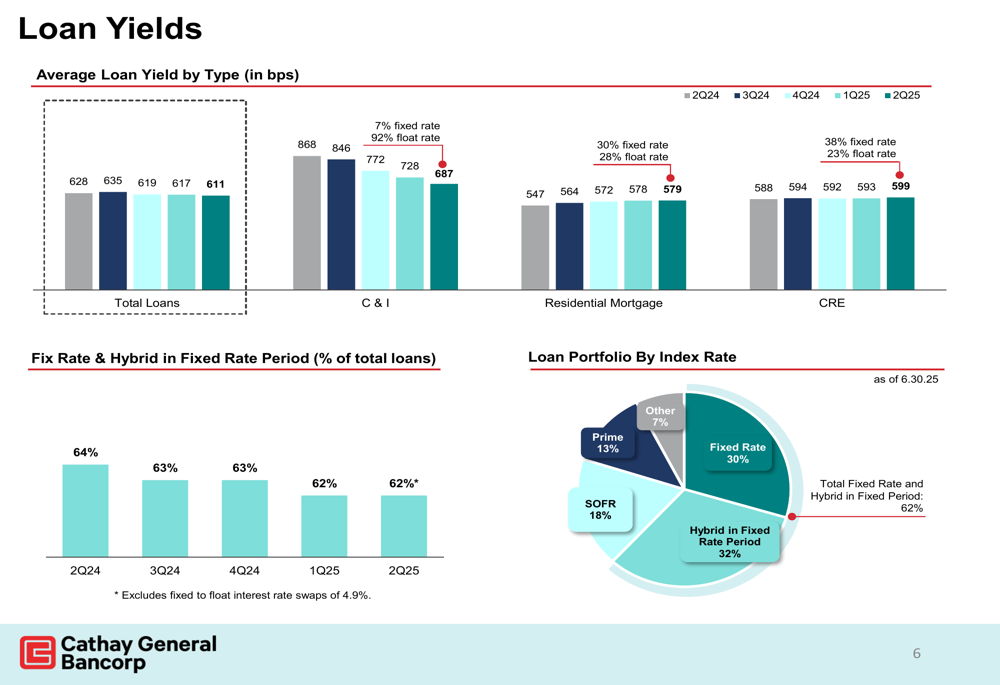
Loan yields have shown some compression, with the average total loan yield decreasing from 635 basis points in Q3 2024 to 611 basis points in Q2 2025. C&I yields experienced the most significant decline, dropping from 846 basis points to 687 basis points over the same period. However, residential mortgage and CRE yields showed modest increases.
Fixed-rate loans and hybrid loans in their fixed-rate period comprised 62% of the total loan portfolio, providing some insulation against interest rate volatility.
Commercial Real Estate and Credit Quality
The bank’s $10.4 billion CRE portfolio remains well-diversified across property types, with residential (18%), retail (13%), and office (7%) representing the largest segments. Geographically, the portfolio is concentrated in California (46%) and New York (35%).
Cathay maintains conservative loan-to-value ratios across its CRE portfolio, with 55% of loans having LTVs below 50%. Only 1% of the portfolio has an LTV exceeding 70%, demonstrating prudent underwriting standards.
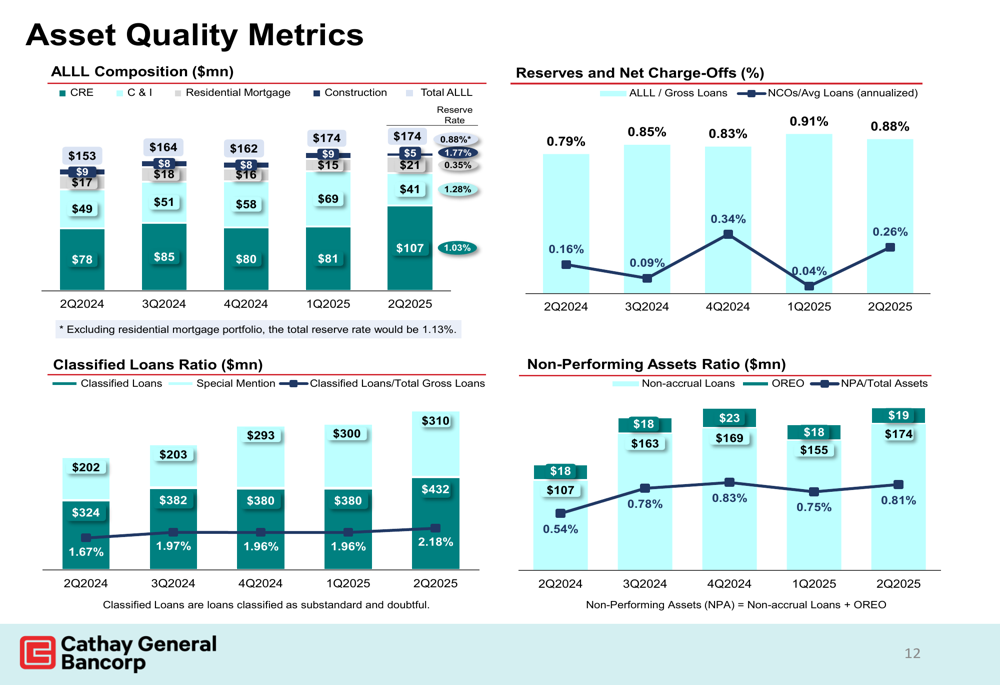
Asset quality metrics remained solid in Q2 2025, with the allowance for loan and lease losses (ALLL) to gross loans ratio at 0.88%. Net charge-offs to average loans increased slightly to 0.26%, while the non-performing assets ratio stood at 0.81%.
The following chart illustrates these asset quality trends:
Deposit Structure and Funding
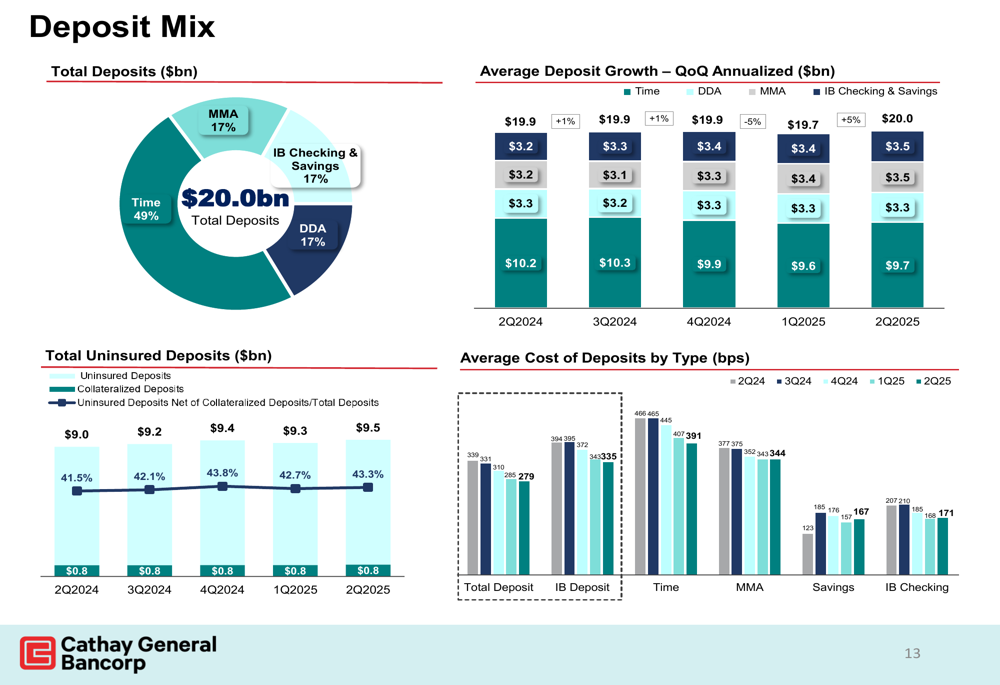
Cathay’s deposit base totaled $20.0 billion as of June 30, 2025, with time deposits representing 49% of the total. Money market accounts and demand deposits each accounted for 17% of the deposit mix.
The cost of deposits has been rising, with the average cost of total deposits increasing to 339 basis points in Q2 2025. Time deposits carried the highest cost at 466 basis points, followed by money market accounts at 407 basis points.
The deposit composition and cost trends are illustrated in the following chart:
Financial Performance
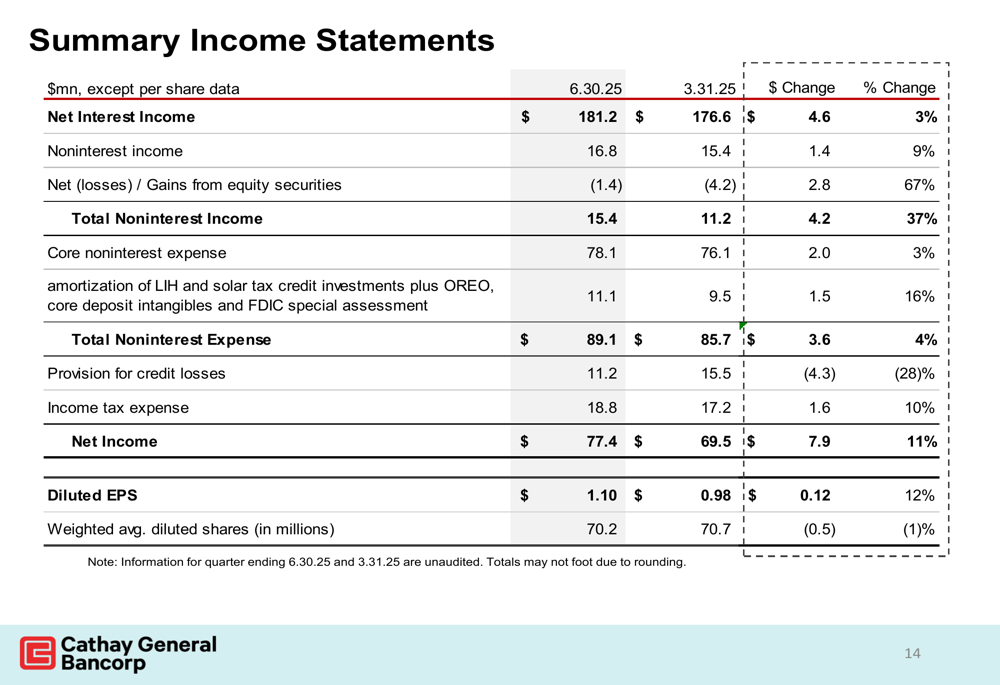
Net interest income for Q2 2025 reached $181.2 million, while non-interest income contributed $15.4 million. Core non-interest expenses totaled $78.1 million, resulting in total non-interest expenses of $89.1 million.
The summary income statement provides a comprehensive view of the bank’s financial performance:
Capital Position
Cathay maintained strong capital ratios, with a Tier 1 risk-based capital ratio of 13.35% and a total risk-based capital ratio of 14.92% as of Q2 2025. The Tier 1 leverage capital ratio stood at 11.09%, well above regulatory requirements.
These robust capital levels provide the bank with flexibility to pursue growth opportunities while maintaining a buffer against potential economic uncertainties.
Management Outlook
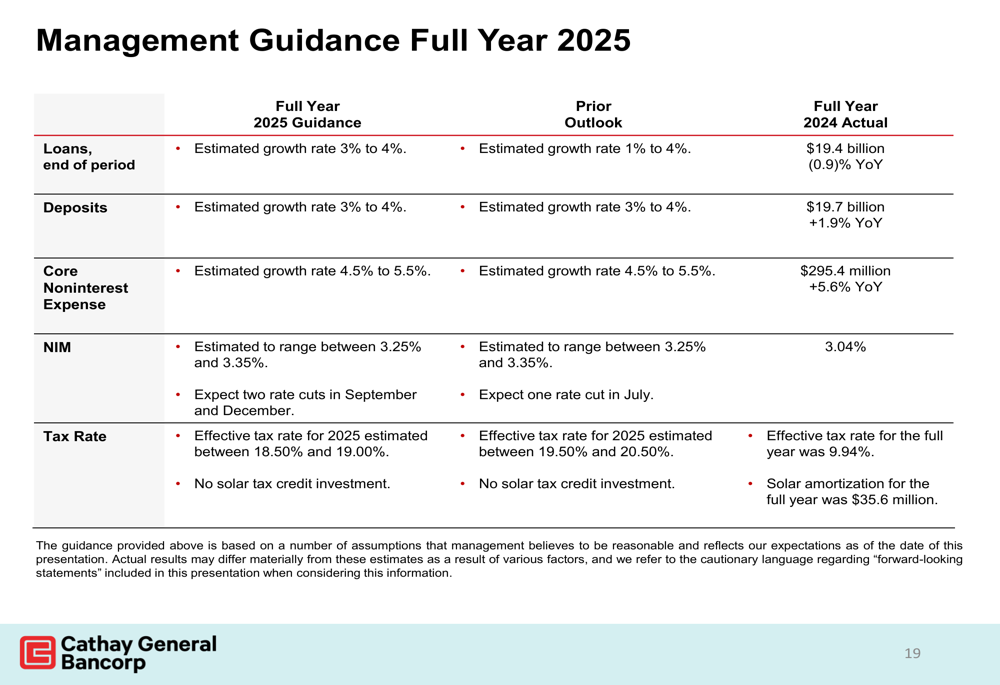
Looking ahead, Cathay’s management provided guidance for the full year 2025, projecting loan and deposit growth of 3-4%. Core non-interest expenses are expected to increase by 4.5-5.5%, while the net interest margin is anticipated to range between 3.25% and 3.35%.
The effective tax rate for 2025 is estimated to be between 18.50% and 19.00%, consistent with recent trends.
The full-year guidance is summarized in the following chart:
Conclusion
Cathay General Bancorp’s Q2 2025 results demonstrate continued improvement from the first quarter, with higher earnings per share and revenue. The bank’s strategic shift toward C&I lending while maintaining a strong position in residential mortgages reflects adaptation to current market conditions.
With solid asset quality, strong capital ratios, and balanced funding, Cathay appears well-positioned to navigate the economic landscape through the remainder of 2025. Management’s maintained guidance suggests confidence in the bank’s ability to achieve steady growth despite ongoing market challenges.
Full presentation:
This article was generated with the support of AI and reviewed by an editor. For more information see our T&C.