Novo Nordisk, Eli Lilly fall after Trump comments on weight loss drug pricing

Introduction & Market Context
CBRE Group Inc (NYSE:CBRE) delivered strong financial results for the first quarter of 2025, with double-digit growth across key metrics, according to the company’s earnings presentation released on April 24, 2025. Despite the robust performance, the real estate services giant maintained its full-year guidance, citing significant market uncertainty related to tariffs.
The company’s stock has shown positive momentum recently, with premarket trading indicating a 1.52% gain to $123.90, following a 3.27% increase in the previous session. CBRE shares have been trading in a 52-week range of $84.24 to $147.75, showing significant recovery from their lows.
Quarterly Performance Highlights
CBRE reported impressive growth across all major financial metrics in Q1 2025 compared to the same period last year. Revenue increased by 12% to $8.91 billion, while net revenue grew by 15% to $5.11 billion. The company’s GAAP net income jumped 29% to $163 million, with Core EBITDA rising 27% to $540 million.
As shown in the following consolidated results summary, earnings per share metrics also showed strong improvement, with GAAP EPS up 32% to $0.54 and Core EPS increasing 10% to $0.86:
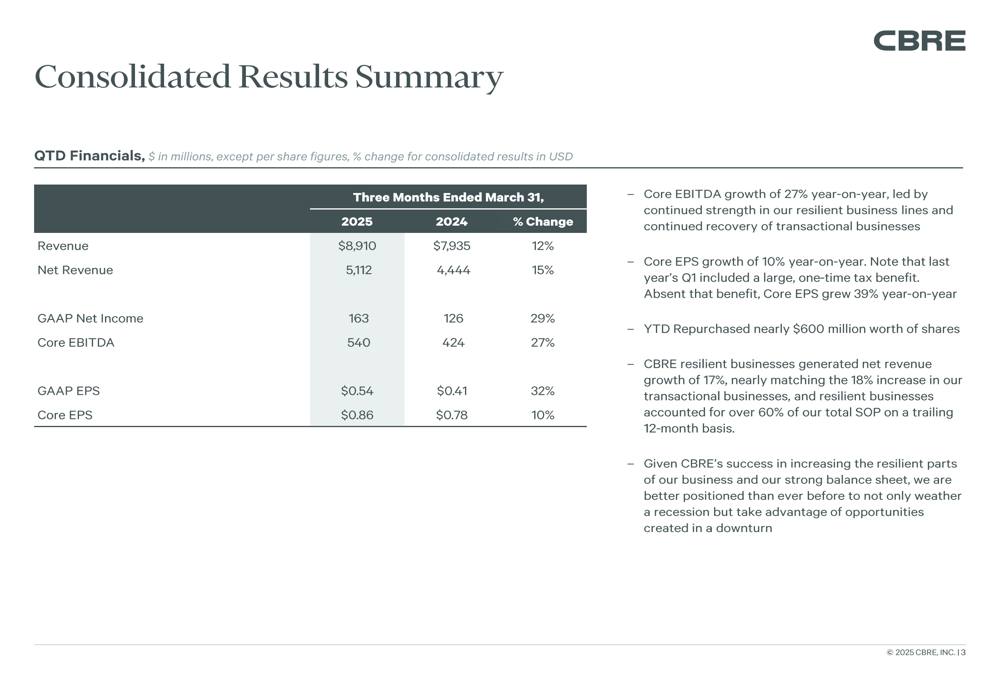
"Core EBITDA growth of 27% reflects strong operating leverage across all segments," noted the company in its presentation materials. The results demonstrate CBRE’s continued success in both its transactional business lines and its more resilient, recurring revenue streams.
Segment Performance Analysis
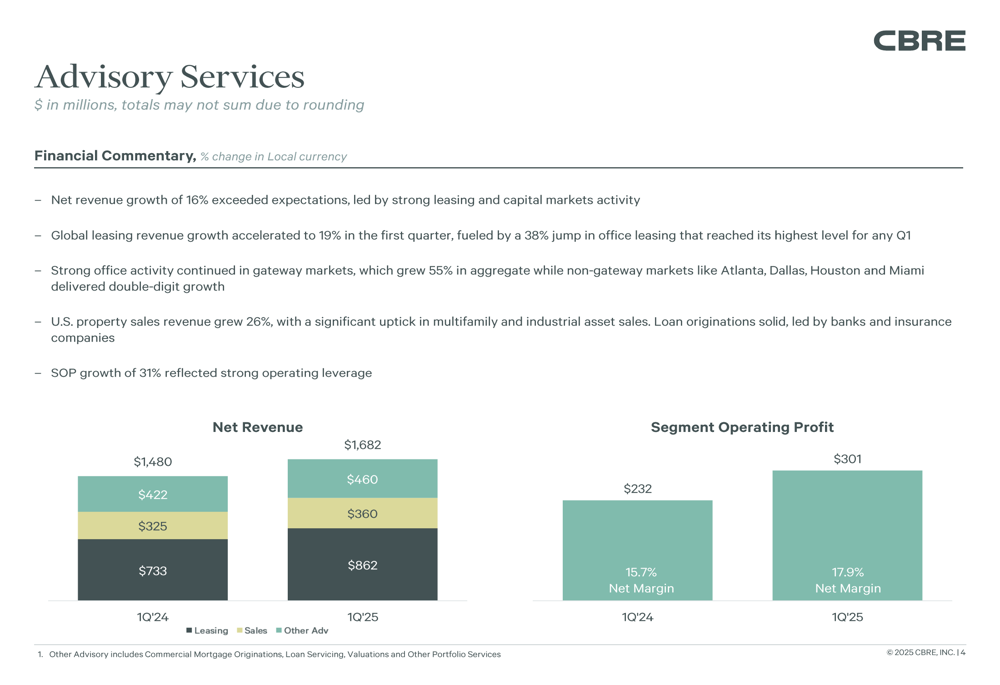
The Advisory Services segment, which includes leasing and sales activities, delivered particularly strong results with net revenue growth of 16% year-over-year to $1.68 billion. Segment operating profit surged 31% to $301 million, reflecting strong operating leverage. The company highlighted continued momentum in global leasing, which grew 19%, and noted that office activity in gateway markets grew by an impressive 55% in aggregate. U.S. property sales revenue increased by 26%.
The following chart illustrates the Advisory Services segment’s performance:
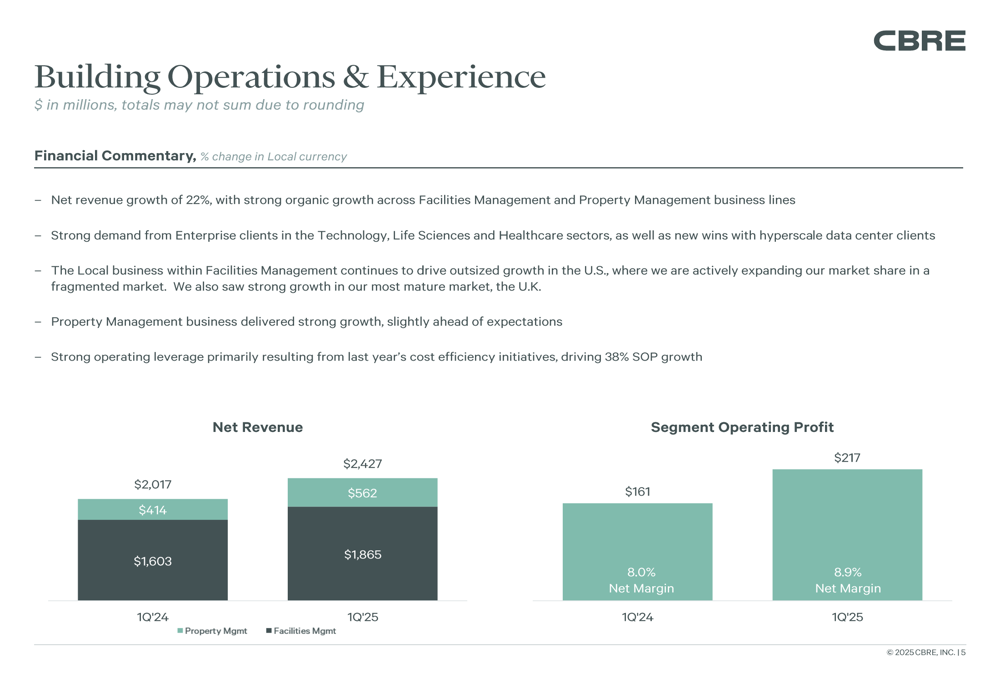
The Building Operations & Experience segment, which includes property and facilities management, also posted robust results with net revenue growth of 22% to $2.43 billion. Segment operating profit increased by 35% to $217 million, with the net margin expanding from 8.0% to 8.9%. CBRE noted strong demand from enterprise clients in the technology, life sciences, and healthcare sectors.
The segment’s performance is detailed in the following chart:
The Project Management segment delivered solid results with net revenue growth of 9% to $774 million and segment operating profit increasing 12% to $113 million. The company highlighted strong wins in infrastructure projects in the UK and Middle East, as well as large new program mandates in real estate.
The Real Estate Investments segment showed mixed results, with revenue increasing slightly by 2% to $233 million, but segment operating profit declining by 26% to $25 million. However, CBRE noted that investment management operating profit was up 43% year-on-year, exceeding expectations, with assets under management reaching $149 billion, up nearly $3 billion since the end of 2024.
Capital Allocation and Cash Flow
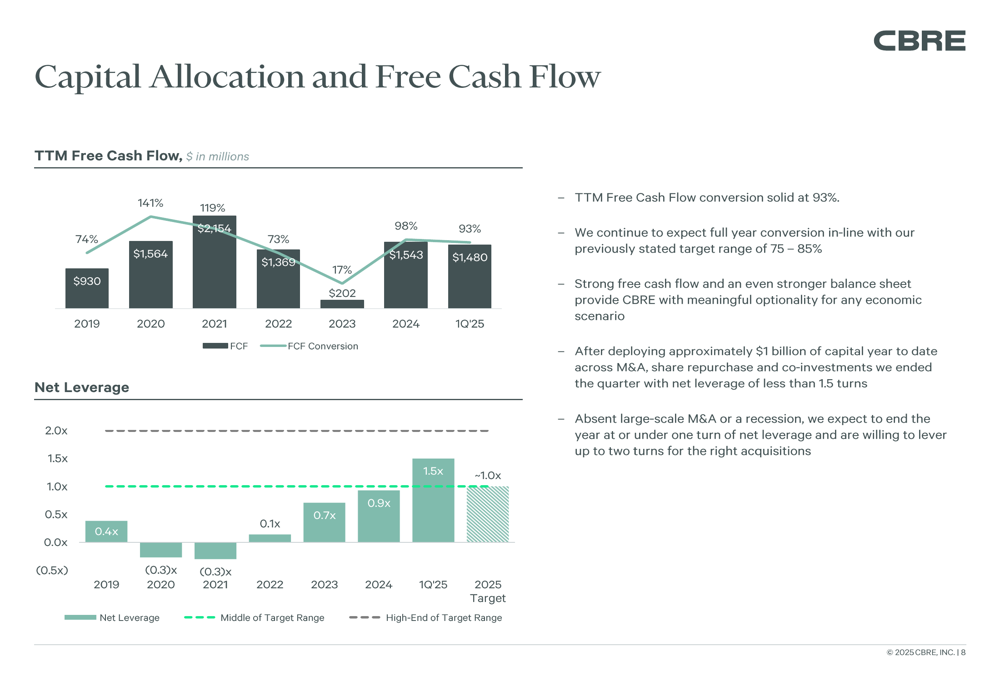
CBRE maintained strong free cash flow performance, with trailing twelve-month free cash flow conversion at 93%, well within the company’s target range of 75-85%. The company deployed approximately $1 billion of capital year-to-date across mergers and acquisitions, share repurchases, and co-investments, while maintaining a net leverage ratio of less than 1.5 turns.
The following chart illustrates CBRE’s free cash flow and net leverage trends:
The company’s financial position remains solid, with ample liquidity to support future growth initiatives. CBRE’s balanced approach to capital allocation reflects its commitment to both organic growth and strategic acquisitions, while maintaining financial discipline.
2025 Outlook and Guidance
Despite the strong first-quarter performance, CBRE maintained its full-year 2025 Core EPS guidance range of $5.80 to $6.10. The company expects free cash flow to approximate 2024 levels, with conversion within its 75-85% target range.
The company provided the following outlook for its business segments:
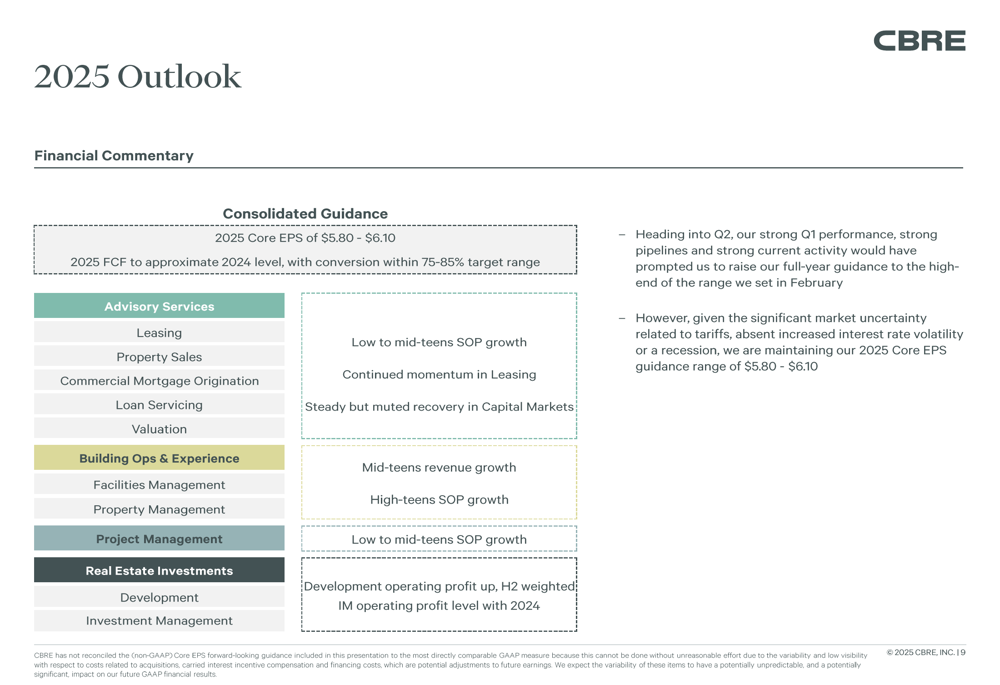
"Heading into Q2, our strong Q1 performance, strong pipelines and strong current activity would have prompted us to raise our full-year guidance to the high-end of the range we set in February," the company stated. "However, given the significant market uncertainty related to tariffs, absent increased interest rate volatility or a recession, we are maintaining our 2025 Core EPS guidance range."
The company’s presentation also highlighted the breakdown between its resilient and transactional business lines, with resilient revenue streams accounting for $7.5 billion of the company’s $8.9 billion in total revenue for the quarter:
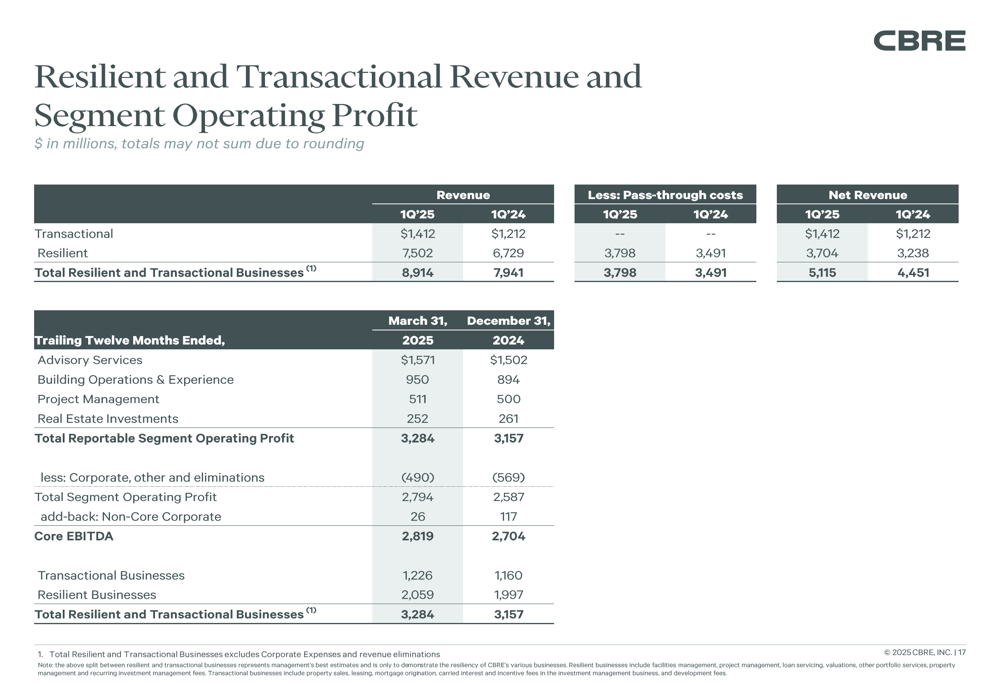
This balance between resilient and transactional revenue streams positions CBRE well to navigate potential market uncertainties while capitalizing on growth opportunities across its diverse business portfolio.
In conclusion, CBRE’s Q1 2025 results demonstrate the company’s continued operational strength and market leadership, though management remains cautious about the full-year outlook due to external economic uncertainties. Investors will likely be watching closely for any signs of impact from tariff-related concerns in the coming quarters.
Full presentation:
This article was generated with the support of AI and reviewed by an editor. For more information see our T&C.