Gold is 2025’s best performer. UBS sees more upside

Centuri Holdings Inc (NYSE:CTRI) reported second-quarter 2025 results on August 6, showing revenue growth of 7.7% year-over-year and prompting management to raise its full-year guidance. The infrastructure services provider’s stock has shown signs of recovery, trading up 0.5% in Wednesday’s premarket after gaining 3.8% in the previous session.
Quarterly Performance Highlights
Centuri reported Q2 2025 revenue of $724.1 million, up from $672.1 million in the same period last year. Adjusted EBITDA increased to $71.8 million from $68.6 million, representing a 4.7% improvement. The company’s adjusted EBITDA margin stood at 9.9%.
"We are seeing meaningful margin improvement in our core business, particularly in the electric segments," said Christian Brown, President and CEO, according to the presentation materials.
Net income attributable to common stock was $8.1 million ($0.09 per diluted share), down from $11.7 million ($0.14 per diluted share) in Q2 2024. On an adjusted basis, earnings per share came in at $0.19, slightly below the $0.20 reported in the prior-year period.
As shown in the following quarterly results overview:
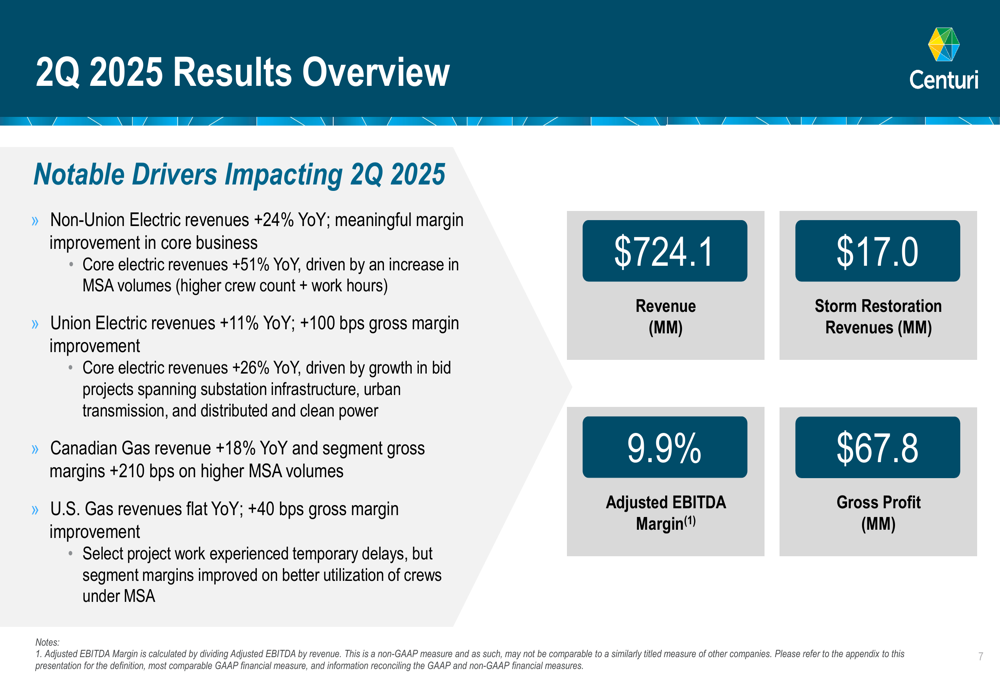
The electric segment emerged as the primary growth driver, with non-union electric revenues increasing 24% year-over-year and union electric revenues rising 11%. Core electric revenues showed even stronger performance, up 51% and 26% respectively. Canadian gas operations also contributed positively with an 18% revenue increase and 210 basis points improvement in gross margins. U.S. gas revenues remained flat year-over-year but showed a 40 basis point improvement in gross margins.
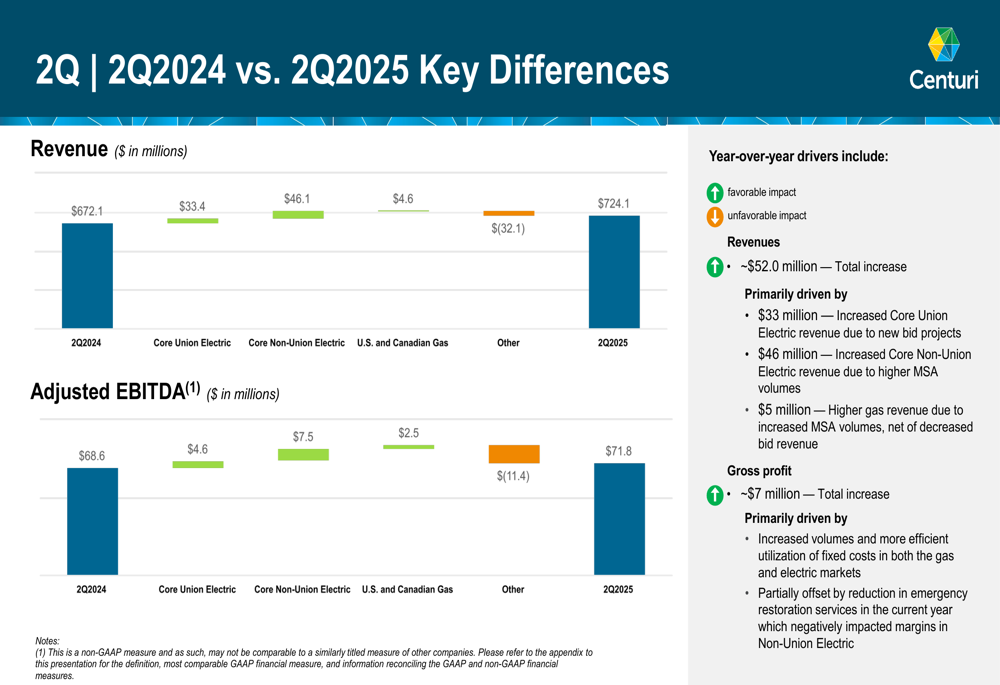
The following chart illustrates the key differences between Q2 2024 and Q2 2025 performance:
Commercial Momentum and Strategic Initiatives
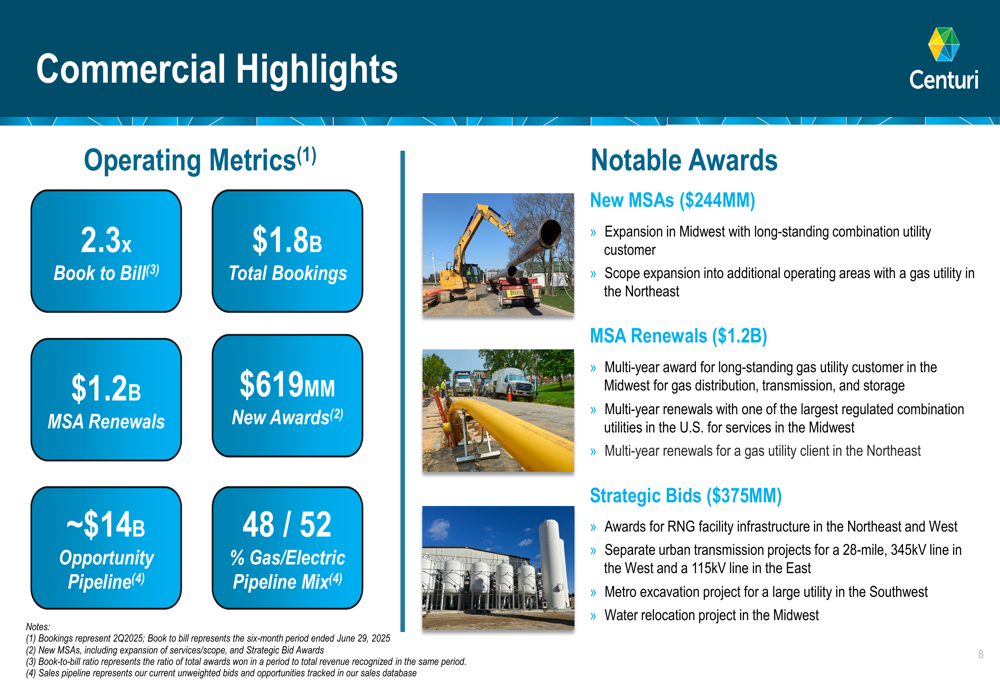
Centuri demonstrated strong commercial momentum with total bookings of $1.8 billion and a book-to-bill ratio of 2.3x. The company secured $1.2 billion in MSA (Master Service Agreement) renewals and $619 million in new awards. Its opportunity pipeline stands at approximately $14 billion, with a balanced mix between gas and electric projects.
The company’s commercial performance is highlighted in the following slide:
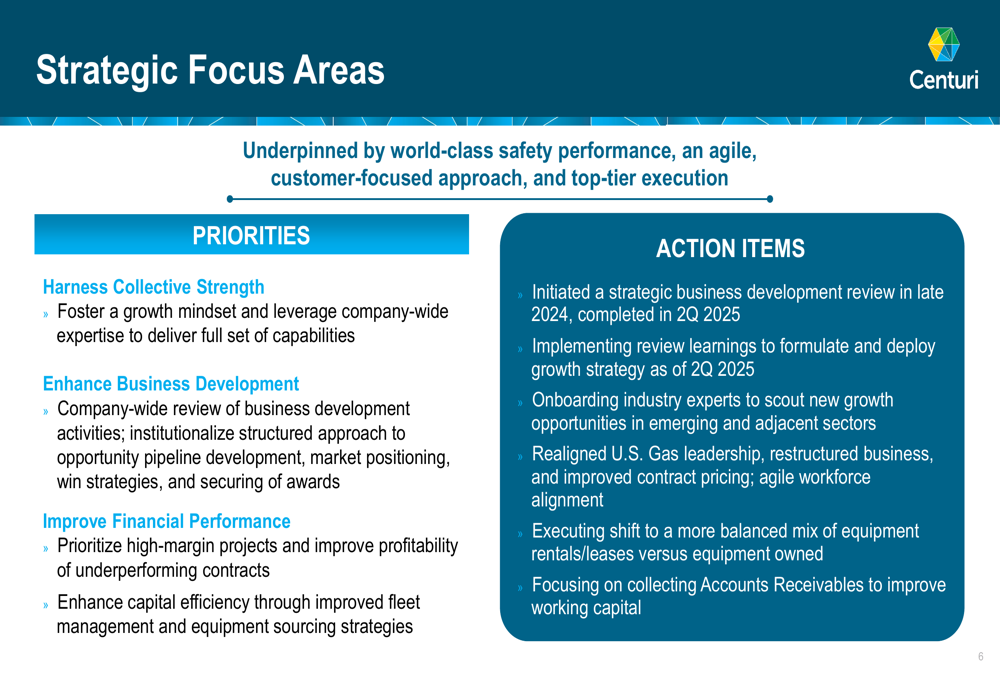
Management outlined several strategic focus areas, including enhancing business predictability, executing a structured business development approach, optimizing equipment sourcing and fleet management, and improving gas business performance through margin enhancement.
"We initiated a strategic business development review in late 2024, completed in 2Q 2025, and are now implementing the learnings to formulate and deploy our growth strategy," noted Gregory Izenstark, EVP and CFO, according to the presentation.
The company’s strategic priorities are illustrated in the following slide:
Raised Guidance and Outlook
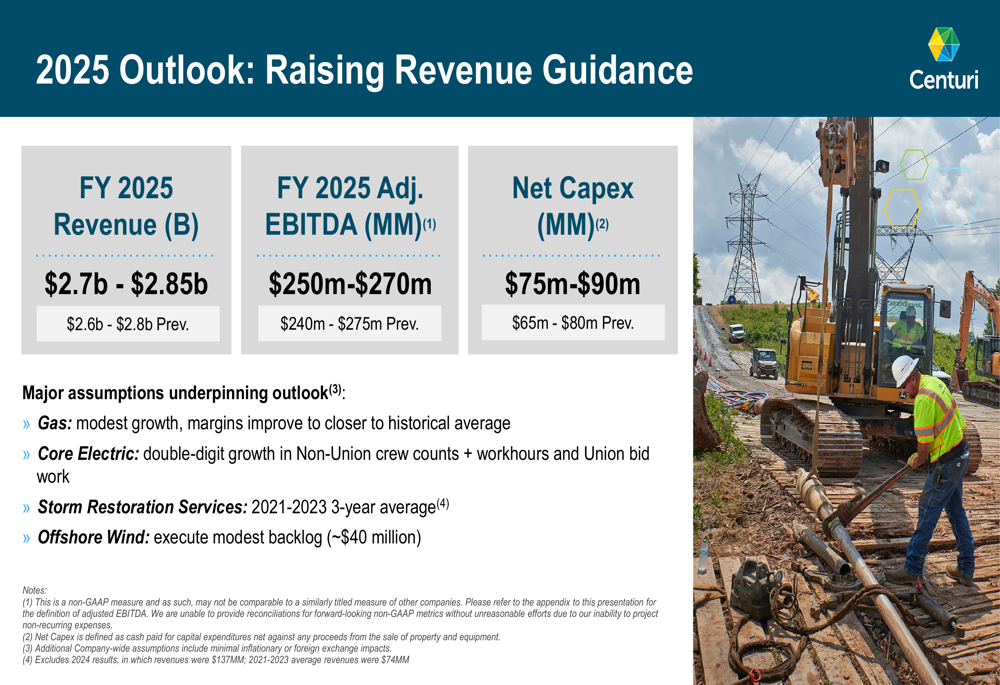
In a sign of growing confidence, Centuri raised its full-year 2025 revenue guidance to $2.7-2.85 billion from the previous range of $2.6-2.8 billion. The company also narrowed its adjusted EBITDA guidance to $250-270 million from the previous $240-275 million, while increasing its net capital expenditure forecast to $75-90 million from $65-80 million.
The revised outlook is based on several key assumptions, including modest growth in the gas segment with improving margins, double-digit growth in electric operations, and storm restoration services in line with the 2021-2023 three-year average.
The updated guidance is presented in the following slide:
Financial Position and Debt
Centuri’s net debt increased to $910 million at the end of Q2 2025, up from $858 million in Q1 2025. Consequently, the company’s net debt to adjusted EBITDA ratio rose to 3.7x from 3.5x in the previous quarter, indicating a slight deterioration in its leverage position.
Free cash flow remained negative at $(47.1) million for Q2 2025, though this represented an improvement from $(74.2) million in Q2 2024. The company highlighted its focus on collecting accounts receivable to improve working capital as one of its strategic priorities.
Investment Profile
Centuri positions itself as a leading North American utility infrastructure services company with over 115 years of operating history. The company maintains a diversified business mix with electric utility services accounting for 51% of revenue, U.S. gas operations contributing 42%, and Canadian gas operations representing 7%. Regulated utilities make up 80% of the company’s customer base.
The following slide outlines Centuri’s investment highlights:
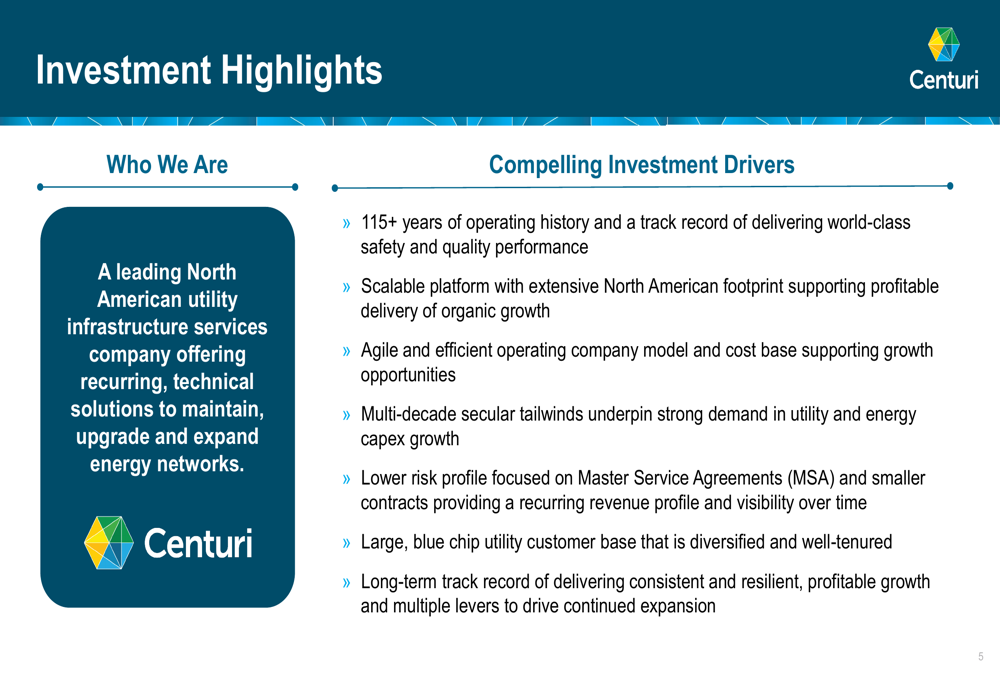
The company’s geographic footprint spans across North America with 53 gas locations and 35 electric locations, serving major utility customers including Southern Company (NYSE:SO), National Grid (LON:NG), Dominion Energy (NYSE:D), and Exelon (NASDAQ:EXC).
This recovery in Q2 performance comes after a challenging first quarter, when Centuri reported a net loss per share of $0.12, missing analyst forecasts and triggering a 9% stock drop. The improved Q2 results and raised guidance suggest the company has successfully addressed some of the challenges it faced earlier in the year.
Full presentation:
This article was generated with the support of AI and reviewed by an editor. For more information see our T&C.