Nvidia among investors in xAI’s $20 bln capital raise- Bloomberg

Introduction & Executive Summary
CGI Inc. (NYSE:GIB) released its second quarter fiscal 2025 financial results on April 30, 2025, reporting solid revenue growth but with some margin pressure across key metrics. The IT and business consulting services provider posted revenue of $4.02 billion, representing a 7.6% year-over-year increase (3.3% in constant currency), while adjusted earnings per share rose 7.6% to $2.12.
The company’s bookings reached $4.5 billion in the quarter, resulting in a book-to-bill ratio of 111.5%, signaling strong future growth potential. However, CGI also reported increasing debt levels, with net debt rising to $3.24 billion and the net debt to capitalization ratio climbing to 24.1%, up 770 basis points from the same period last year.
"Our team delivered disciplined execution of our growth strategy, even in a challenging environment," said François Boulanger, President and Chief Executive Officer. "Our financial strength, strategic capital deployment, and strong quarterly bookings of $4.5 billion, representing 111% of revenue, reflect our clients’ trust in CGI’s expertise."
Quarterly Performance Highlights
CGI’s Q2 F2025 results showed growth across key financial metrics, though margins faced some pressure compared to the prior year period. Net earnings increased marginally by 0.7% to $430 million, with the net earnings margin declining 70 basis points to 10.7%. Diluted earnings per share rose 3.3% to $1.89.
As shown in the following financial highlights chart:
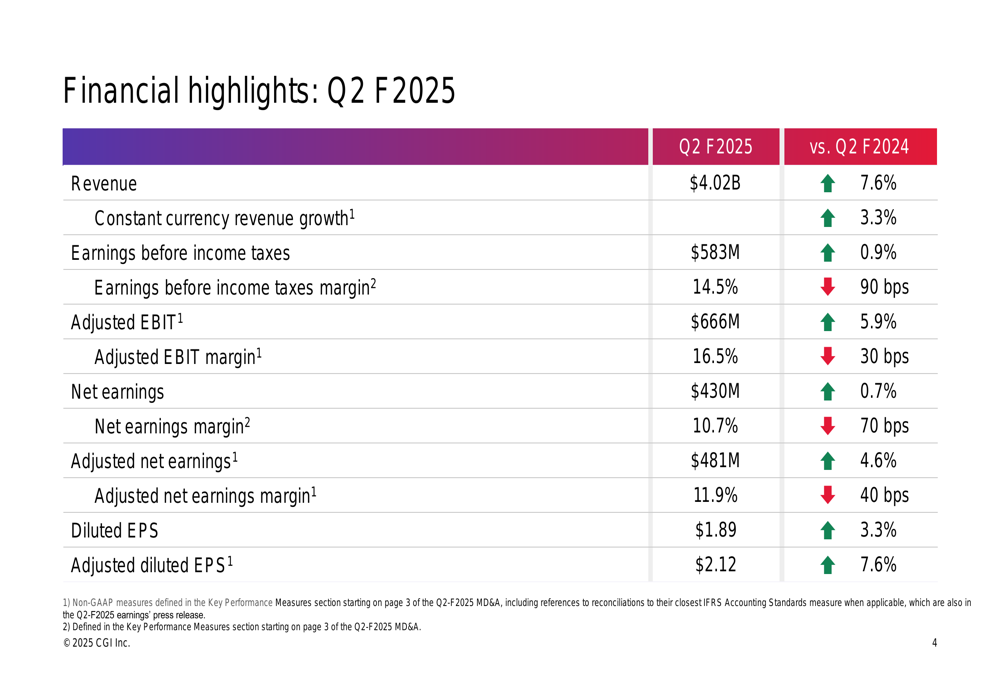
On an adjusted basis, the company’s performance was somewhat stronger. Adjusted EBIT grew 5.9% to $666 million, with the adjusted EBIT margin at 16.5%, down 30 basis points year-over-year. Adjusted net earnings increased 4.6% to $481 million, while adjusted diluted EPS showed the strongest growth at 7.6%, reaching $2.12.
The company’s cash generation remained solid but showed some weakness compared to the prior year, with cash from operating activities at $438 million or 10.9% of revenue, down from $502 million in Q2 F2024. However, on a trailing twelve-month basis, cash from operations improved to $2.21 billion (14.6% of revenue) compared to $2.12 billion in the prior year period.
Detailed Financial Analysis
CGI’s revenue mix demonstrates the company’s diversified business model across service types, geographies, and industry verticals. As illustrated in the following breakdown:
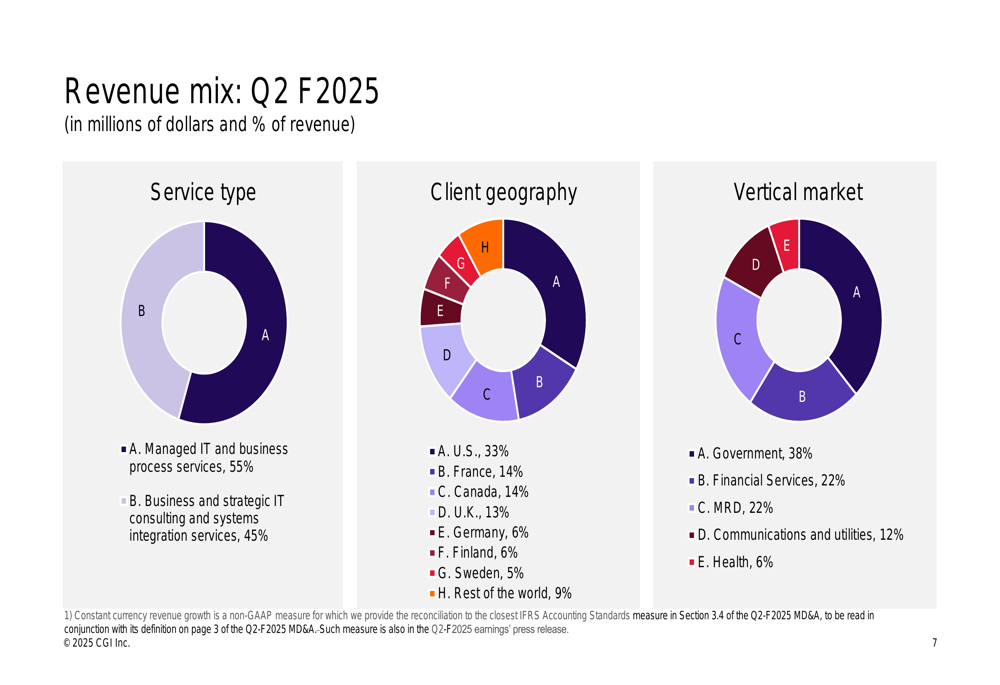
Managed IT and business process services accounted for 55% of revenue, while business and strategic IT consulting and systems integration services contributed 45%. Geographically, the U.S. represented CGI’s largest market at 33% of revenue, followed by France and Canada (both at 14%), and the U.K. (13%). By vertical market, government work dominated at 38%, with financial services and manufacturing, retail & distribution (MRD) each contributing 22%.
The company’s segmented results revealed varying performance across regions:
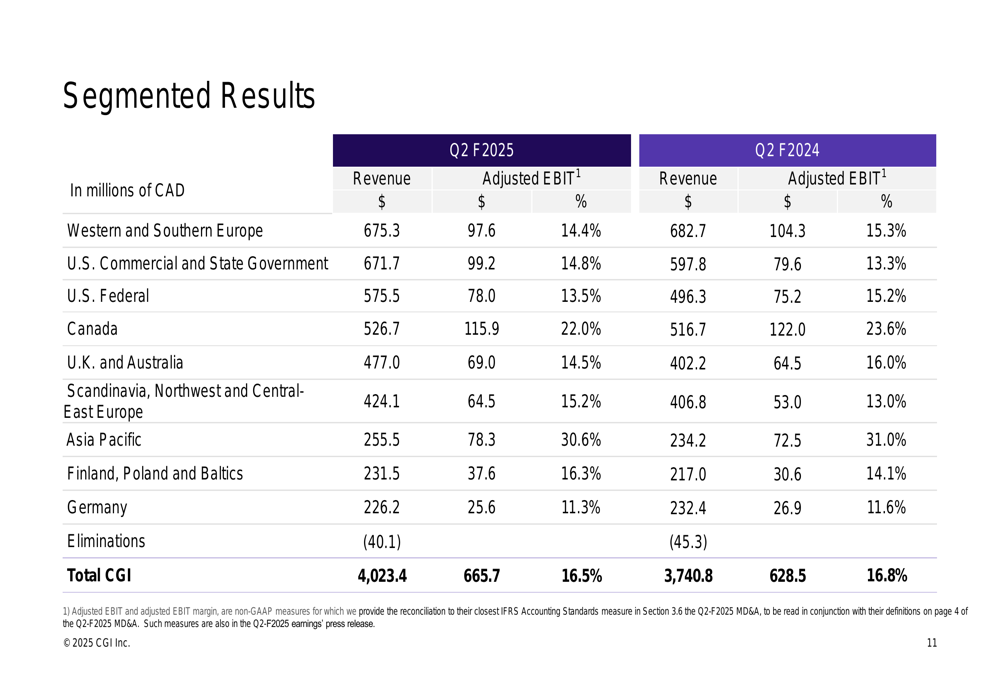
Notable performers included U.S. Commercial and State Government, which grew revenue by 12.4% to $671.7 million, and U.S. Federal, which increased 16.0% to $575.5 million. The U.K. and Australia segment also showed strong growth of 18.6% to $477.0 million. However, several segments experienced margin compression, including Canada (down 160 basis points to 22.0%) and U.K. and Australia (down 150 basis points to 14.5%).
CGI’s bookings performance was particularly strong, with the quarterly book-to-bill ratio at 111.5% and the trailing twelve-month ratio at 110.6%, indicating sustained demand for the company’s services:
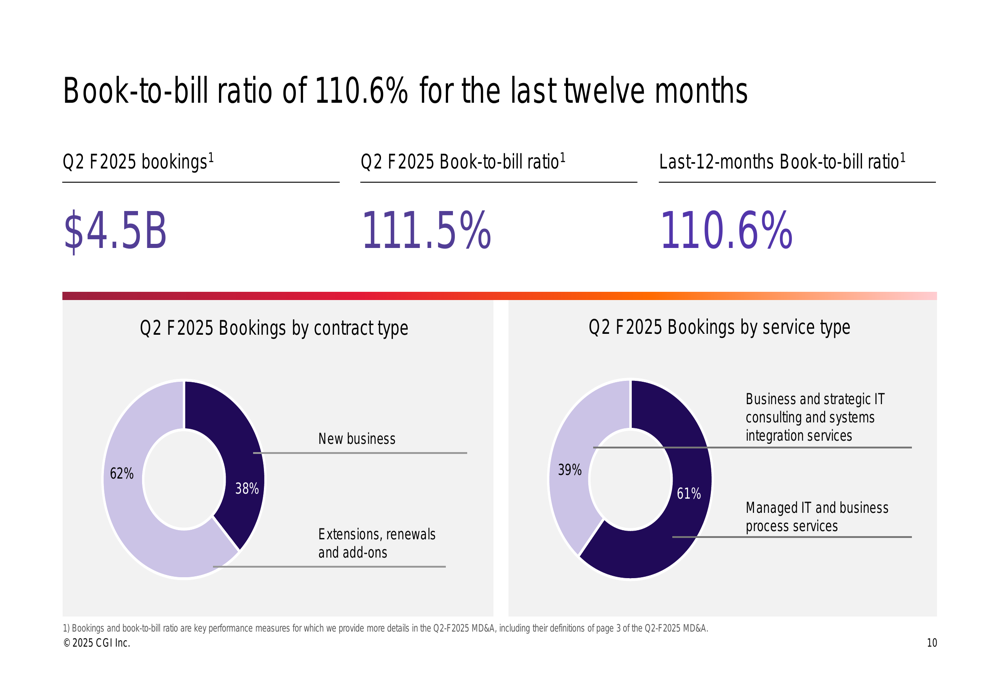
The composition of bookings showed 62% coming from new business, with the remainder from extensions, renewals, and add-ons. By service type, 61% of bookings were for managed IT and business process services, which typically represent longer-term, recurring revenue streams.
Strategic Initiatives & Market Position
CGI continues to leverage its global delivery model, with 64% of its consultants located in client proximity, 13% in nearshore or onshore delivery centers, and 23% in global delivery centers including India, Philippines, and Morocco. This balanced approach allows the company to provide both local expertise and cost-efficient delivery.
The company’s employee ownership model remains a key differentiator, with 87% of employees participating as shareholders through CGI’s Share Purchase Plan. This high level of employee ownership helps align interests across the organization and supports talent retention.
CGI’s debt profile has changed significantly over the past year, with long-term debt and lease liabilities increasing to $4.37 billion, up $1.34 billion from Q2 F2024:
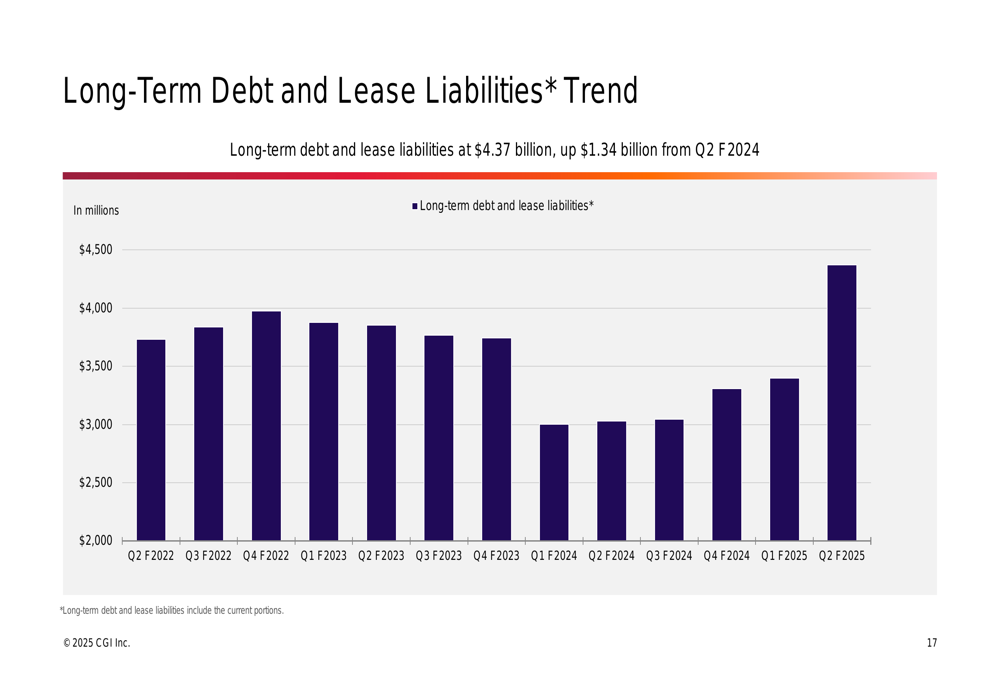
This increase in leverage suggests the company may be positioning itself for strategic acquisitions or investments, continuing the M&A strategy highlighted in previous quarters. In its Q4 F2024 earnings call, CGI had indicated plans for a $1 billion investment in AI and digital capabilities, which may partially explain the increased debt levels.
Forward-Looking Statements
CGI’s strong bookings performance, with a book-to-bill ratio of 111.5% for the quarter and 110.6% for the trailing twelve months, indicates a positive outlook for future revenue growth. The high proportion of new business (62% of bookings) suggests the company is successfully expanding its client base and service offerings.
However, the consistent margin pressure across multiple metrics bears watching, as does the significant increase in debt levels. The net debt to capitalization ratio of 24.1% represents a substantial increase of 770 basis points year-over-year, which could impact financial flexibility if not balanced with corresponding growth in operating cash flow.
As CGI continues to execute its Build and Buy strategy, investors will be watching for signs that the company can maintain its growth trajectory while managing the increased leverage and addressing the margin pressures evident in this quarter’s results. The company’s consistent ability to generate strong cash flow (14.6% of revenue on a trailing twelve-month basis) provides some reassurance regarding its capacity to service the increased debt load while continuing to invest in growth initiatives.
Full presentation:
This article was generated with the support of AI and reviewed by an editor. For more information see our T&C.