Trump to impose 100% tariff on China starting November 1

Introduction & Market Context
Claritev Corp (CTEV) released its Q1 2025 financial results on May 8, 2025, showing a slight revenue decline amid ongoing strategic transformation efforts. The healthcare technology company’s shares were down 4.95% in premarket trading to $20.18, following a previous close of $21.23.
The quarterly results come as Claritev continues to implement its "Vision 2030" transformation program, which was announced during the previous quarter. The company has maintained its full-year guidance while highlighting progress in its Payment & Revenue Integrity segment and international expansion initiatives.
Quarterly Performance Highlights
Claritev reported total revenue of $231.3 million for Q1 2025, representing a 0.4% decrease quarter-over-quarter and a 1.4% decline year-over-year. Despite the revenue dip, the company maintained strong profitability with Adjusted EBITDA of $142.1 million, up 0.4% from the previous quarter but down 3.2% compared to Q1 2024.
As shown in the following financial summary chart:
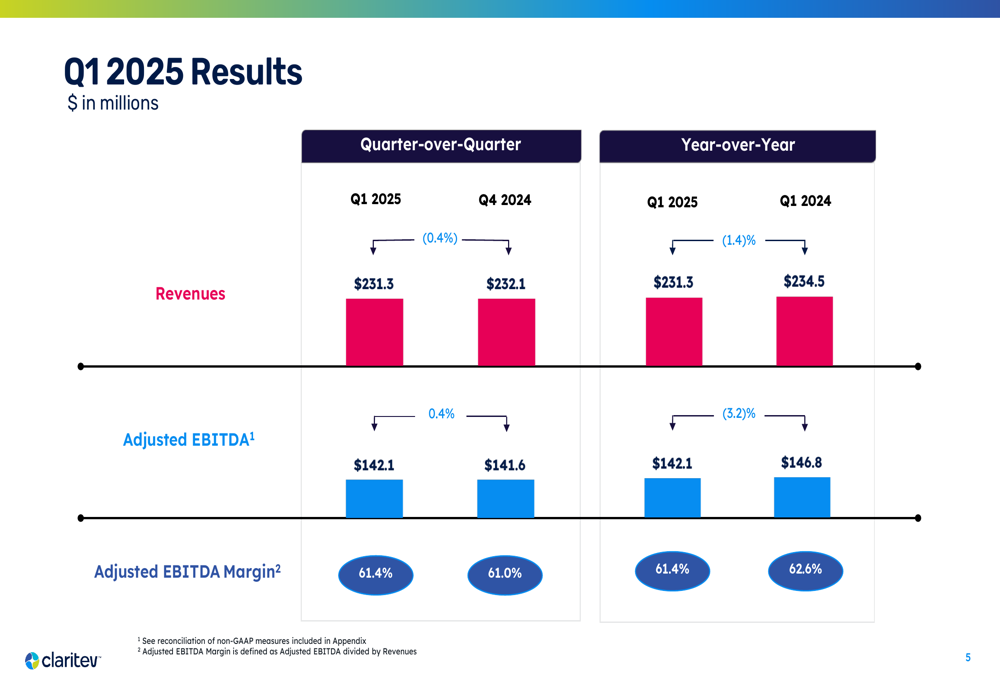
The company’s Adjusted EBITDA margin stood at 61.4%, showing a slight improvement from 61.0% in Q4 2024 but down from 62.6% in the same quarter last year. Claritev also reported $13.1 million in unlevered free cash flow and $13.7 million in annual contract value (ACV) bookings during the quarter.
Among the operational highlights, Claritev successfully refinanced its debt, extending maturities by nearly three years, executed its brand launch at the ViVE Conference, and onboarded key executives including a Chief AI Officer and Chief Medical (TASE:BLWV) Officer.
Segment Analysis
Claritev’s performance varied significantly across its service lines, with its Payment & Revenue Integrity segment showing strong growth while other segments faced challenges. The detailed breakdown reveals:
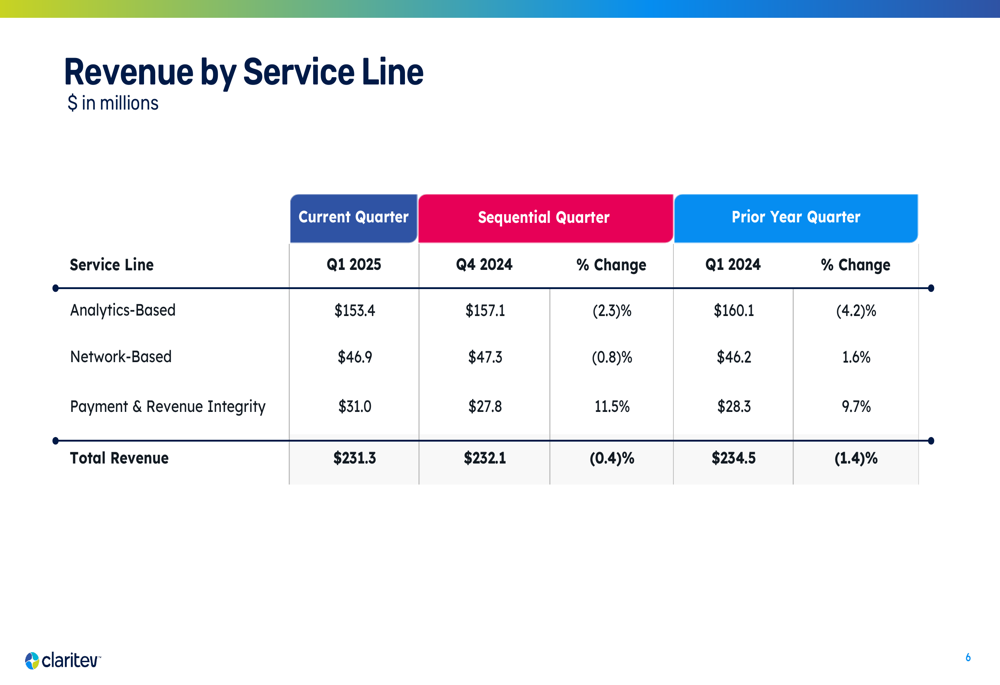
The Payment & Revenue Integrity segment was the standout performer, growing 11.5% quarter-over-quarter and 9.7% year-over-year to $31.0 million. This growth helped offset declines in the company’s largest segment, Analytics-Based services, which fell 2.3% quarter-over-quarter and 4.2% year-over-year to $153.4 million. Network-Based services showed mixed results, declining slightly by 0.8% from the previous quarter but growing 1.6% year-over-year to $46.9 million.
The company processed $42.9 billion in medical charges during Q1 2025, identifying potential medical cost savings of $6.2 billion, representing 15% of processed charges. Commercial Health Plans showed the highest savings rate at 28%.
Strategic Initiatives
A key strategic development highlighted in the presentation was Claritev’s international expansion through a partnership with Burjeel Holdings to enter the Middle East and North Africa (MENA) region:
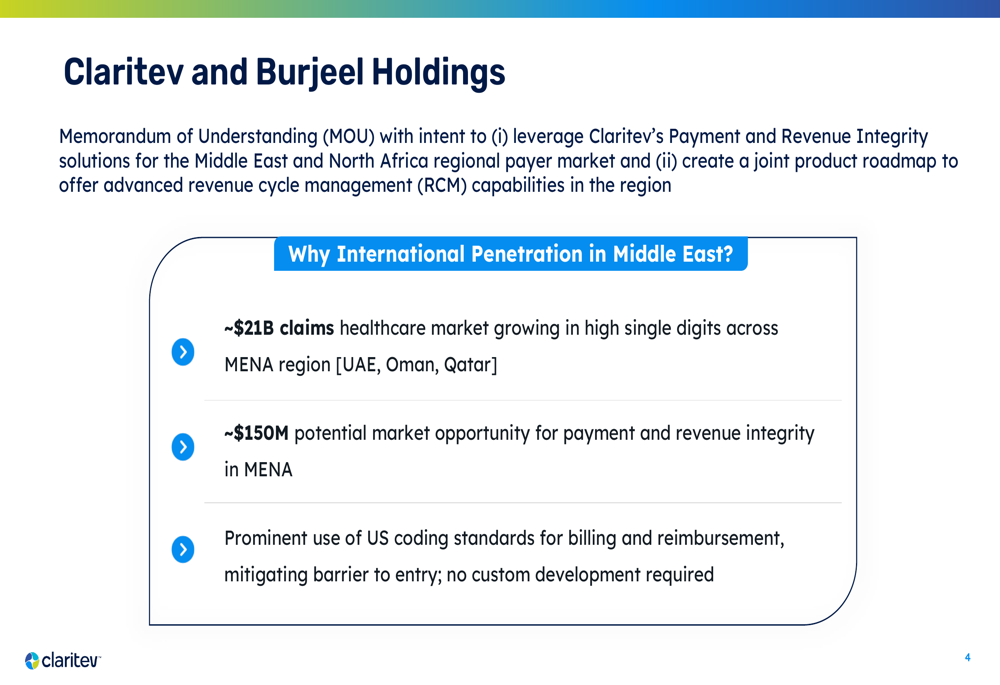
This Memorandum of Understanding aims to leverage Claritev’s Payment and Revenue Integrity solutions in a healthcare claims market worth approximately $21 billion and growing at high single digits. The company estimates a potential market opportunity of around $150 million for payment and revenue integrity services in the region.
Claritev also outlined its capital allocation priorities, emphasizing organic investments to fuel its Vision 2030 Plan as the highest priority, followed by debt reduction:
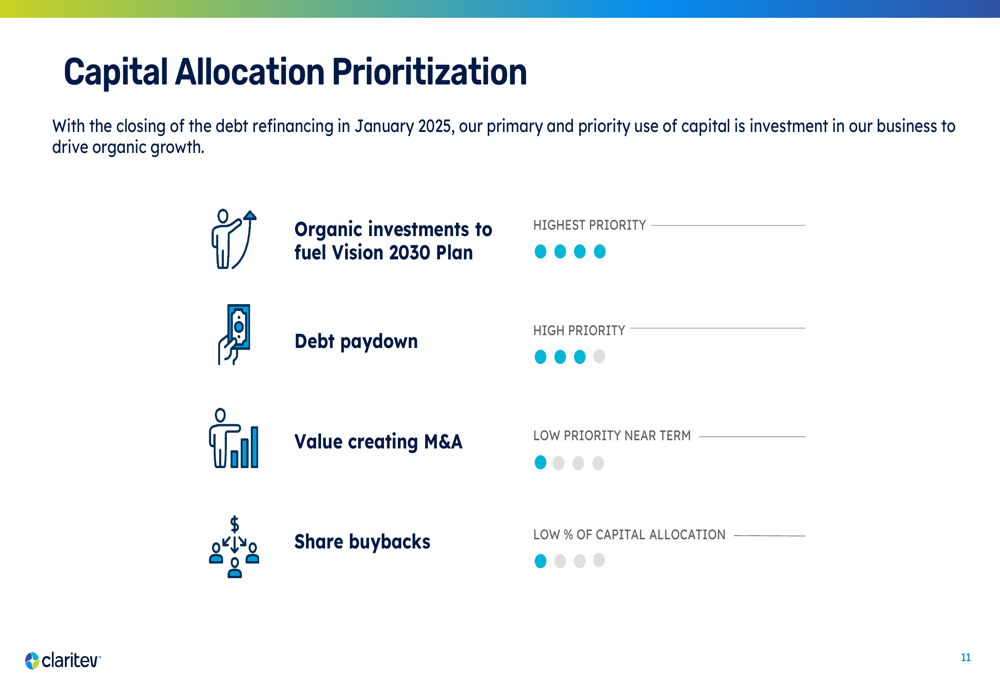
The company’s debt profile remains substantial, with a first-lien leverage ratio of 8.1x based on $4.633 billion in net debt against $572 million in TTM Adjusted EBITDA. However, the successful refinancing during the quarter has extended debt maturities by nearly three years, providing additional financial flexibility.
Forward Guidance
Claritev reaffirmed its full-year 2025 guidance, projecting revenue performance between a 2% decline and flat growth compared to 2024. The company expects sequential quarterly growth progression as impacts from strategic client transitions diminish.
The detailed guidance includes:
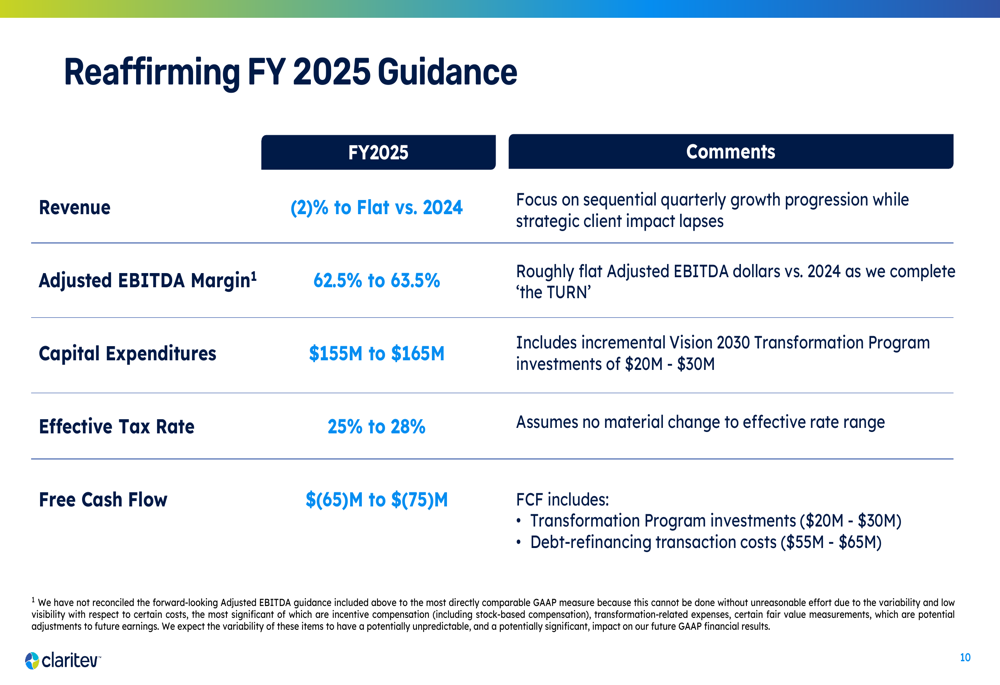
Adjusted EBITDA margin is projected to range between 62.5% and 63.5%, representing roughly flat Adjusted EBITDA dollars compared to 2024. Capital expenditures are expected to be between $155 million and $165 million, including $20-30 million for the Vision 2030 Transformation Program.
Free Cash Flow is projected to be negative at $(65)$ million to $(75)$ million, impacted by transformation program investments ($20-30 million) and debt-refinancing transaction costs ($55-65 million).
Financial Reconciliation
The company provided detailed reconciliations between GAAP and non-GAAP financial measures, highlighting significant differences between reported net losses and adjusted figures:
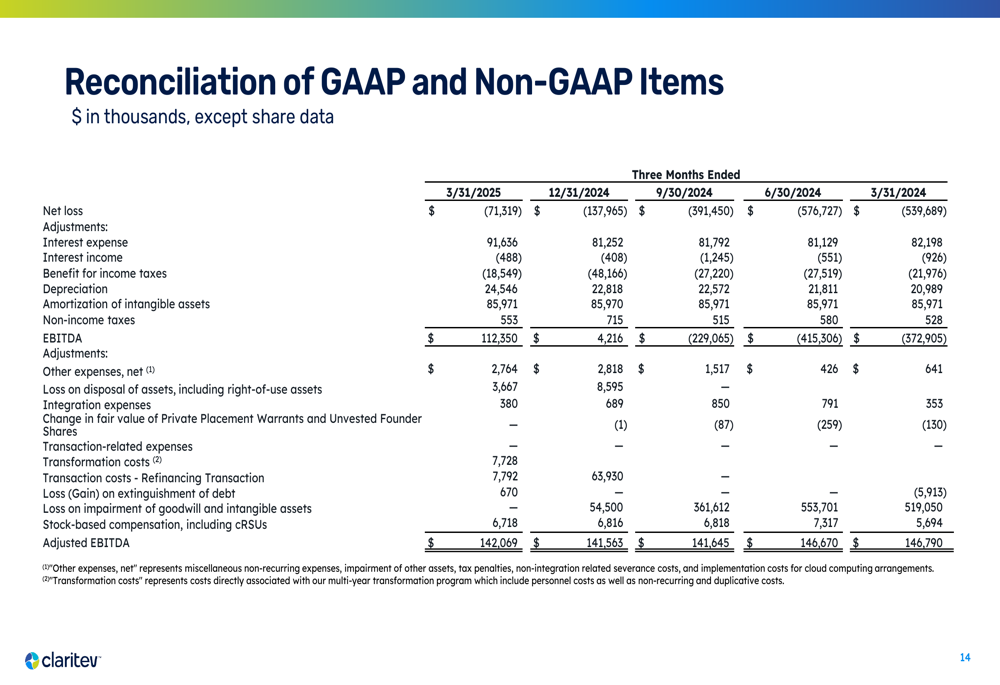
While Claritev reported GAAP net losses of $71.3 million for Q1 2025, its adjusted EBITDA reached $142.1 million after accounting for various adjustments including interest expense, depreciation, amortization, and other items. This pattern of significant adjustments between GAAP and non-GAAP figures has been consistent across recent quarters.
Despite ongoing revenue challenges, Claritev’s focus on high-margin segments and international expansion suggests the company is positioning itself for potential growth as its transformation program progresses through 2025.
Full presentation:
This article was generated with the support of AI and reviewed by an editor. For more information see our T&C.