Wang & Lee Group board approves 250-to-1 reverse share split

Cohen & Steers Inc (NYSE:CNS) reported mixed second-quarter 2025 results, with assets under management (AUM) reaching $88.9 billion despite experiencing net outflows, while operating margins compressed as expenses outpaced revenue growth.
Quarterly Performance Highlights
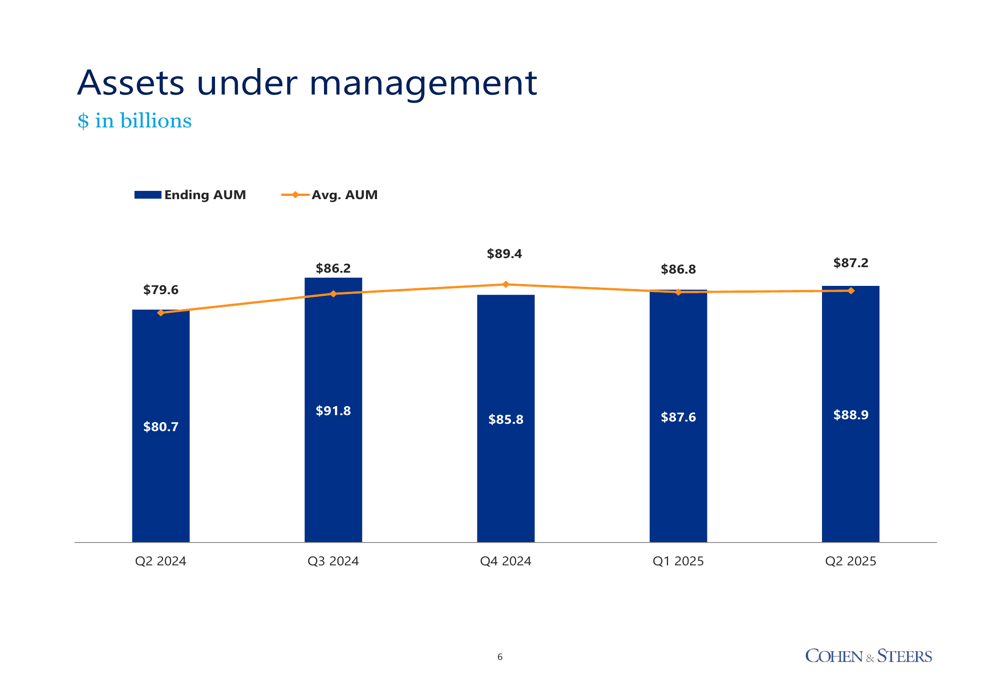
The investment manager saw its AUM increase by $1.3 billion from the previous quarter, reaching $88.9 billion as of June 30, 2025, primarily driven by market appreciation of $2.3 billion. This growth occurred despite net outflows of $131 million, marking a reversal from the $222 million in net inflows reported in Q1 2025.
As shown in the following chart of quarterly AUM trends, both ending and average AUM have been gradually increasing over the past year:
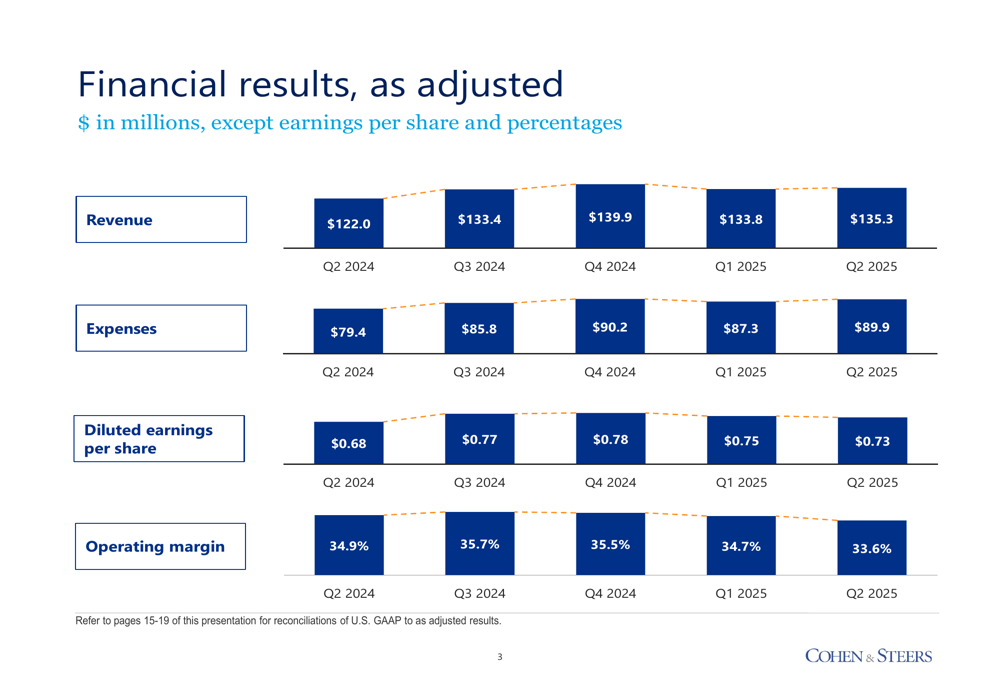
Cohen & Steers reported adjusted diluted earnings per share of $0.73 for Q2 2025, down from $0.75 in the previous quarter and below the $0.77 reported in Q3 2024. The company’s adjusted net income declined to $37.3 million from $38.4 million in Q1 2025.
The following chart illustrates the company’s key financial metrics over the past five quarters, showing the recent compression in earnings per share and operating margin:
Detailed Financial Analysis
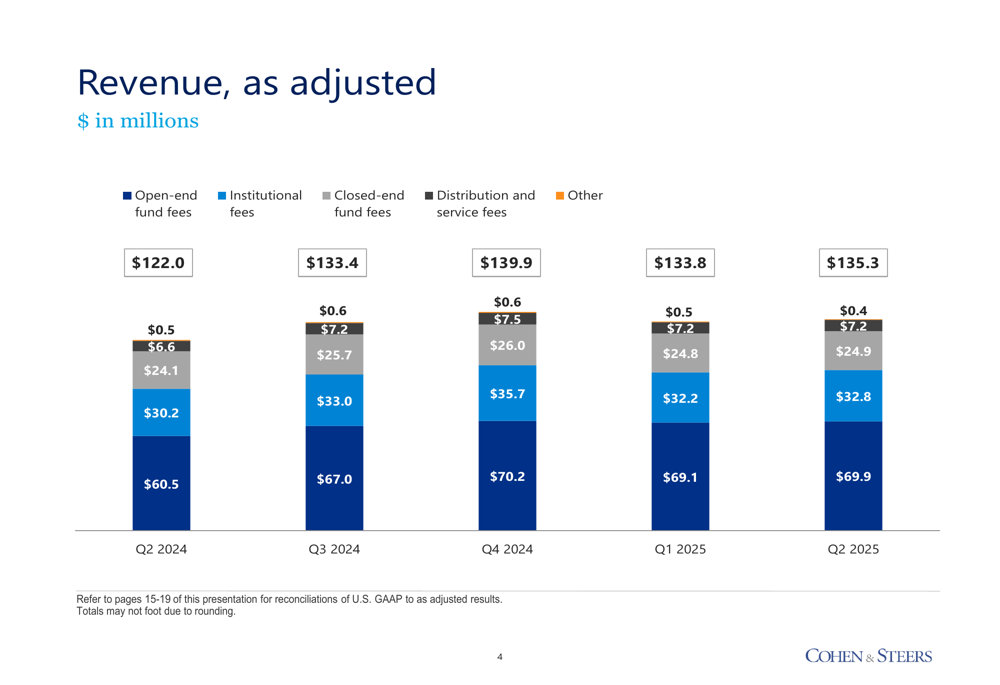
Revenue increased slightly to $135.3 million in Q2 2025, up 1.1% from $133.8 million in the previous quarter. Open-end fund fees remained the largest revenue contributor at $69.9 million, followed by institutional fees at $32.8 million and closed-end fund fees at $24.9 million.
The breakdown of revenue by source shows the company’s diversified income streams:
However, expenses grew at a faster rate, rising to $89.9 million in Q2 2025, a 3.0% increase from $87.3 million in Q1 2025. This expense growth outpaced revenue growth, resulting in operating margin compression to 33.6% from 34.7% in the previous quarter.
The following chart details the company’s expense structure:
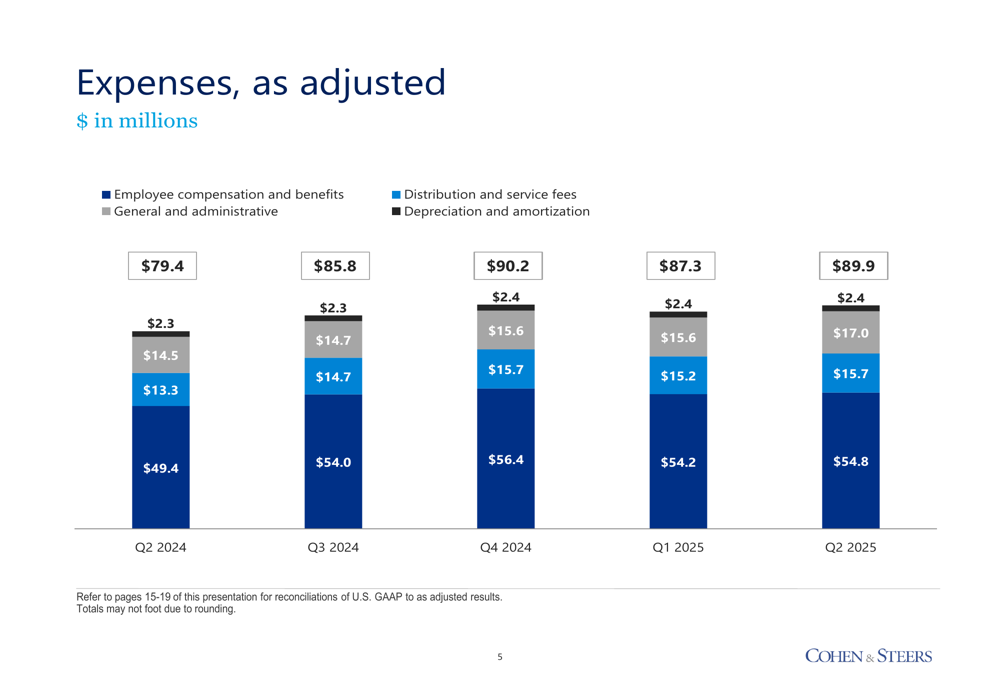
Employee compensation and benefits remained the largest expense category at $54.8 million, while distribution and service fees saw the most significant increase, rising to $17.0 million from $15.6 million in Q1 2025.
Investment Performance and Fund Flows
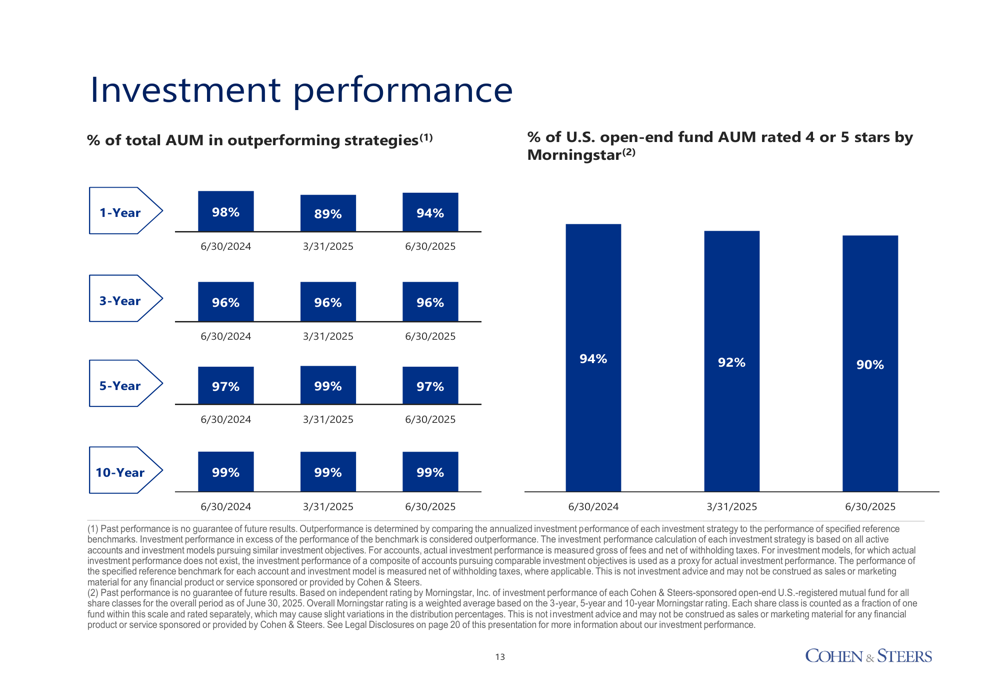
Despite the challenges in fund flows, Cohen & Steers maintained strong investment performance across its strategies. As of June 30, 2025, 94% of the company’s total AUM was in strategies outperforming their benchmarks over a one-year period, up from 89% at the end of Q1 2025. The company’s long-term performance remained exceptional, with 96% of AUM outperforming over three years, 97% over five years, and 99% over ten years.
The following chart illustrates the company’s strong investment performance metrics:
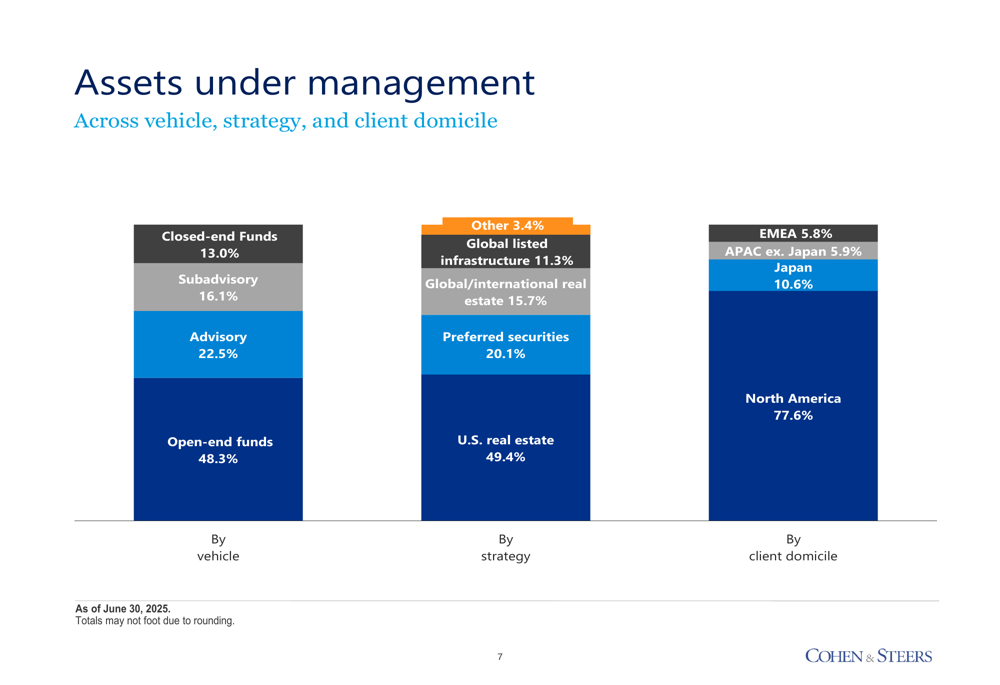
The firm’s AUM remains well-diversified across investment vehicles, strategies, and client domiciles. Open-end funds represent the largest portion at 48.3% of AUM, while U.S. real estate remains the dominant strategy at 49.4%. Geographically, North American clients account for 77.6% of AUM.
The following breakdown shows the company’s diversification across these dimensions:
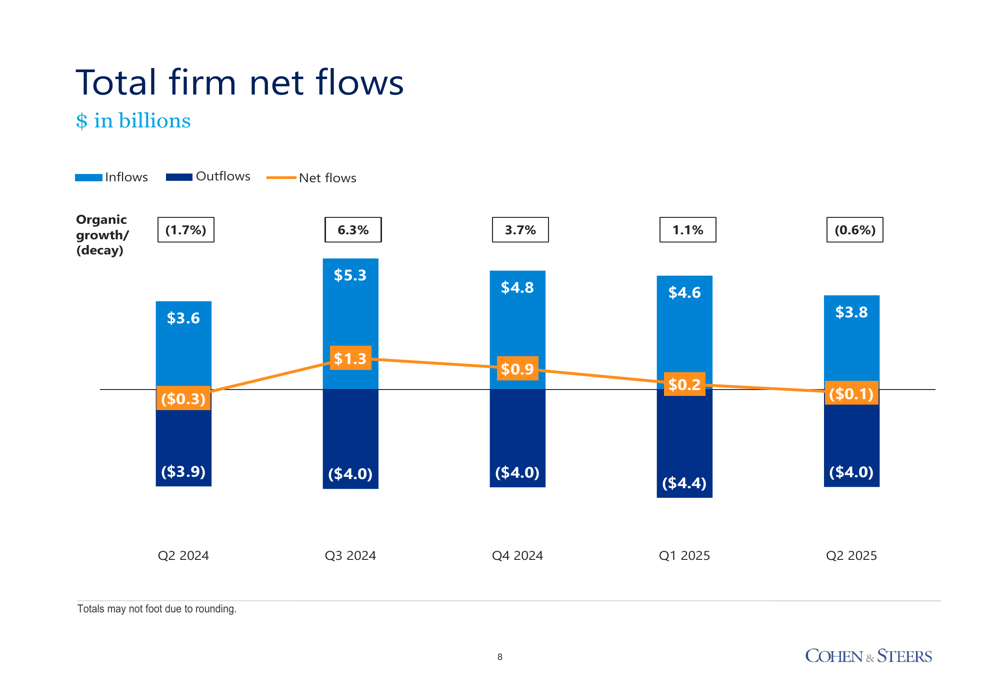
Fund flows varied significantly across investment vehicles and strategies. Open-end funds continued to attract net inflows of $0.3 billion in Q2 2025, though at a slower pace than the $0.6 billion in Q1 2025. Meanwhile, the advisory segment experienced accelerated net outflows of $0.4 billion, compared to $0.1 billion in the previous quarter.
By strategy, U.S. real estate attracted $0.3 billion in net inflows, reversing the $0.2 billion outflow from Q1 2025. However, preferred securities saw significant outflows of $0.5 billion, representing an organic decay rate of 10.6%.
The following chart shows the total firm’s net flows over the past five quarters:
Forward-Looking Statements
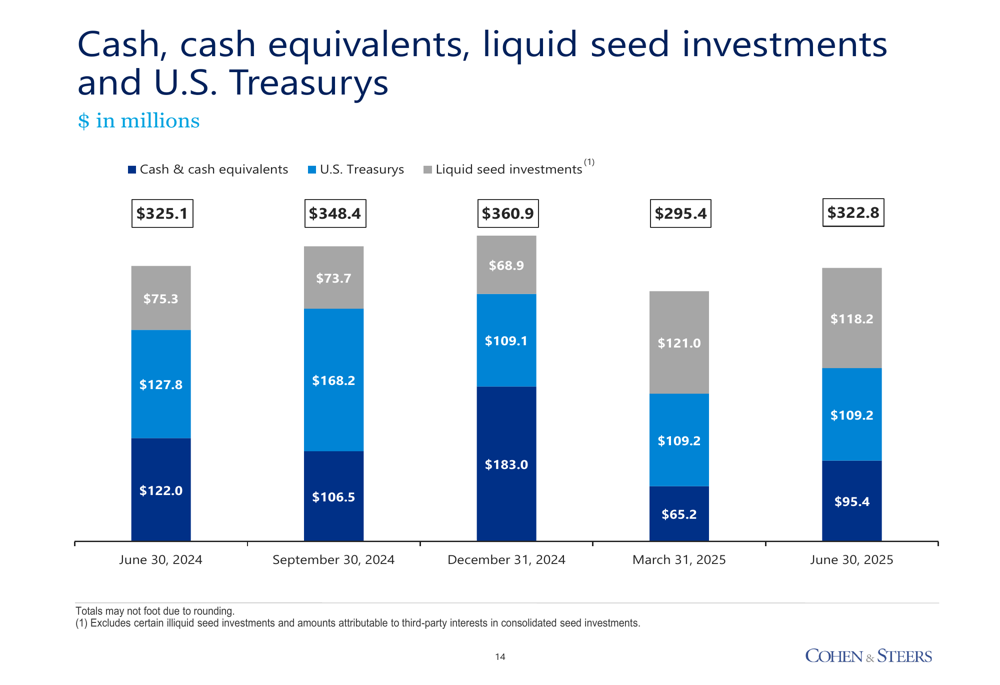
Cohen & Steers maintains a strong financial position with $322.8 million in cash, cash equivalents, liquid seed investments, and U.S. Treasurys as of June 30, 2025. This represents an increase from $295.4 million at the end of Q1 2025, providing the company with significant financial flexibility.
The company’s cash position over the past year is illustrated in the following chart:
In the previous earnings call, CEO Joe Harvey had emphasized the company’s preparedness for market volatility, stating, "Our balance sheet is extremely strong, so we’re prepared for whatever comes down the pike." The latest results reinforce this position, with the company maintaining substantial liquidity despite the challenging fund flow environment.
The stock traded up 1.61% in after-hours trading following the earnings release, reaching $77.21, suggesting investors were encouraged by the company’s ability to grow AUM despite net outflows. However, the stock remains well below its 52-week high of $110.67, reflecting ongoing concerns about margin compression and slowing growth in the asset management industry.
Full presentation:
This article was generated with the support of AI and reviewed by an editor. For more information see our T&C.