U.S. stocks steady; Cook’s dismissal, Nvidia earnings in spotlight

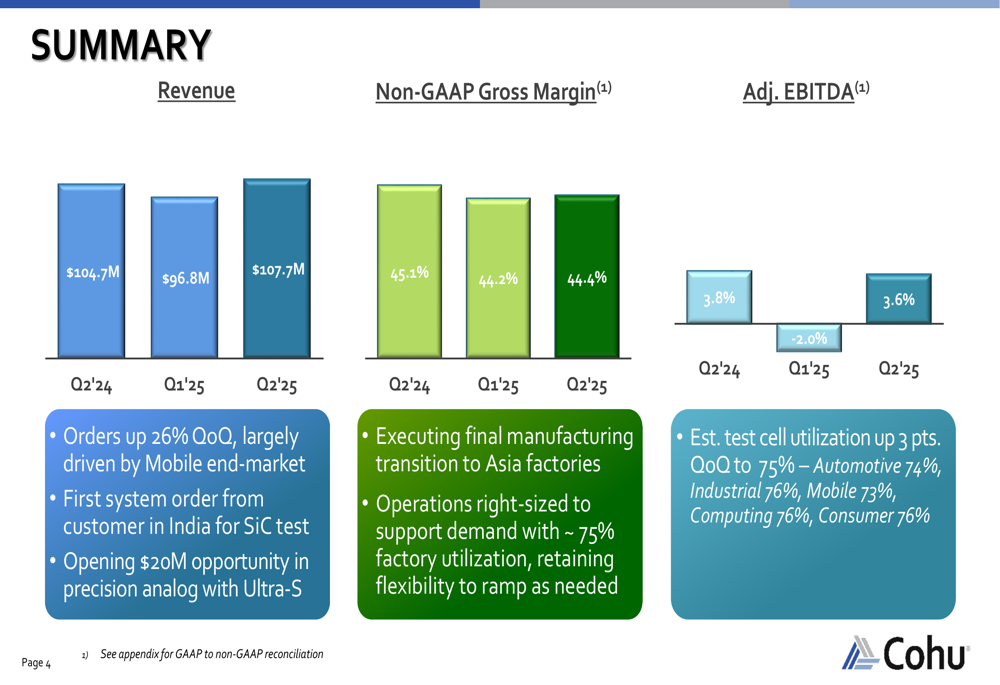
Cohu Inc. (NASDAQ:COHU), a global supplier of equipment and services for the semiconductor industry, reported its Q2 2025 financial results on July 31, 2025, showing a return to profitability after a challenging first quarter. The company posted revenue of $107.7 million, representing an 11% sequential increase from Q1 and a 2.9% year-over-year improvement.
Quarterly Performance Highlights
Cohu delivered non-GAAP earnings per share of $0.02 in Q2, rebounding from a loss of $0.02 in the previous quarter. The company’s adjusted EBITDA also recovered to 3.6% from -2.0% in Q1, though slightly below the 3.8% reported in the same quarter last year.
"We’ve seen a notable improvement in our financial performance this quarter, with orders up 26% sequentially, largely driven by the mobile end-market," commented Cohu’s management during the presentation.
The company’s test cell utilization increased by 3 percentage points quarter-over-quarter to 75%, with relatively consistent utilization across all segments: Automotive (74%), Industrial (76%), Mobile (73%), Computing (76%), and Consumer (76%).
As shown in the following financial results summary:
Detailed Financial Analysis
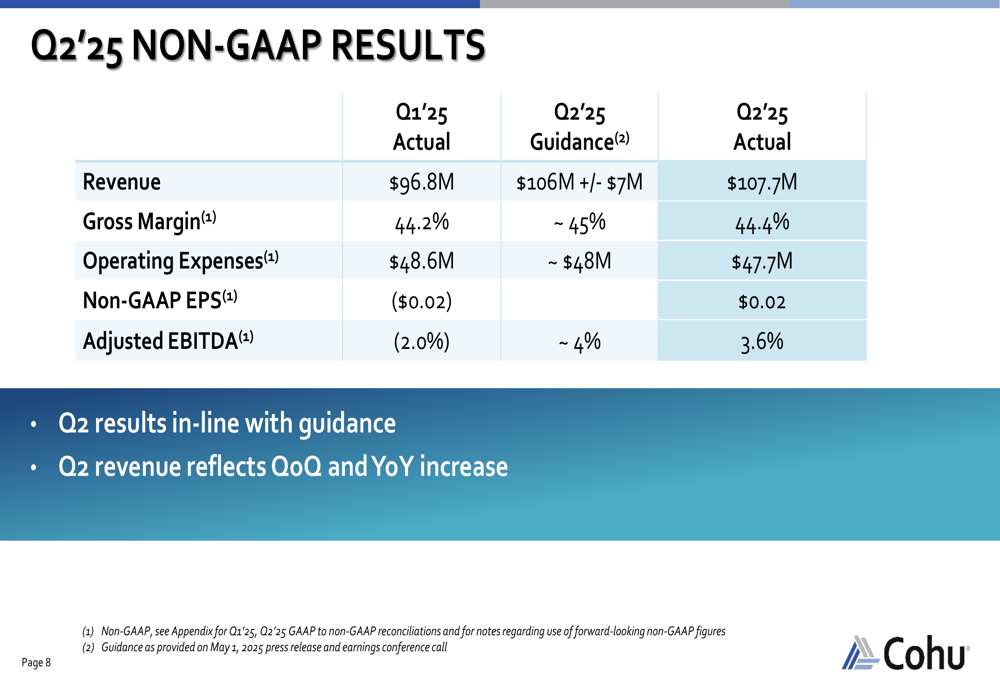
Cohu’s Q2 results were in line with the guidance provided after Q1, with revenue slightly exceeding the midpoint of the $106 million (±$7 million) range. The gross margin of 44.4% showed a slight improvement from Q1’s 44.2%, though it remained below the 45.1% achieved in Q2 2024.
Operating expenses were well-controlled at $47.7 million, below the guided ~$48 million and down from $48.6 million in Q1, reflecting the company’s ongoing restructuring efforts initiated in late Q1.
The detailed non-GAAP results demonstrate the company’s financial discipline:
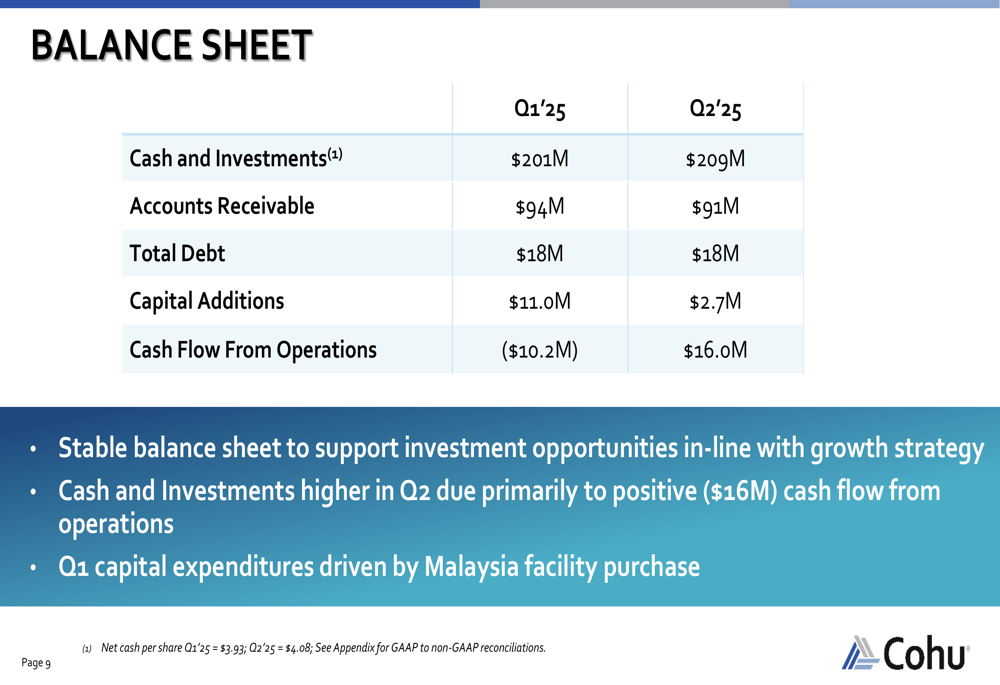
Cohu’s balance sheet strengthened during the quarter, with cash and investments increasing to $209 million from $201 million in Q1. The company generated $16 million in cash flow from operations, a significant improvement from the negative $10.2 million in the previous quarter. Capital additions were reduced to $2.7 million from $11 million in Q1, when the company purchased a facility in Malaysia.
The company’s net cash per share increased to $4.08 from $3.93 in Q1, providing a solid foundation for future investments and growth initiatives.
Strategic Initiatives
Cohu’s business model features a diverse revenue profile, with approximately 63% ($68 million) coming from recurring revenue and 37% ($40 million) from systems revenue. This balance provides stability while allowing for growth through new system sales.
The company highlighted several strategic wins during the quarter, including Q2 contactor design-wins with approximately $20 million per year opportunity funnel in precision analog test, and $3.5 million in new customer wins. Software (ETR:SOWGn) orders reached $360,000 with annual recurring revenue of $530,000.
The company’s revenue diversification across multiple sectors provides resilience against market fluctuations:
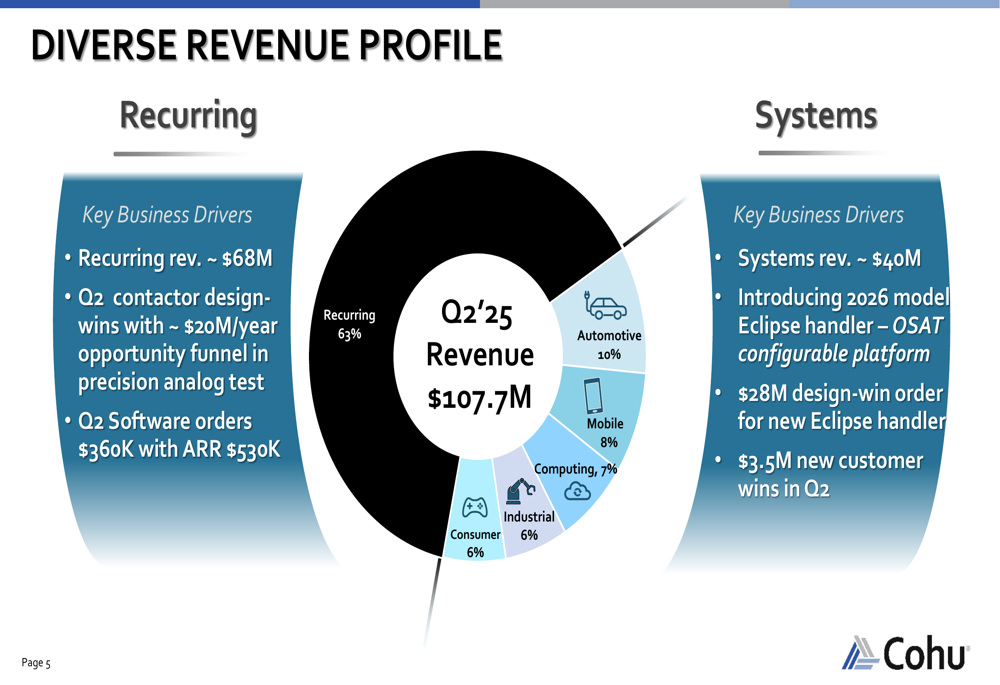
A key focus for Cohu is its Eclipse automated test handler platform, which addresses a $200 million market opportunity. The company secured a significant $28 million design-win order for the new Eclipse handler during the quarter.
The Eclipse platform offers field-upgradeable configurations from low to high power, quick swap capabilities for different applications, and energy-efficient operation. It’s positioned to serve fabless GPU and APU customers while supporting OSAT (Outsourced Semiconductor Assembly and Test) and test subcontractor needs.

Forward-Looking Statements
Looking ahead to Q3 2025, Cohu provided an optimistic outlook with expected revenue of $125 million (±$7 million), representing a projected 16% sequential increase from Q2. The company anticipates a gross margin of approximately 44% and adjusted EBITDA of around 7%, nearly double the 3.6% achieved in Q2.
Management attributed the projected growth to large orders for mobile and automotive test. The company noted that its gross margin reflects the mix of systems revenue, while recurring revenue remains strong. Importantly, Cohu reported no measurable cost impact from tariffs to date.
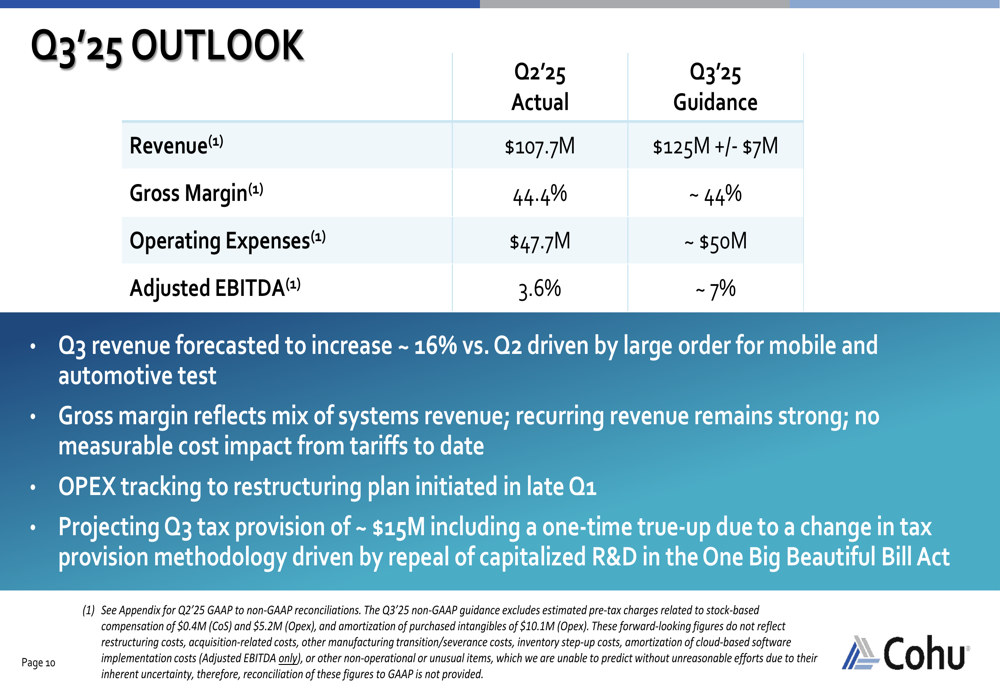
The company also disclosed a projected Q3 tax provision of approximately $15 million, including a one-time true-up due to a change in tax provision methodology driven by the repeal of capitalized R&D in the One Big Beautiful Bill Act.
Cohu’s management emphasized that operations have been right-sized to support current demand levels with approximately 75% factory utilization, while retaining flexibility to ramp as needed when market conditions improve further.
This return to profitability and sequential growth represents a positive development for Cohu after a challenging period. The stock closed at $18.98 on July 31, 2025, down 5.8% for the day, suggesting investors may have been expecting even stronger results or guidance despite the clear improvements shown in the presentation.
Full presentation:
This article was generated with the support of AI and reviewed by an editor. For more information see our T&C.