Bitcoin price today: falls to 2-week low below $113k ahead of Fed Jackson Hole

Introduction & Market Context
Comerica Inc . (NYSE:CMA) presented its second quarter 2025 financial results showing significant improvement over the previous quarter, with net income rising 16% and loan growth accelerating to 3%. The bank reported earnings per share of $1.42, a substantial improvement from the $1.25 reported in Q1 2025. Comerica’s stock closed at $62.42 on July 17, 2025, up 2.09% ahead of the presentation, reflecting positive market sentiment.
The results demonstrate Comerica’s ability to navigate the current economic environment while positioning itself for anticipated interest rate cuts. The bank highlighted its first-to-market status with RTP® On-Behalf-Of payment solutions and the deployment of an innovative deposit sweep solution as competitive advantages in the evolving financial services landscape.
Quarterly Performance Highlights
Comerica reported net income of $199 million for Q2 2025, representing a 16% increase, while pre-provision net revenue (PPNR) grew 18% to $288 million. The bank maintained a stable net interest income of $575 million, identical to the previous quarter, despite facing headwinds from BSBY cessation that negatively impacted NII by $5 million.
As shown in the following comprehensive financial overview, Comerica achieved an efficiency ratio of 65.78% while maintaining strong capital levels with a CET1 ratio of 11.94%, well above its strategic target:
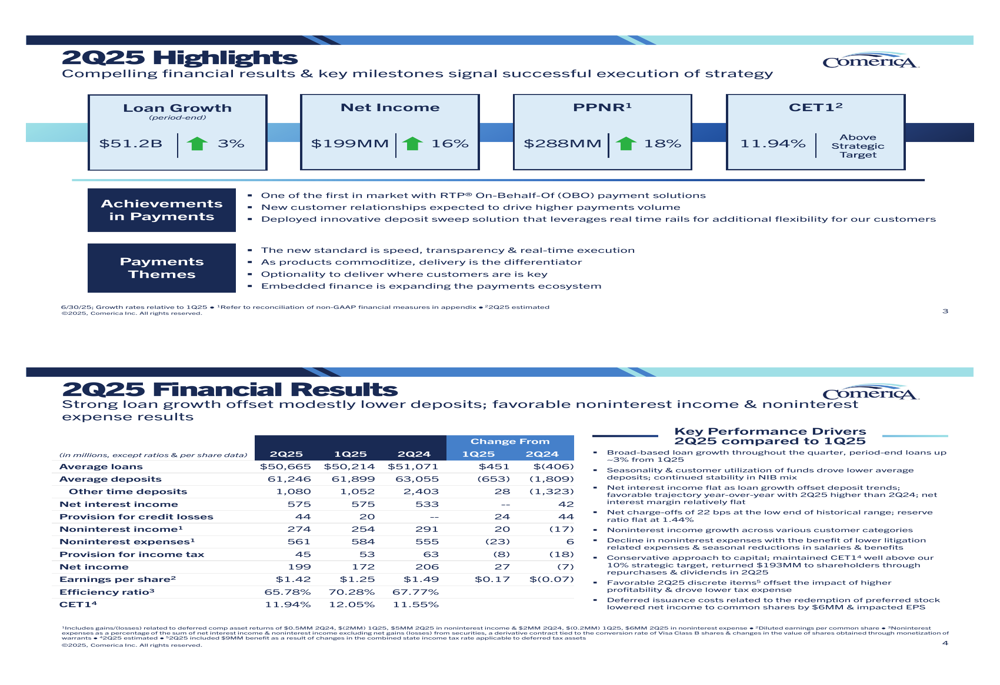
The bank’s earnings per share of $1.42 represents a significant improvement over the $1.25 reported in Q1 2025, demonstrating momentum in Comerica’s core business operations. Capital returns to shareholders reached $193 million during the quarter, underscoring the bank’s commitment to delivering shareholder value.
Loan and Deposit Trends
Comerica reported consistent, broad-based loan growth throughout the quarter, with average loans increasing by $0.5 billion to $50.7 billion. Growth was particularly strong in Corporate Banking, Wealth Management, Environmental Services, Entertainment Lending, General Middle Market, and Equity Fund Services. The bank noted improved customer sentiment and maintained a strong loan pipeline with stable commitment utilization at approximately 50%.
The following chart illustrates the bank’s loan and deposit performance during the quarter:
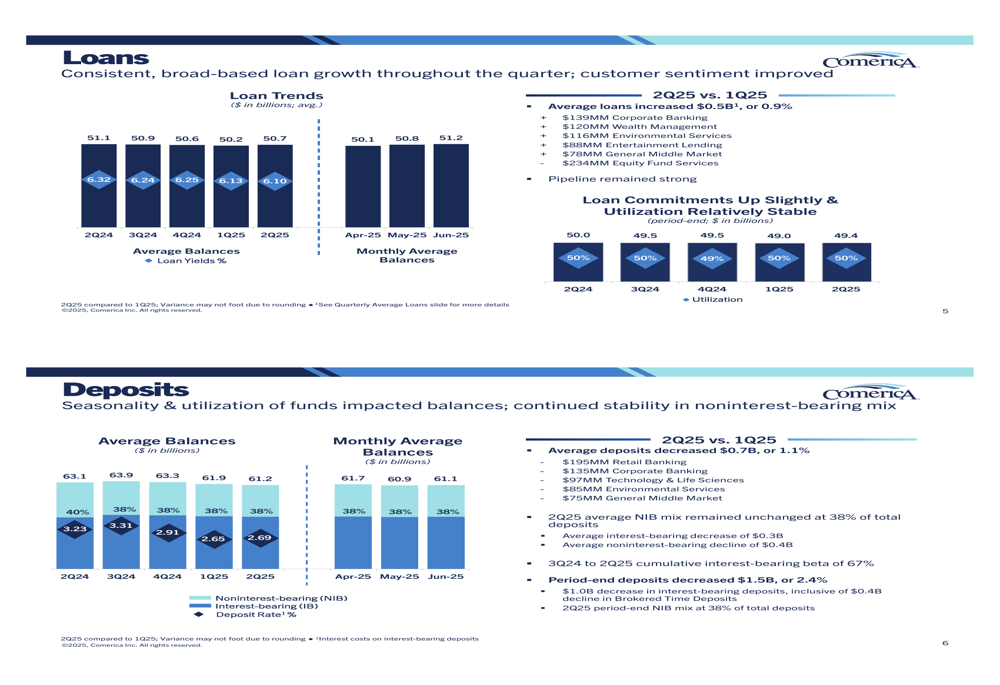
On the deposit front, Comerica faced some challenges as average deposits decreased by $0.7 billion, with period-end deposits down $1.5 billion or 2.4%. However, the bank maintained a stable noninterest-bearing deposit mix at 38%, an important metric for controlling funding costs. Management attributed the deposit decline to normal seasonality and customers’ utilization of funds.
Net Interest Income and Securities Portfolio
Comerica’s net interest income remained stable at $575 million quarter-over-quarter, with the net interest margin slightly decreasing from 3.18% to 3.16%. Favorable loan trends were offset by deposit trends and funding mix changes. The BSBY cessation resulted in a $5 million negative impact to net interest income and a 3 basis point reduction to NIM, though this was partially offset by other rate-related benefits.
The following chart details the securities portfolio and net interest income performance:
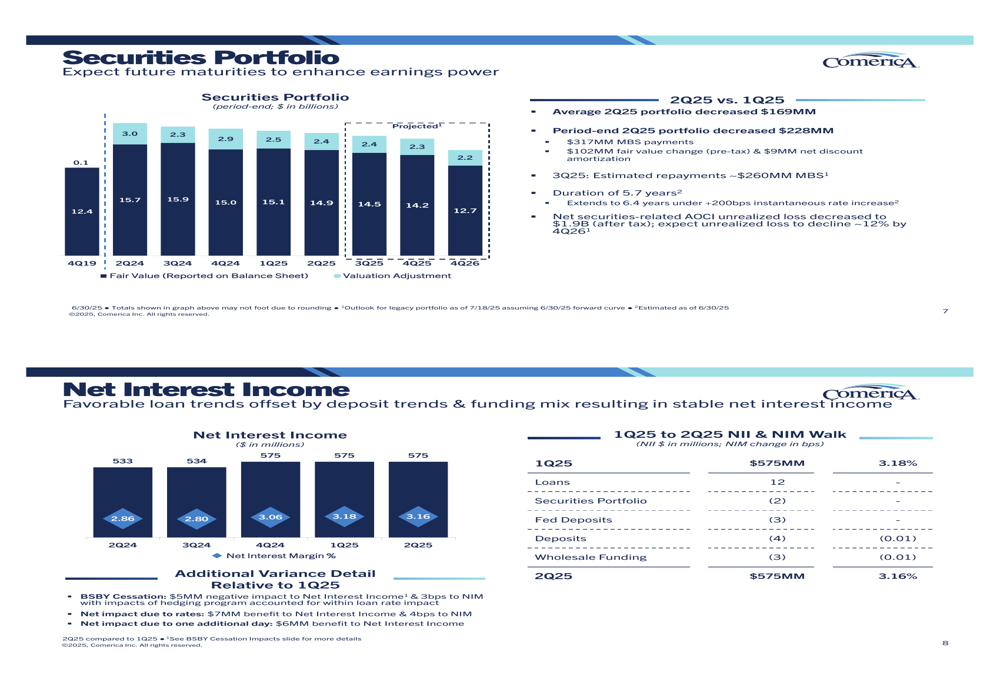
The securities portfolio decreased by $169 million on average during the quarter, with management noting that expected future maturities should enhance earnings power. The bank is strategically managing its securities portfolio to optimize returns in the current interest rate environment.
Credit Quality and Risk Management
Credit quality remained a strength for Comerica in Q2 2025, with net charge-offs at the low end of the normal range at 0.21%, slightly improved from 0.22% in the previous quarter. The allowance for credit losses as a percentage of loans remained flat at 1.44%, reflecting the bank’s conservative approach to risk management.
The following chart highlights Comerica’s credit quality metrics:
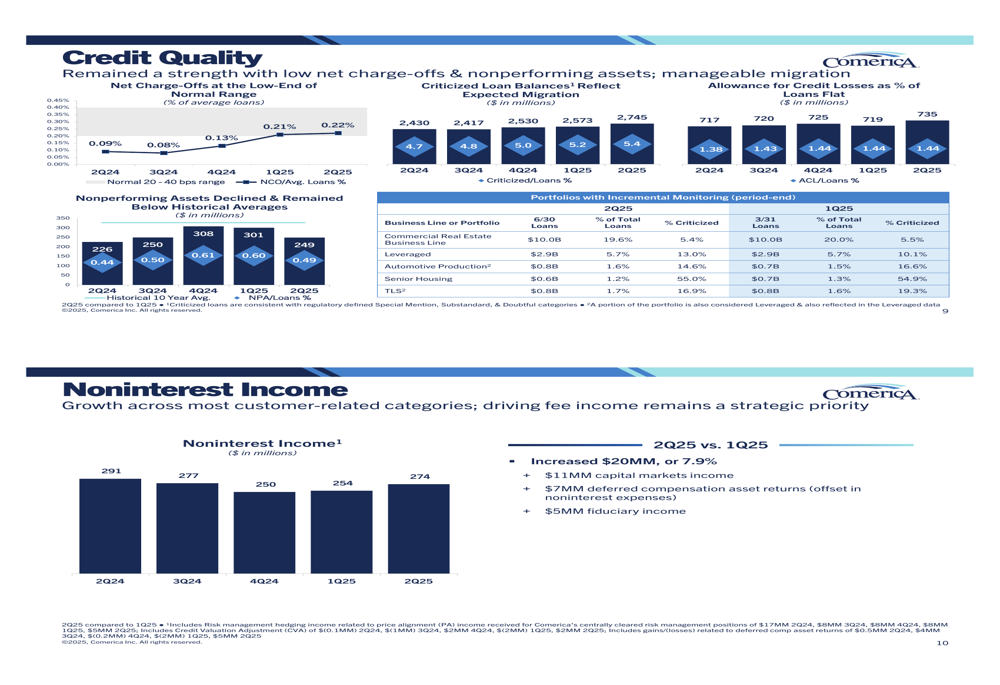
The bank identified several portfolios for incremental monitoring, including Commercial Real Estate, Leveraged loans, Automotive Production, Senior Housing (NASDAQ:DHC), and TLS. Despite these areas of focus, overall credit performance remained strong, with manageable migration in criticized loans.
Noninterest Income and Expense Management
Comerica demonstrated strong performance in fee income generation, with noninterest income increasing by $20 million or 7.9% during the quarter. Key drivers included an $11 million increase in capital markets income, $7 million in deferred compensation asset returns, and $5 million growth in fiduciary income.
Simultaneously, the bank effectively controlled expenses, with noninterest expenses decreasing by $23 million or 3.9%. This reduction was primarily driven by a $15 million decrease in litigation-related expenses and a $10 million reduction in salaries and benefits expenses due to seasonality.
The following chart details the noninterest income and expense trends:
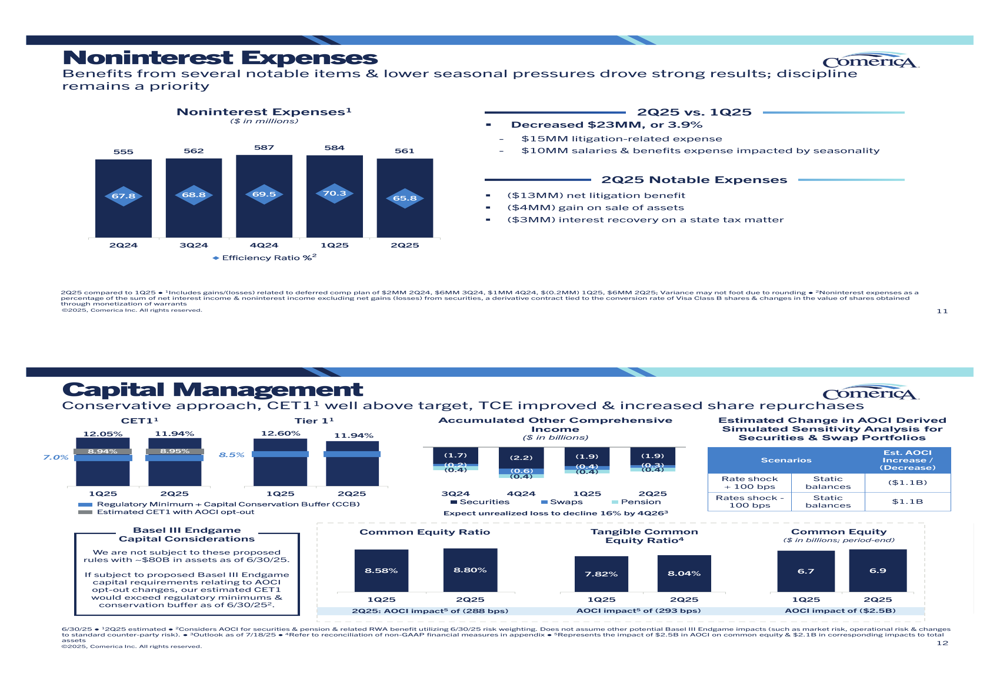
Notable expense items included a $13 million net litigation benefit, a $4 million gain on sale of assets, and a $3 million interest recovery on a state tax matter, all contributing to the overall expense reduction.
Capital Position and Shareholder Returns
Comerica maintained a conservative capital management approach, with its CET1 ratio at 11.94%, well above the target. The bank improved its tangible common equity (TCE) ratio and increased share repurchases during the quarter, demonstrating confidence in its financial position.
The following chart illustrates Comerica’s capital position:
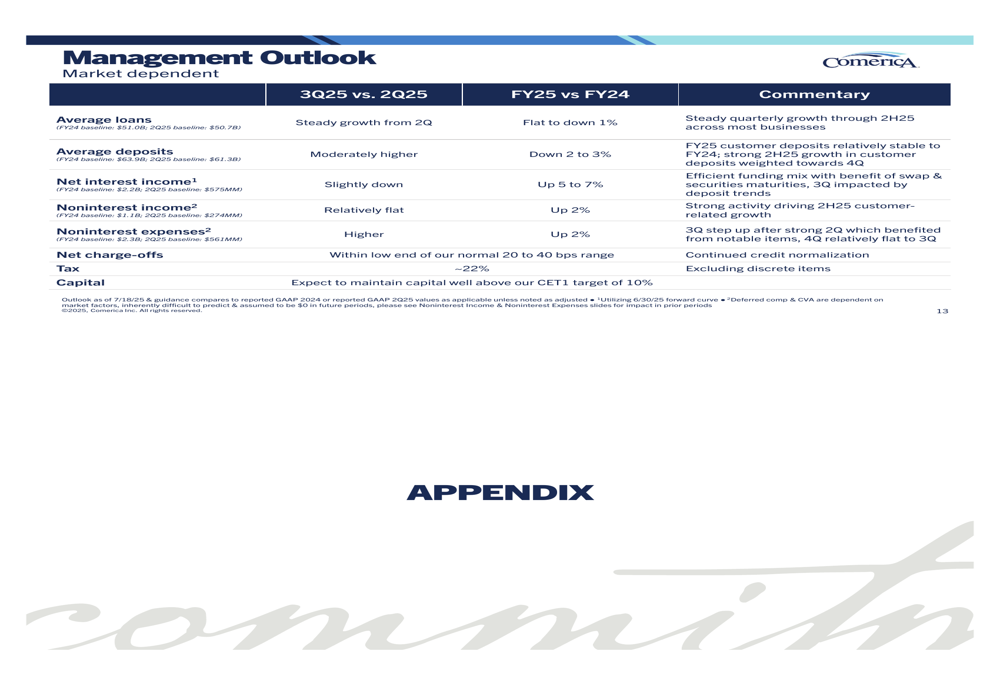
Capital returns to shareholders totaled $193 million during the quarter, reflecting the bank’s commitment to delivering value while maintaining strong capital levels. The common equity ratio improved from 8.58% in Q1 2025 to 8.80% in Q2 2025.
Forward Outlook and Rate Sensitivity
Looking ahead, Comerica appears well-positioned for an environment of declining interest rates. The bank’s interest rate sensitivity analysis indicates a potential $18 million increase in net interest income with a 100 basis point gradual decrease in rates, and a $41 million increase with a 100 basis point gradual decrease and 60% incremental beta.
The following chart shows Comerica’s interest rate sensitivity and liquidity position:
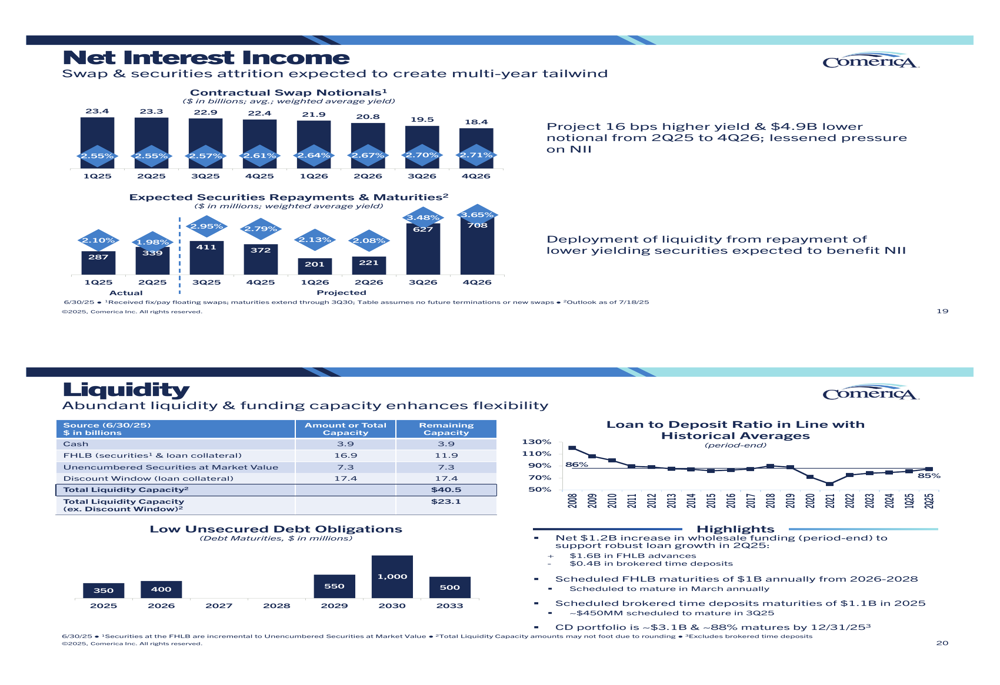
Management highlighted the bank’s abundant liquidity and funding capacity, with total liquidity capacity of $40.5 billion, enhancing flexibility in various market conditions. This strong liquidity position, combined with favorable interest rate sensitivity, suggests Comerica is well-prepared for anticipated changes in the interest rate environment.
In its management outlook, the bank provided guidance for the remainder of 2025, projecting continued loan growth, stable deposits, and ongoing focus on expense management. The majority of losses related to BSBY cessation are expected to accrete back in 2025 and 2026, potentially providing a tailwind to future earnings.
Full presentation:
This article was generated with the support of AI and reviewed by an editor. For more information see our T&C.