Japan PPI inflation slips to 11-mth low in July

Introduction & Market Context
COPT Defense Properties (NYSE:CDP) released its first quarter 2025 earnings presentation on April 28, highlighting solid financial performance and continued growth driven by its specialized defense-focused real estate portfolio. The company reported funds from operations per share (FFOPS) of $0.65, representing a 4.8% year-over-year increase and meeting the midpoint of its guidance.
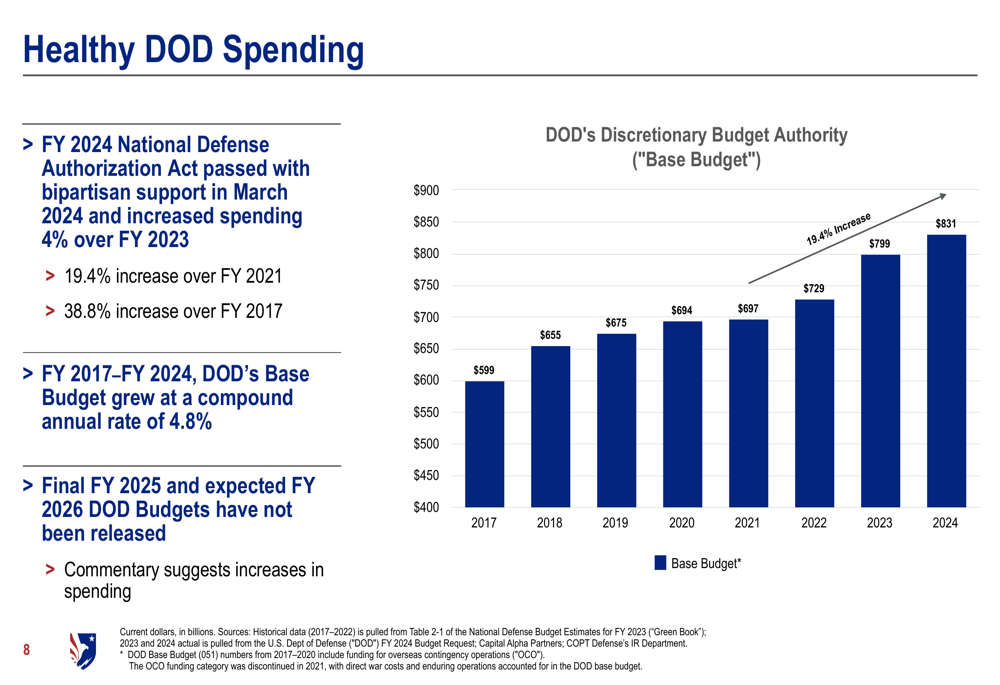
The results come amid continued strong Department of Defense (DOD) spending, which has grown at a compound annual rate of 4.8% from fiscal year 2017 to 2024. This favorable budget environment continues to support demand for COPT’s specialized defense and IT facilities.
As shown in the following chart of DOD budget growth, defense spending has increased by 38.8% since FY 2017, providing a solid foundation for COPT’s business model:
Quarterly Performance Highlights
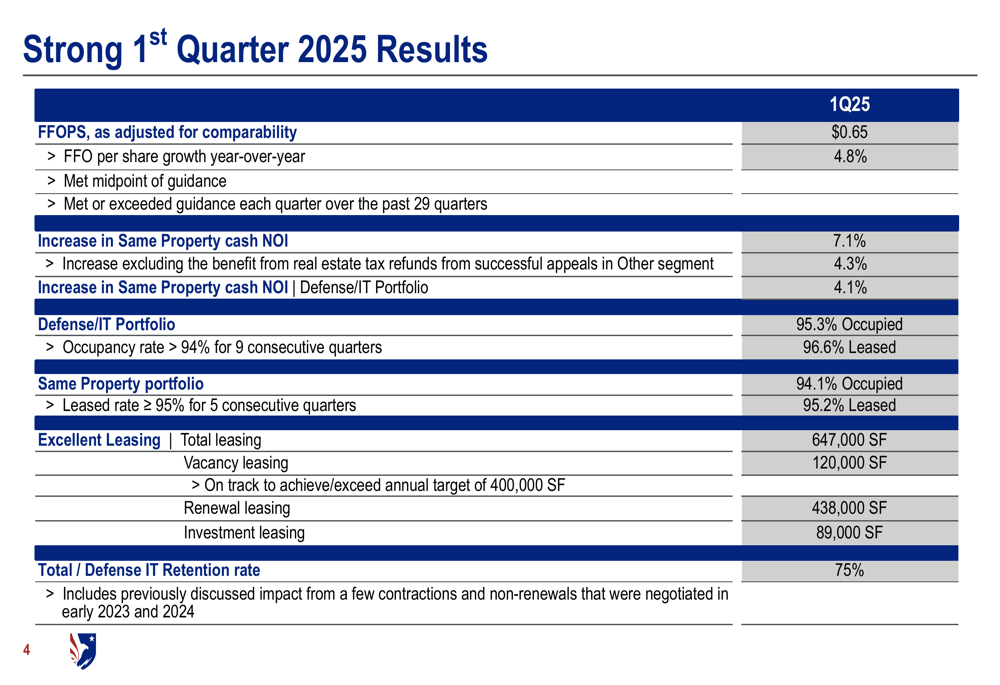
COPT Defense Properties delivered strong operational results in the first quarter of 2025, with same-property cash NOI increasing by 7.1% (4.3% excluding benefits). The company’s Defense/IT Portfolio maintained high occupancy at 95.3% and leased rates of 96.6%, demonstrating the resilience of its specialized real estate assets.
The quarter saw robust leasing activity with 647,000 square feet of total leasing, including 120,000 square feet of vacancy leasing and 438,000 square feet of renewal leasing. The company reported a total retention rate of 75%, which was impacted by previously discussed contractions and non-renewals negotiated in early 2023 and 2024.
The following table summarizes COPT’s Q1 2025 performance metrics:
Strategic Positioning and Growth Drivers
COPT Defense Properties continues to benefit from its strategic focus on defense and IT-related tenants. The company has positioned itself as the only public REIT specializing in secured, specialized space for credentialed personnel, with 90% of its annualized rental revenues coming from its Defense/IT Portfolio.
Vacancy leasing tied to DOD cyber activity has been a significant growth driver, representing an average of 33% of vacancy leasing over the past five years. This trend continued in Q1 2025, reflecting the ongoing expansion of DOD cyber funding.
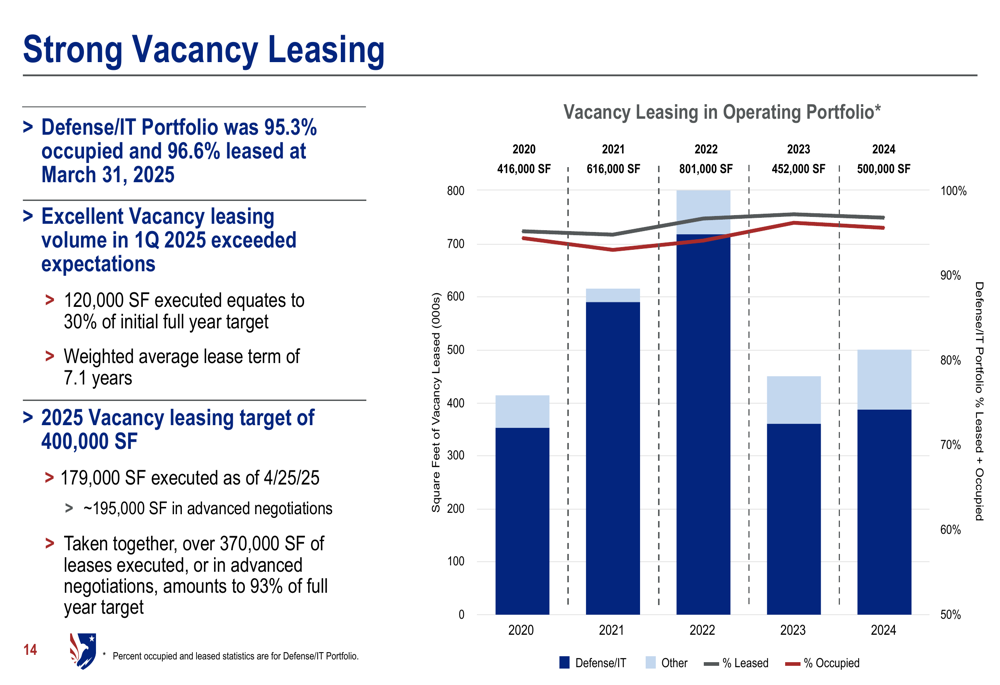
The company’s strong vacancy leasing performance in Q1 2025 exceeded expectations, with 120,000 square feet executed (30% of the initial full-year target). As of April 25, 2025, COPT had executed 179,000 square feet of vacancy leasing and had approximately 195,000 square feet in advanced negotiations, amounting to 93% of its full-year target of 400,000 square feet.
The following chart illustrates the company’s strong vacancy leasing performance:
Another key strength for COPT is its sector-leading tenant retention, which has averaged 79% over the past five years (2020-2024), more than double the average for office REITs that report this metric. This high retention rate is driven by the company’s unique and advantaged locations, significant tenant co-investment, long-term tenant relationships, and operating platform with credentialed personnel.
Financial Outlook and Guidance
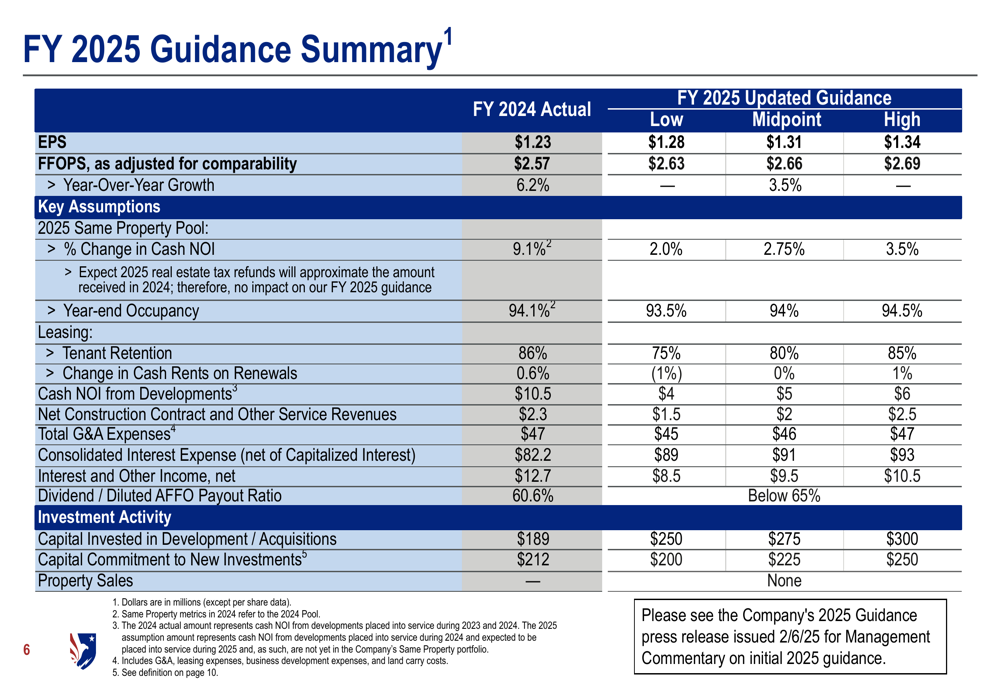
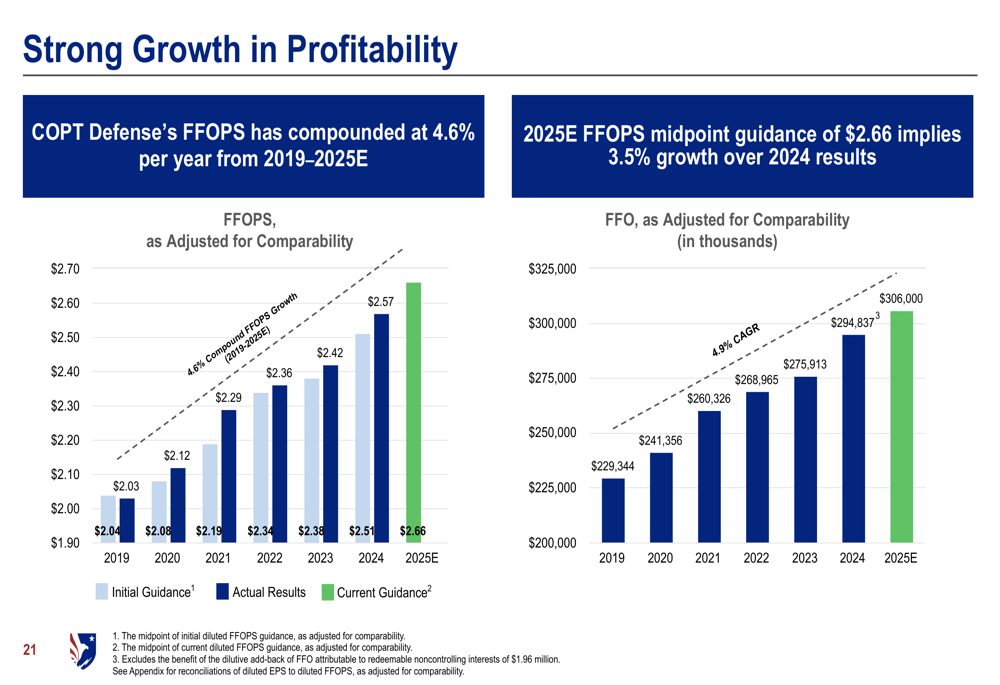
COPT Defense Properties updated its full-year 2025 guidance, projecting FFOPS of $2.63-$2.69 (midpoint $2.66), representing 3.5% year-over-year growth. The company expects same-property cash NOI growth of 2.0-3.5% and year-end occupancy of 93.5-94.5%.
The following table details the company’s updated 2025 guidance:
The company has demonstrated consistent growth in profitability, with FFOPS compounding at 4.6% annually from 2019 to 2025 (estimated). Management expressed confidence in continued growth through 2026, supported by strong leasing demand, active developments, and a robust development leasing pipeline.
As shown in the following charts of FFOPS and FFO growth:
Balance Sheet and Capital Allocation
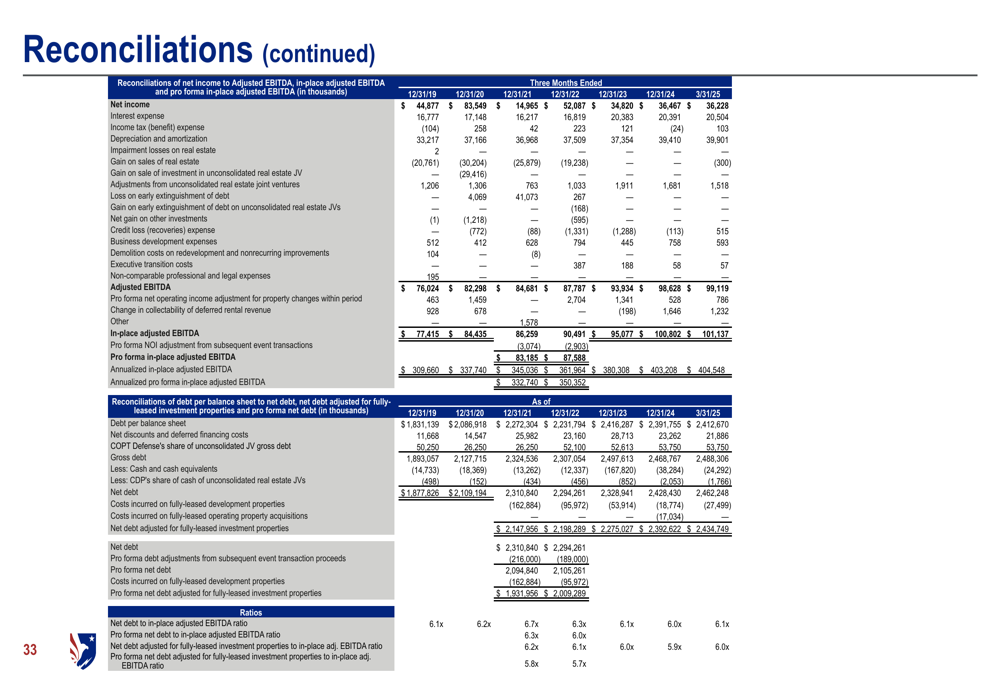
COPT Defense Properties maintains a strong balance sheet with well-staggered debt maturities, providing stability and flexibility for future growth. As of March 31, 2025, 98% of the company’s consolidated debt was fixed rate, including the effect of interest rate swaps, and secured debt accounted for only 3% of debt outstanding.
The company highlighted its ability to self-fund $250-$275 million of development/acquisition investment annually on a leverage-neutral basis, without requiring outside equity. This financial strength positions COPT to continue executing its growth strategy through strategic investments in defense-related properties.
The following reconciliation provides detailed insight into the company’s financial position:
COPT has $308 million of active developments (756,000 square feet) that are 62% leased, along with a development leasing pipeline of approximately 1.2 million square feet and potential opportunities of around 1.5 million square feet. In Q1 2025, the company committed capital to one new project, 8500 Advanced Gateway, at $52.0 million.
Looking ahead, COPT expects to maintain its growth trajectory, with management projecting that FFO per share will grow at a compound rate of 4% from 2023 through 2026, driven by strong leasing demand, development activities, and continued growth in defense budgets.
Full presentation:
This article was generated with the support of AI and reviewed by an editor. For more information see our T&C.