Eos Energy stock falls after Fuzzy Panda issues short report

Introduction & Market Context
Crane Co (NYSE:CR) released its third-quarter 2025 earnings presentation on October 28, revealing strong performance that exceeded expectations despite a revenue miss. The industrial manufacturer’s stock jumped 4.01% in premarket trading to $198.90, approaching its 52-week high of $203.89, as investors responded positively to the company’s results and raised guidance.
The company reported adjusted earnings per share of $1.64, significantly outperforming analyst expectations of $1.43 – a 14.69% surprise. This strong bottom-line performance came despite revenue of $589.2 million falling short of the forecasted $608.47 million.
Quarterly Performance Highlights
Crane delivered impressive year-over-year growth across key financial metrics in Q3 2025. Sales increased 7.5% to $589.2 million, driven by core growth of 5.6%, acquisition contribution of 0.9%, and favorable foreign exchange impact of 1.0%.
As shown in the following comprehensive quarterly results:
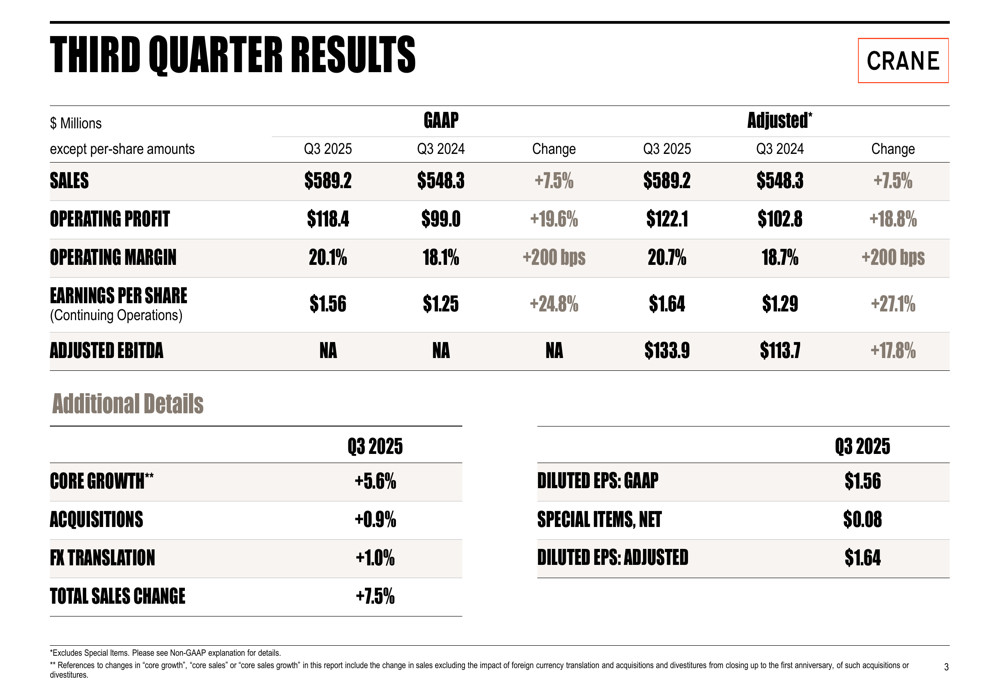
Adjusted operating profit rose 18.8% to $122.1 million, with adjusted operating margin expanding 200 basis points to 20.7%. This margin expansion demonstrates Crane’s ability to effectively manage costs and improve operational efficiency. Adjusted EBITDA increased 17.8% to $133.9 million compared to the same period last year.
The 27.1% increase in adjusted earnings per share to $1.64 represents accelerating momentum for the company, which has been focusing on its core growth initiatives and strategic acquisitions.
Segment Analysis
Crane’s Aerospace & Electronics segment emerged as the standout performer, with sales increasing 13.0% to $270.2 million. The segment’s operating profit jumped 20.2% to $67.7 million on an adjusted basis, with margins expanding 160 basis points to 25.1%.
The segment’s performance details reveal strong demand in both original equipment and aftermarket sales:
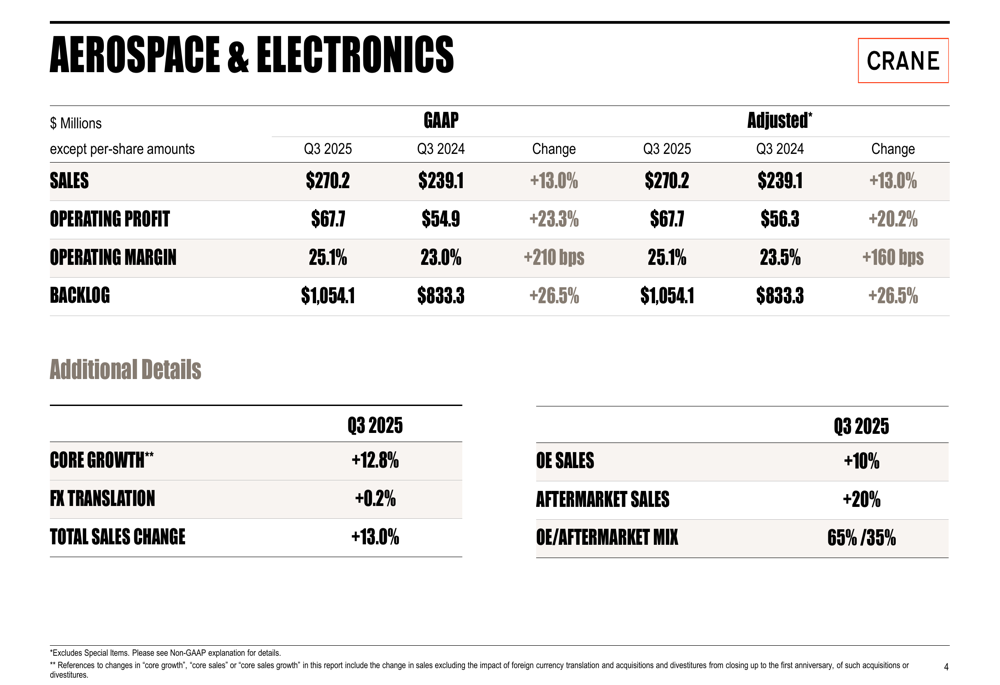
Particularly impressive was the 26.5% increase in backlog to over $1 billion ($1,054.1 million), indicating robust future demand. The segment benefited from a favorable mix with aftermarket sales growing 20% and now representing 35% of the segment’s revenue.
The Process Flow Technologies segment delivered more modest growth, with sales increasing 3.2% to $319.0 million and adjusted operating profit rising 6.2% to $71.5 million. Operating margin expanded 60 basis points to 22.4%.
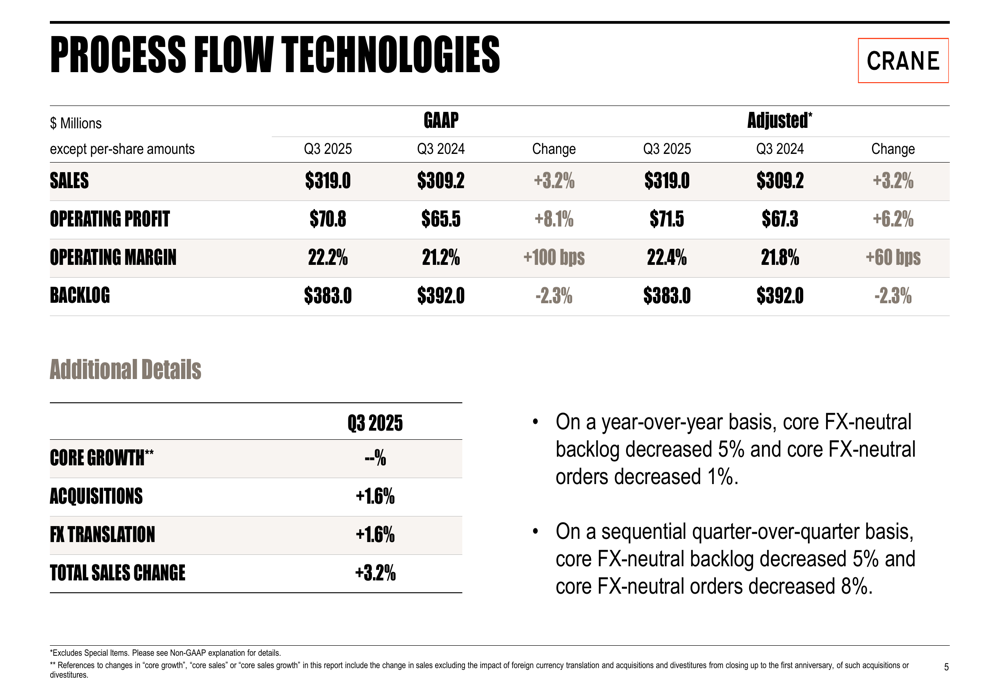
While the segment’s backlog decreased 2.3% year-over-year to $383.0 million, the margin improvement demonstrates Crane’s operational efficiency initiatives are yielding results even in a more challenging market environment.
Strategic Initiatives & Capital Position
Crane maintains an exceptionally strong financial position with approximately $2,188 million in liquidity and zero debt. This capital optionality provides significant flexibility for strategic investments and acquisitions.
The company’s financial strength is illustrated in the following capital structure overview:
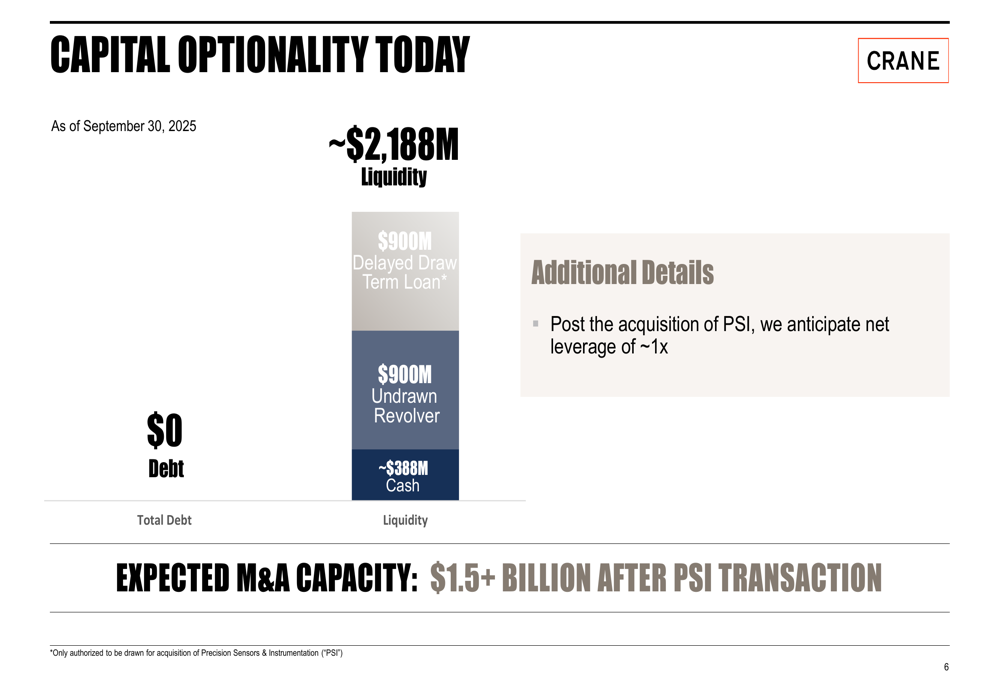
A key component of Crane’s growth strategy is the pending acquisition of Precision Sensors & Instrumentation (PSI), which is expected to enhance the company’s product portfolio and market reach. Following this acquisition, Crane anticipates maintaining a conservative net leverage ratio of approximately 1x while still retaining over $1.5 billion in M&A capacity for future opportunities.
The company’s long-term strategy focuses on four key pillars that are driving its momentum:
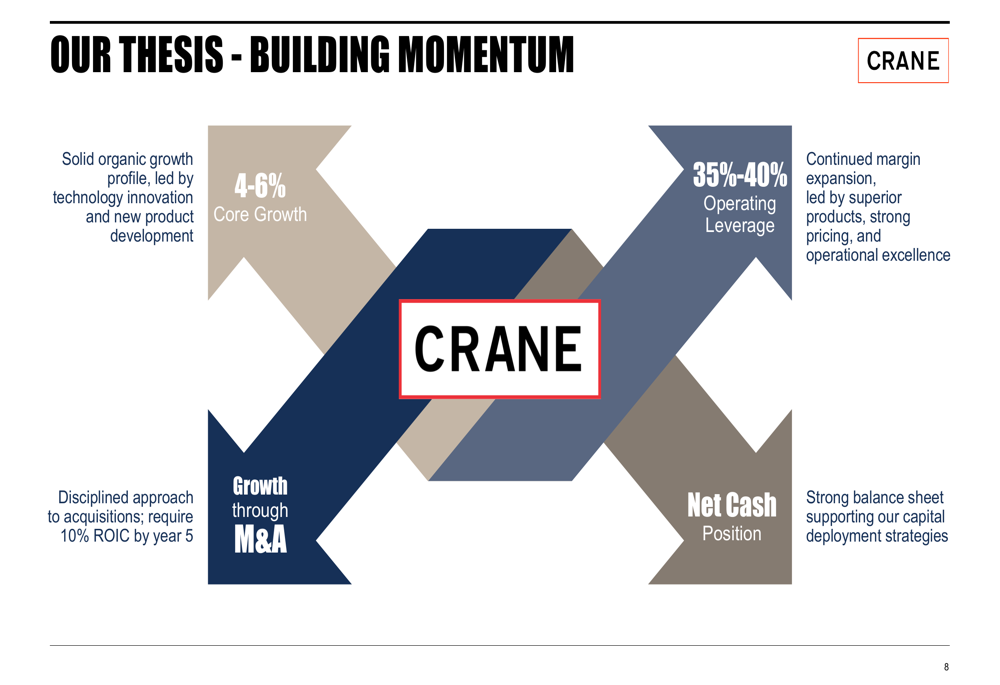
This balanced approach combines organic growth through innovation and new product development with disciplined acquisitions, margin expansion through operational excellence, and maintaining financial strength to support strategic initiatives.
Forward-Looking Statements & Guidance
Based on strong year-to-date performance, Crane has raised its full-year 2025 guidance across key metrics. The company now expects revenue between $2,285-$2,300 million, up from previous guidance of $2,250-$2,290 million.
The detailed guidance update shows improvements across multiple financial metrics:
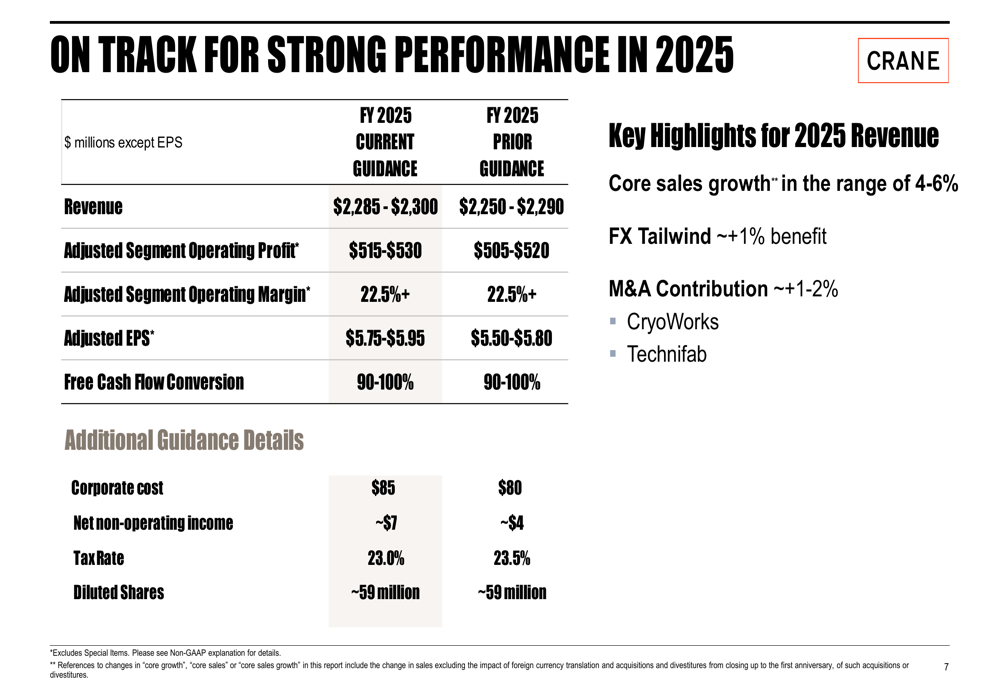
Adjusted EPS guidance has been raised to $5.75-$5.95, compared to the previous range of $5.50-$5.80. The company expects core sales growth of 4-6%, with additional contributions from foreign exchange (approximately 1%) and acquisitions (approximately 1-2%).
During the earnings call, CEO Max Mitchell expressed confidence in the company’s trajectory, stating, "We are proud to report another strong quarter with results coming in ahead of our expectations." Management also highlighted potential challenges, including approximately $30 million in tariff cost increases for the year, which the company appears to be managing effectively given the raised guidance.
Looking ahead, Crane expects continued strength in its Aerospace & Electronics markets, with projected growth of 7-9% in 2026, while maintaining its focus on margin expansion and strategic acquisitions to drive long-term shareholder value.
Full presentation:
This article was generated with the support of AI and reviewed by an editor. For more information see our T&C.