Asia FX cautious amid US govt shutdown; yen tumbles after Takaichi’s LDP win

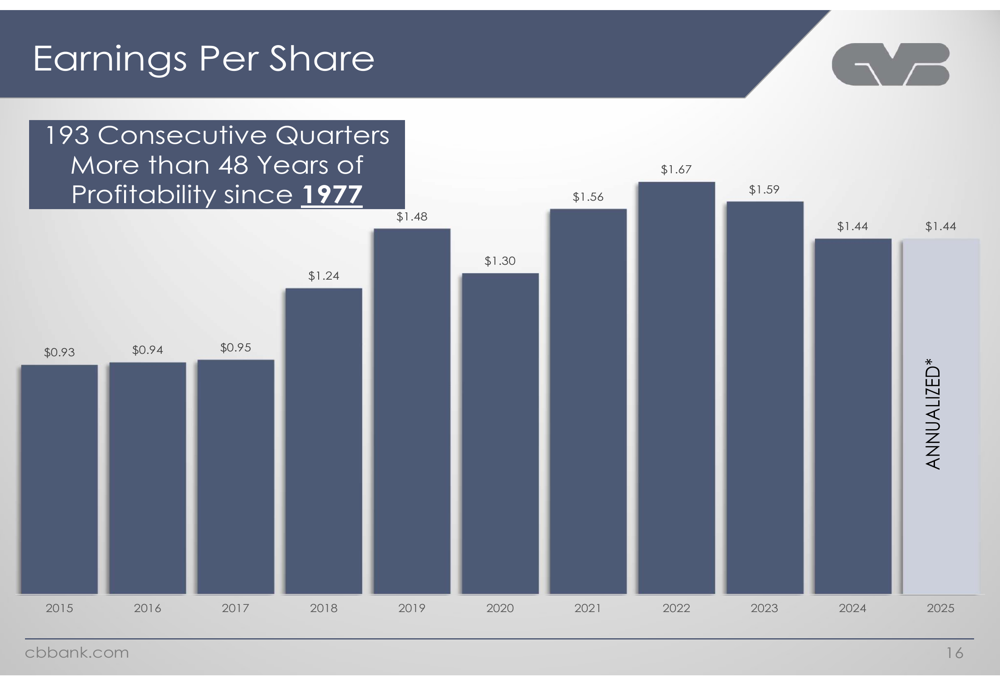
CVB Financial Corp . (NASDAQ:CVBF), the largest financial institution headquartered in California’s Inland Empire region, presented its Q2 2025 financial results in July, highlighting its remarkable streak of 193 consecutive quarters of profitability—a run spanning more than 48 years. With $15.4 billion in total assets, the bank continues to demonstrate resilience through consistent performance and superior capital metrics compared to industry benchmarks.
Quarterly Performance Highlights
CVB Financial reported net income of $51 million for Q2 2025, translating to earnings per share (EPS) of $0.36, which matched its Q1 2025 performance and exceeded analysts’ expectations. The bank achieved a return on average tangible common equity (ROATCE) of 14.08% and return on average assets (ROAA) of 1.34%, showing slight decreases from the previous quarter’s 14.51% and 1.37% respectively.
As shown in the following chart of quarterly financial highlights, the bank maintained a strong efficiency ratio of 45.6% and saw its deposits increase by $123 million during the quarter:
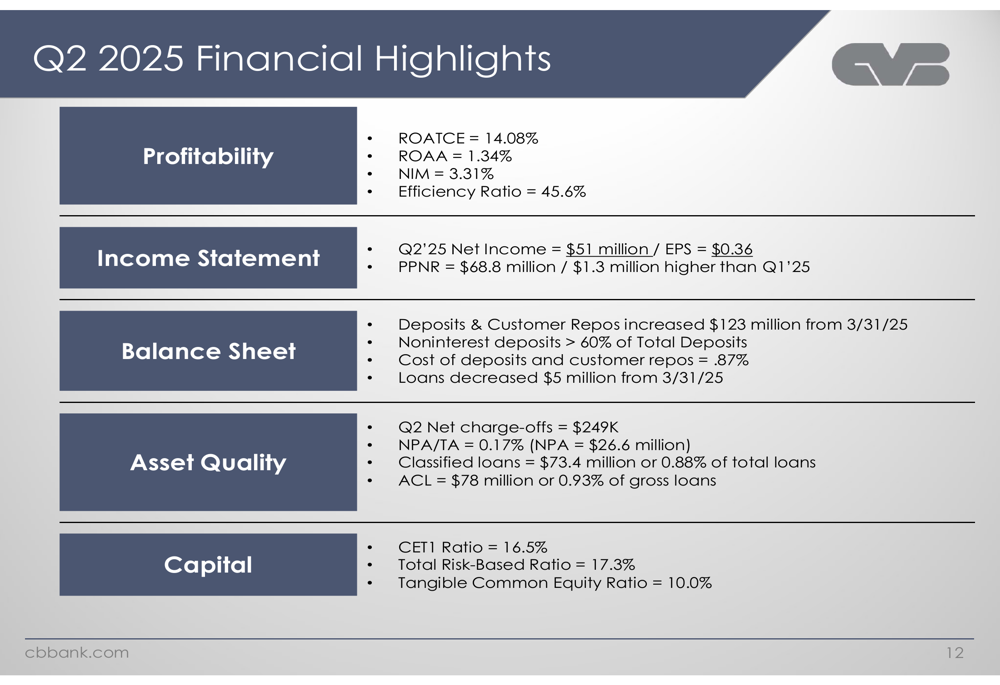
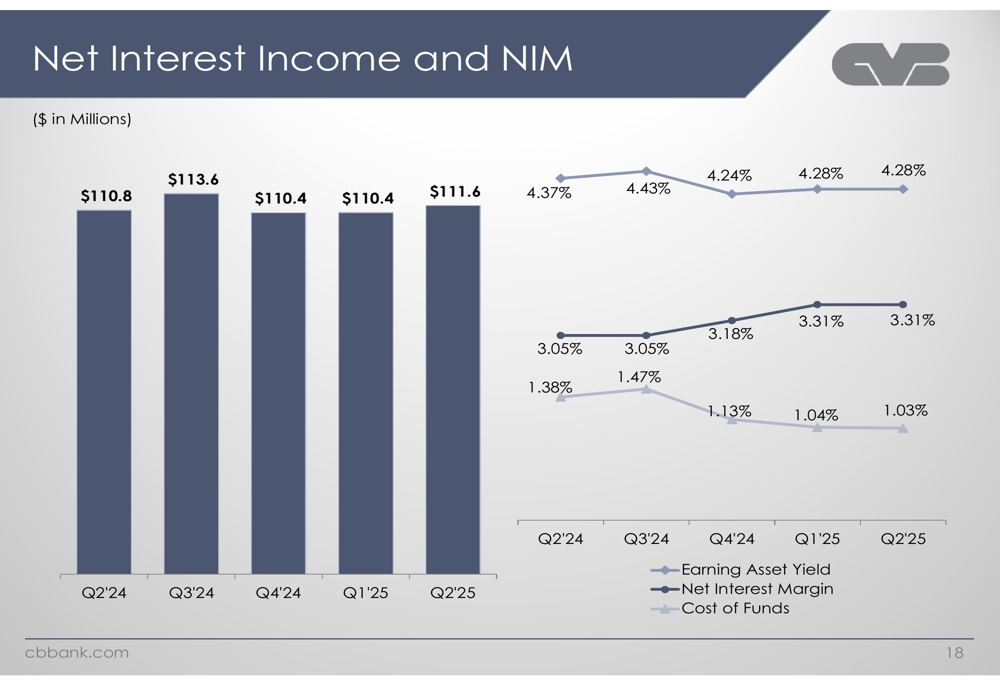
The bank’s net interest margin (NIM) remained stable at 3.31% in Q2 2025, unchanged from the previous quarter. This stability is particularly noteworthy given the challenging interest rate environment that many regional banks have faced.
As illustrated in the following charts showing net interest income and margin trends, CVB Financial has maintained its earning asset yield at 4.28% while keeping its cost of funds at 1.03%:
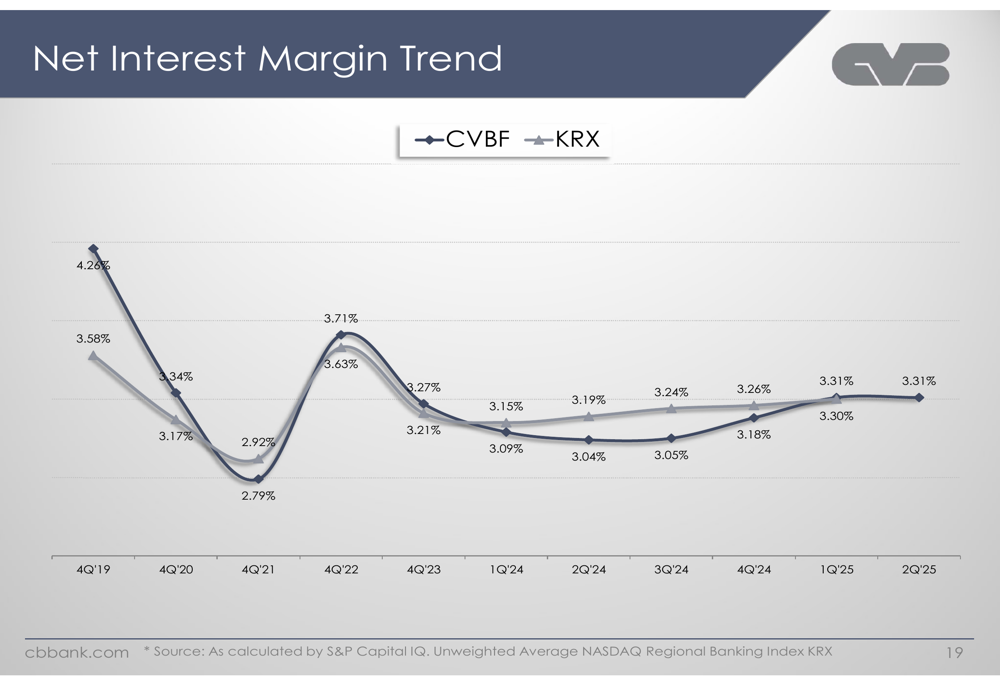
When compared to industry benchmarks, CVB Financial’s net interest margin has consistently outperformed the KRX index of regional banks, as shown in this comparative trend chart:
Capital Position and Asset Quality
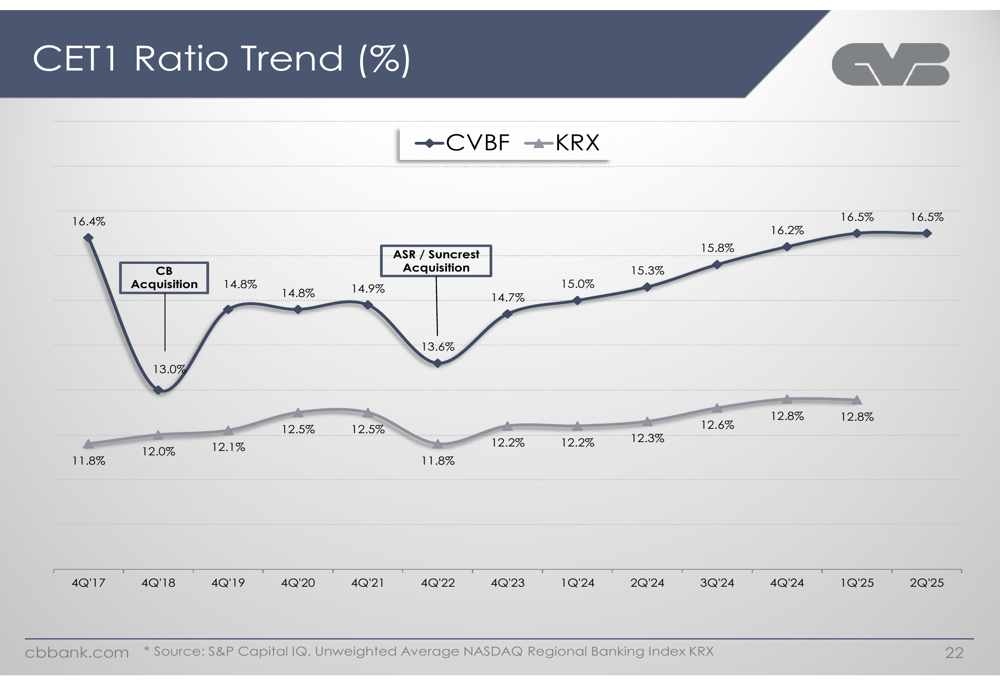
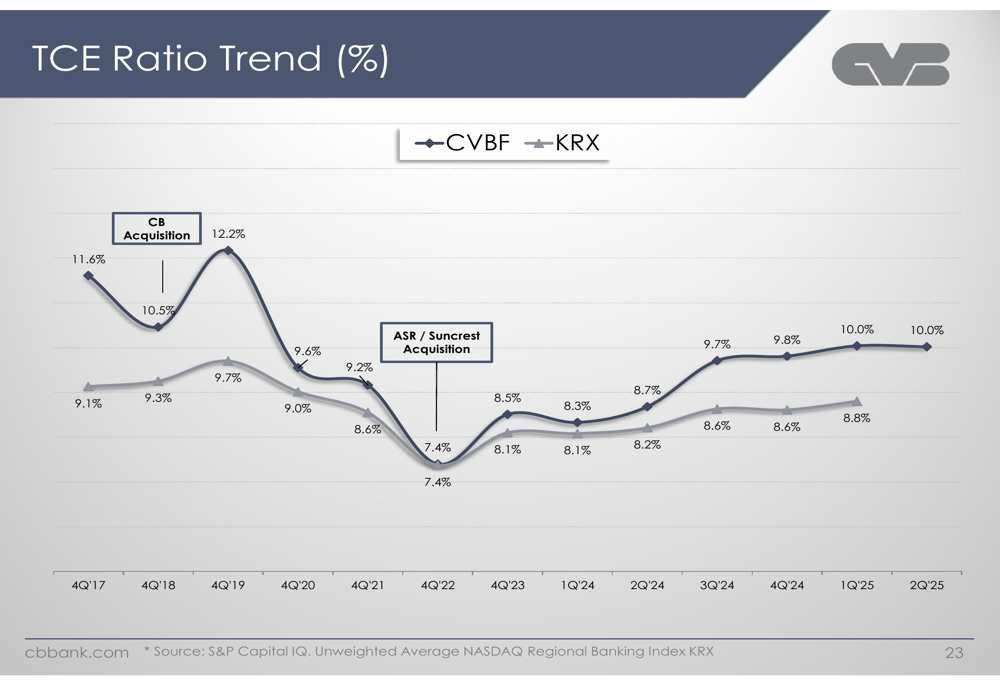
One of CVB Financial’s key strengths is its robust capital position. The bank reported a Common Equity Tier 1 (CET1) ratio of 16.5% and a Tangible Common Equity (TCE) ratio of 10.0% as of Q2 2025, both significantly higher than regulatory requirements and industry averages.
The following chart illustrates CVB Financial’s CET1 ratio compared to the KRX index, demonstrating the bank’s superior capital position over time:
Similarly, the bank’s TCE ratio has consistently outperformed the industry benchmark:
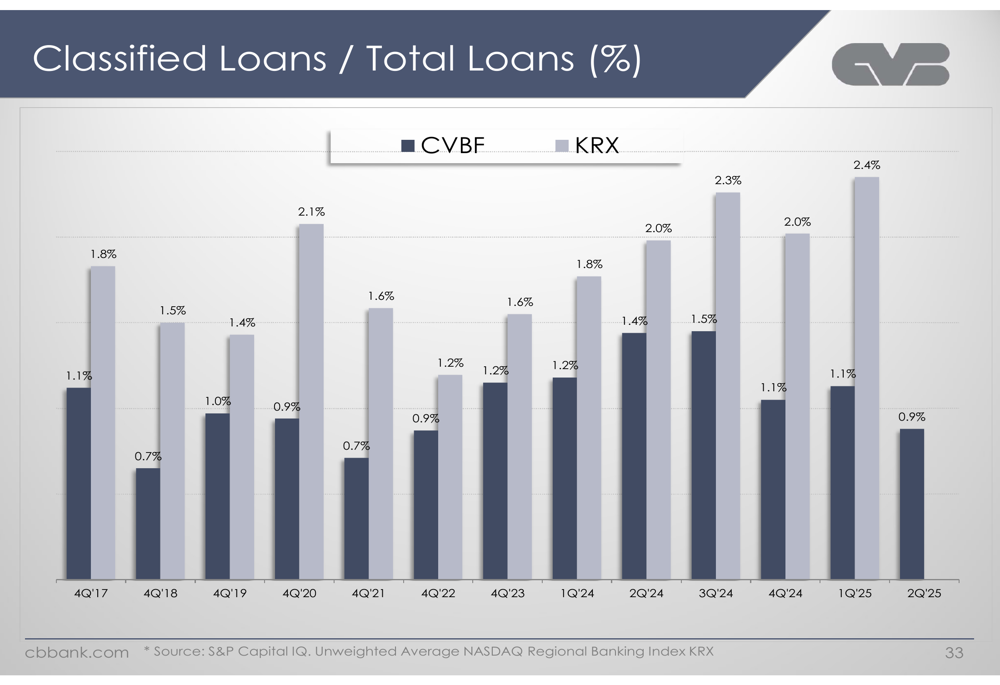
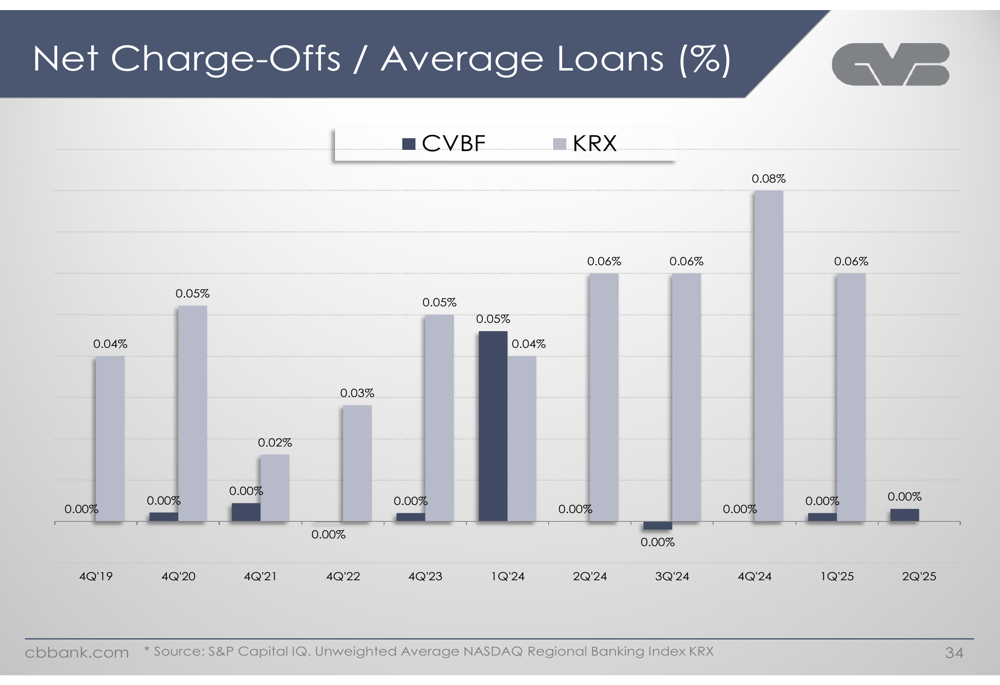
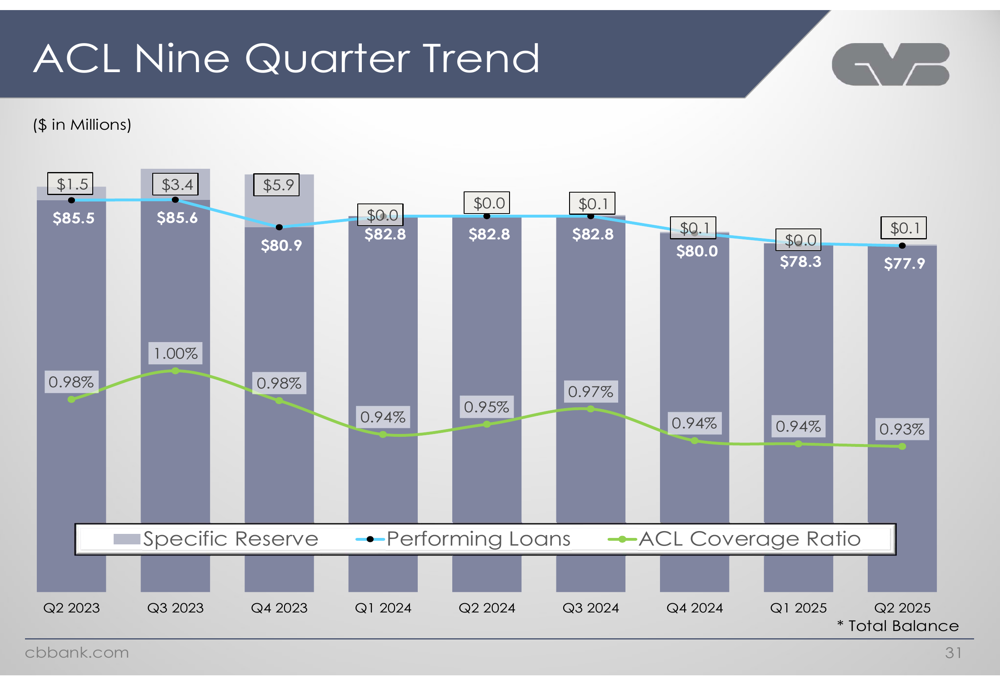
Asset quality remains exceptional, with net charge-offs of just $249,000 in Q2 2025 and non-performing assets representing only 0.17% of total assets. The bank’s classified loans totaled $73.4 million, or 0.88% of total loans, while maintaining an allowance for credit losses of $78 million (0.93% of gross loans).
The following chart shows CVB Financial’s classified loans as a percentage of total loans compared to the KRX index, highlighting the bank’s superior asset quality:
Similarly, the bank’s net charge-offs to average loans ratio has remained minimal and well below industry averages:
Balance Sheet Composition and Deposit Franchise
CVB Financial’s balance sheet reflects a conservative approach with a diverse mix of assets. Loans represent 54% of total assets, while securities account for 31%, providing a balanced approach to income generation and risk management.
The following chart illustrates the bank’s balance sheet composition:
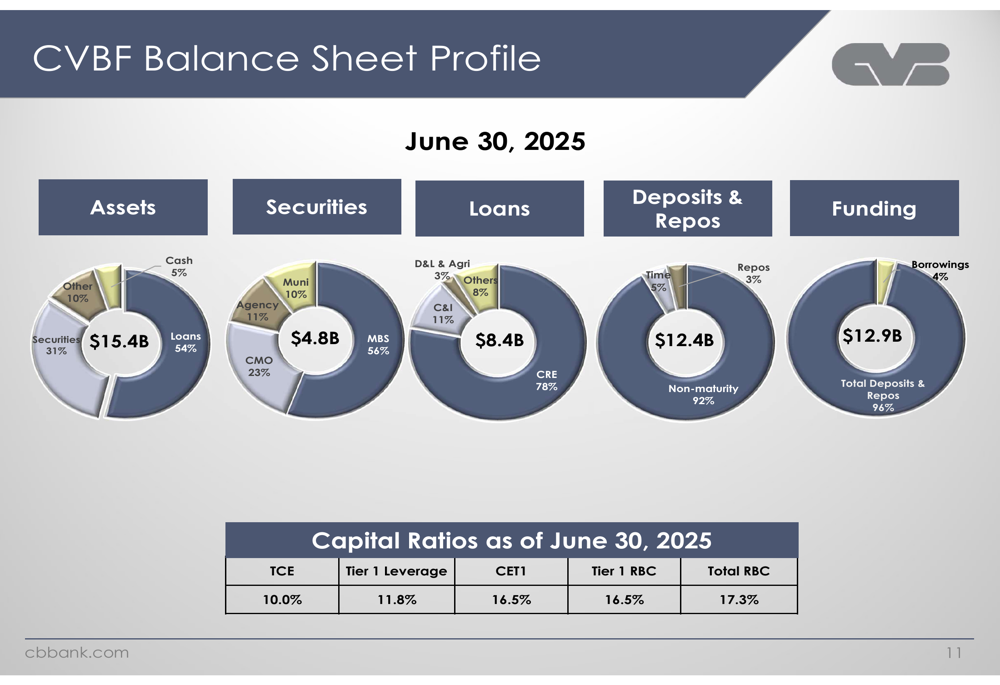
A key competitive advantage for CVB Financial is its strong deposit franchise, with noninterest-bearing deposits accounting for 59% of total deposits as of June 30, 2025. This high proportion of no-cost deposits has helped the bank maintain its net interest margin despite interest rate fluctuations.
The bank’s earnings per share has shown consistent growth over the years, as illustrated in the following chart:
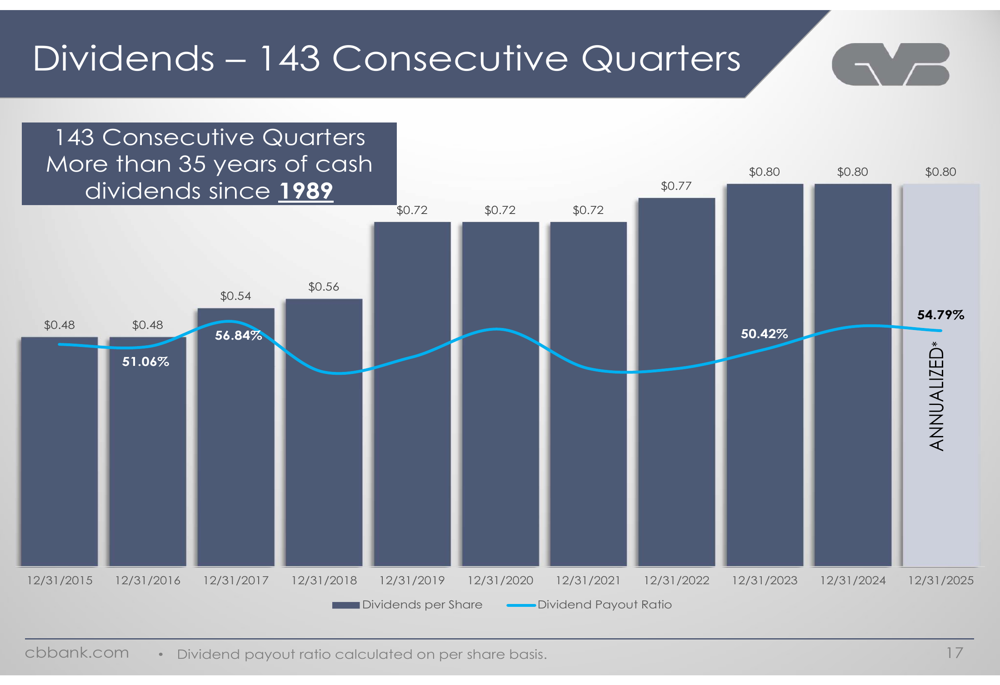
CVB Financial has also maintained its commitment to shareholder returns, with 143 consecutive quarters of cash dividends spanning more than 35 years. The dividend per share has grown from $0.48 in 2015 to an annualized $0.80 in 2025:
Strategic Initiatives and Growth Strategy
CVB Financial’s growth strategy focuses on three key areas: de novo branching, acquisitions, and same-store sales growth. The bank has opened several new branches since 2014, including locations in San Diego, Oxnard, Santa Barbara, Stockton, and Modesto. On the acquisition front, the bank has completed five bank acquisitions since 2014, with the most recent being Suncrest Bank in 2022.
The bank’s target customers are privately-held and family-owned businesses throughout California with annual revenues between $1-300 million. This focus on relationship banking has helped CVB Financial build a loyal customer base, with over 75% of deposit relationships having a tenure of more than three years.
CVB Financial’s loan portfolio is heavily concentrated in commercial real estate (CRE), which accounts for 78% of total loans (50.6% non-owner occupied and 27.4% owner-occupied). The bank maintains a diversified CRE portfolio across various property types, with industrial properties representing the largest segment at 34%, followed by office (16%) and retail (14%).
Forward-Looking Statements
Looking ahead, CVB Financial anticipates loan growth in the low single digits by the end of the year, consistent with the guidance provided in their Q1 2025 earnings call. The bank remains focused on relationship banking and is exploring potential M&A opportunities to further expand its footprint in California.
While the bank’s commercial real estate concentration presents some risk in the current economic environment, particularly in the office sector, CVB Financial’s strong capital position and conservative underwriting standards provide significant buffers against potential losses. The bank’s allowance for credit losses has shown a positive trend over the past nine quarters, reflecting management’s prudent approach to risk management:
With its consistent profitability, strong capital position, high-quality loan portfolio, and attractive deposit franchise, CVB Financial remains well-positioned to navigate economic uncertainties while continuing to deliver value to shareholders. The bank’s stock closed at $20.93 on July 23, 2025, up 0.58% for the day, and currently trades at an attractive P/E ratio of 13.08 according to recent analyst reports.
Full presentation:
This article was generated with the support of AI and reviewed by an editor. For more information see our T&C.