Asahi shares mark weekly slide after cyberattack halts production

Introduction & Market Context
Danaher Corporation (NYSE:DHR) presented its second quarter 2025 earnings results on July 22, showing modest overall growth driven primarily by its Biotechnology segment. The life sciences and diagnostics company reported a 3.5% increase in total revenue, with core revenue growth of 1.5% and a 2.0% benefit from foreign exchange. In premarket trading, Danaher shares were down 1.1% at $186.00, continuing the previous day’s decline of 1.04%.
The Q2 results represent a slight improvement from the first quarter of 2025, when the company reported flat core revenue year-over-year. Danaher continues to navigate a challenging environment in some of its markets while demonstrating strength in others, particularly in its Biotechnology segment.
Quarterly Performance Highlights
Danaher reported Q2 2025 revenue of $5.94 billion, up from $5.74 billion in the same period last year. Adjusted diluted earnings per share increased 4.7% to $1.80, compared to $1.72 in Q2 2024. The company maintained its adjusted operating profit margin at 27.3%, unchanged from the prior year.
As shown in the following summary of second quarter performance:
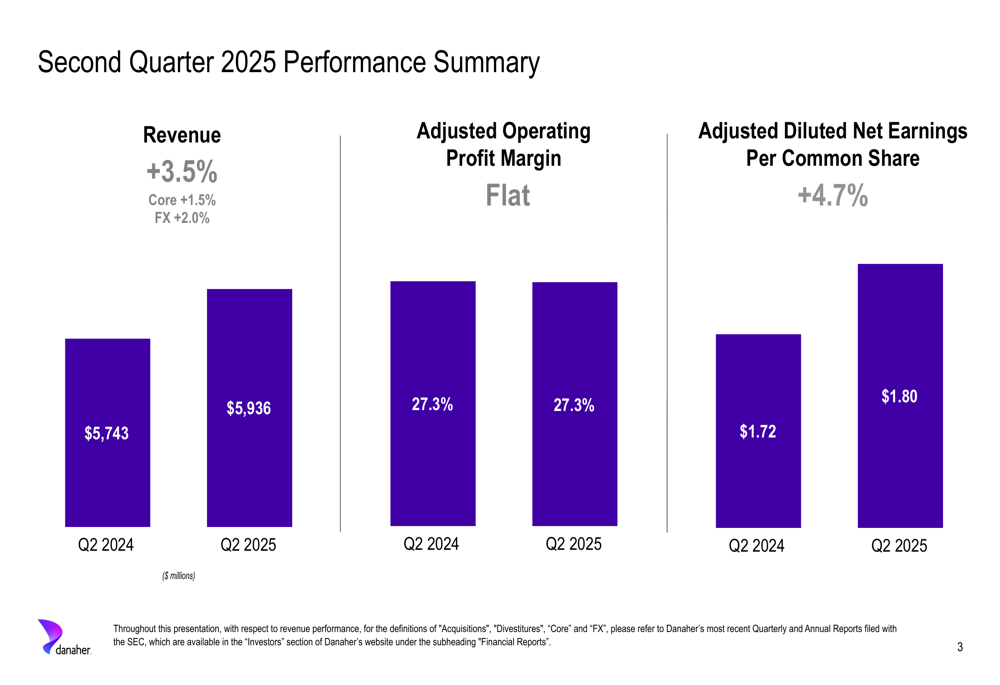
The modest core revenue growth of 1.5% reflects varied performance across Danaher’s business segments, with foreign exchange contributing significantly to the overall revenue increase. Despite flat operating margins, the company managed to deliver earnings growth through operational efficiencies and financial management.
Segment Analysis
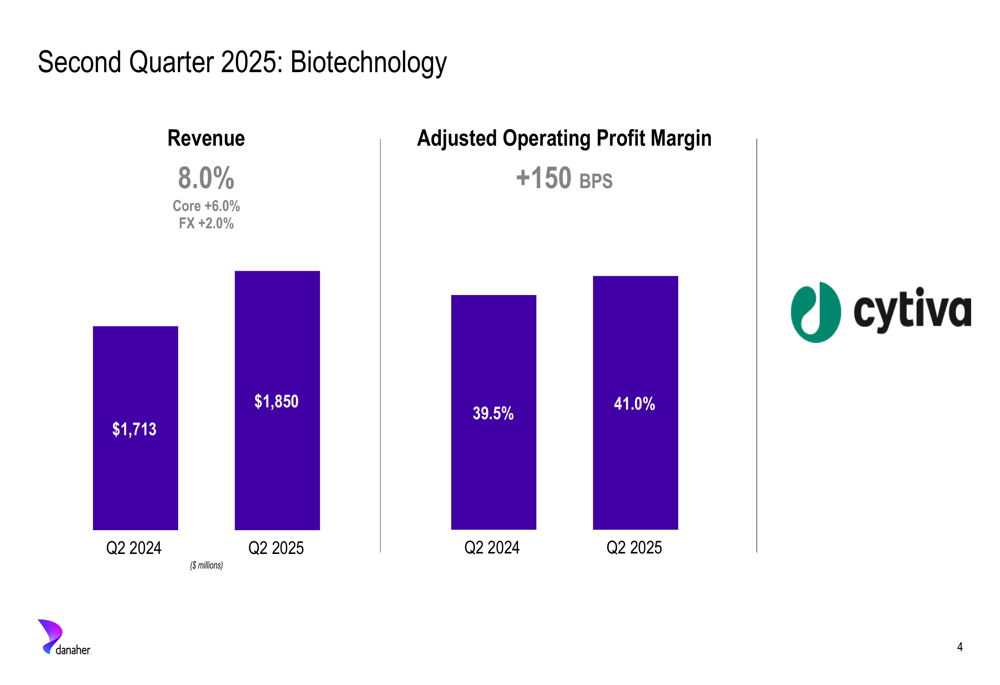
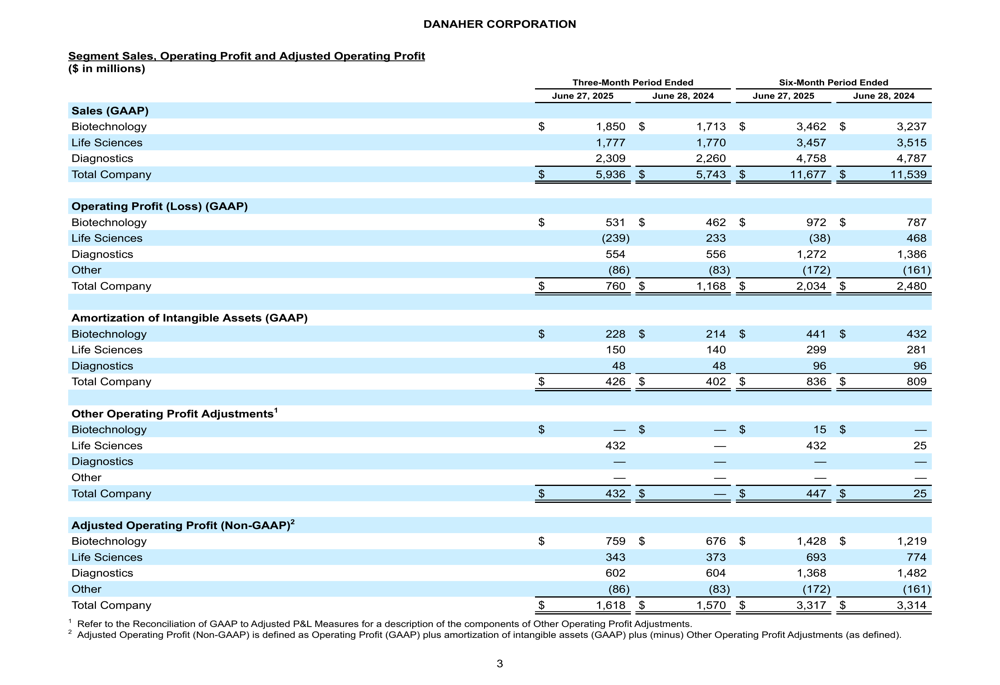
Danaher’s Biotechnology segment, represented by Cytiva, was the standout performer in Q2 2025. The segment reported revenue growth of 8.0%, with core revenue increasing by 6.0% and foreign exchange adding 2.0%. More impressively, the adjusted operating profit margin expanded by 150 basis points to 41.0%, demonstrating strong operational leverage.
The Biotechnology segment’s performance is illustrated here:
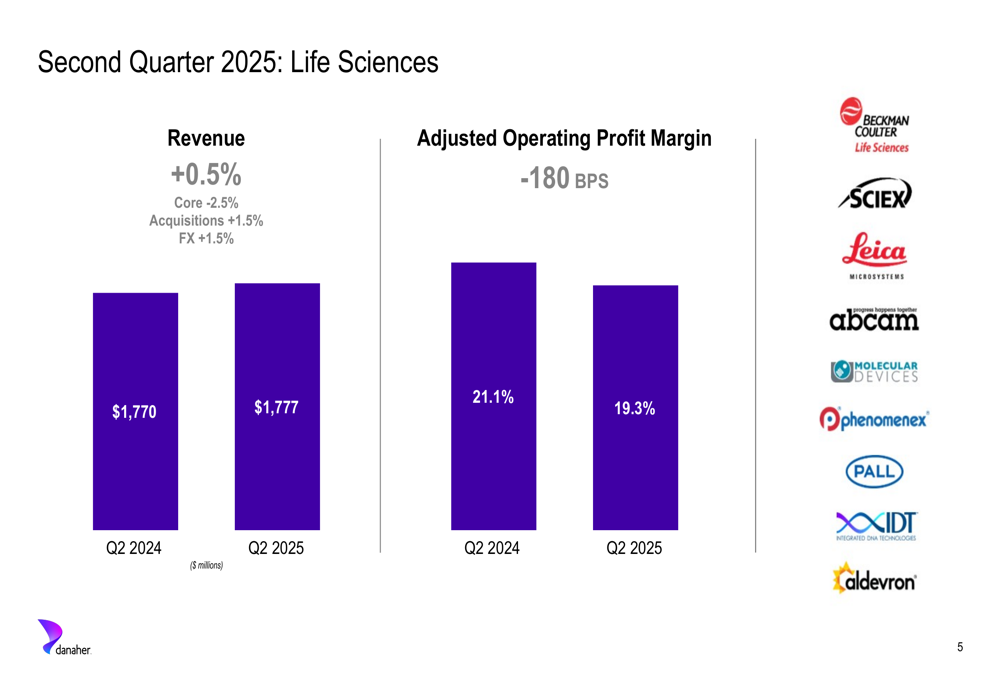
In contrast, the Life Sciences segment struggled with core revenue declining by 2.5%, though total revenue increased slightly by 0.5% due to acquisitions (1.5%) and favorable foreign exchange (1.5%). The segment’s adjusted operating profit margin contracted significantly, falling 180 basis points to 19.3%.
The challenges in the Life Sciences segment are evident in this chart:
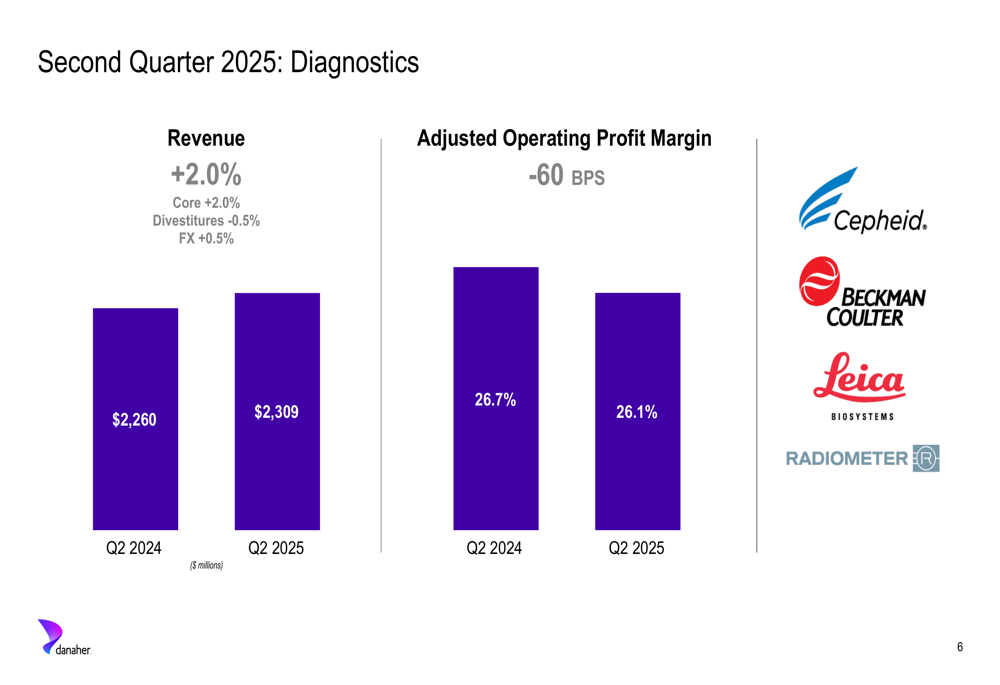
The Diagnostics segment delivered moderate growth with revenue increasing 2.0%, entirely from core growth, despite a 0.5% headwind from divestitures. However, the segment experienced a slight decline in adjusted operating profit margin, which decreased by 60 basis points to 26.1%.
The Diagnostics segment performance is shown here:
This varied segment performance highlights Danaher’s current business dynamics, with Biotechnology driving growth while Life Sciences faces headwinds. The company’s diversified portfolio has helped maintain overall stability despite these variations.
Forward Guidance
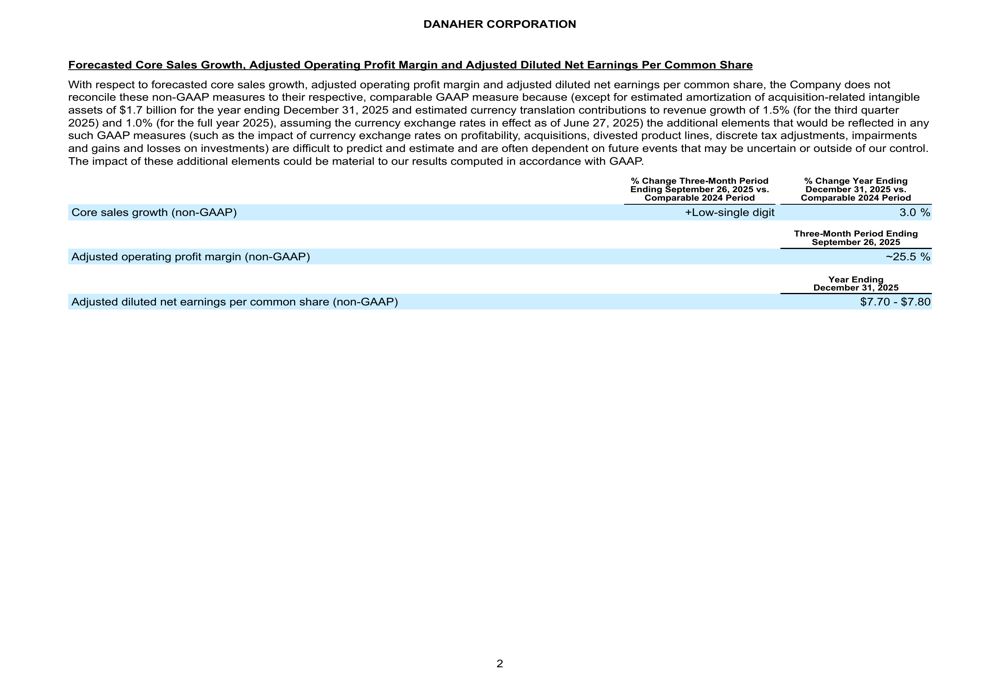
Danaher provided guidance for both the third quarter and full year 2025. For Q3 2025, the company expects low-single-digit core sales growth and an adjusted operating profit margin of approximately 25.5%. For the full year 2025, Danaher forecasts core sales growth of 3.0% and adjusted diluted net earnings per share in the range of $7.70 to $7.80.
This guidance represents a slight improvement from the company’s Q1 2025 outlook, when it projected full-year EPS of $7.60 to $7.75, suggesting increased confidence in its ability to deliver earnings growth despite mixed revenue performance.
The detailed forward-looking guidance is presented in this table:
Financial Health & Cash Flow
Danaher maintained strong cash flow generation in the second quarter of 2025, with net cash provided by operating activities of $1.34 billion, slightly down from $1.42 billion in Q2 2024. Free cash flow was $1.09 billion, compared to $1.13 billion in the same period last year.
Notably, the company significantly improved its operating cash flow to net earnings conversion ratio to 2.41 in Q2 2025, up from 1.56 in Q2 2024. Similarly, the free cash flow to net earnings conversion ratio increased to 1.97 from 1.25 year-over-year, demonstrating enhanced efficiency in converting profits to cash.
The following table details Danaher’s cash flow metrics:
For the six-month period ended June 27, 2025, Danaher reported operating cash flow of $2.64 billion and free cash flow of $2.15 billion, both down from the comparable period in 2024. However, the conversion ratios remained strong, indicating effective working capital management.
The company’s financial position remains solid, with continued strong cash generation providing flexibility for investments, acquisitions, and shareholder returns. This financial strength positions Danaher well to navigate the varying performance across its business segments while pursuing strategic growth opportunities.
Full presentation:
This article was generated with the support of AI and reviewed by an editor. For more information see our T&C.