Powell’s speech, Nvidia’s chips, Meta deal - what’s moving markets

Introduction & Market Context
Diamondback Energy Inc (NASDAQ:FANG) delivered a strong first quarter of 2025, generating record free cash flow and significantly increasing returns to shareholders, according to its investor presentation released on May 6, 2025. The company continues to position itself as the premier Permian Basin pure-play operator, with expanded acreage and inventory depth following recent acquisitions.
Despite a challenging commodity price environment, with Diamondback’s stock closing at $136.81 on May 5, down 2.84% for the day, the company demonstrated robust operational execution and financial discipline. The stock is currently trading well below its 52-week high of $214.50, potentially presenting a value opportunity given the company’s strong cash flow generation and capital return program.
Q1 2025 Performance Highlights
Diamondback reported exceptional first quarter results, generating $1,583 million in adjusted free cash flow ($5.47 per share), representing an 18% increase from the previous quarter. The company produced 475.9 thousand barrels of oil per day (Mbo/d) and 850.7 thousand barrels of oil equivalent per day (Mboe/d), maintaining its position as one of the largest Permian Basin operators.
As shown in the following quarterly performance summary:
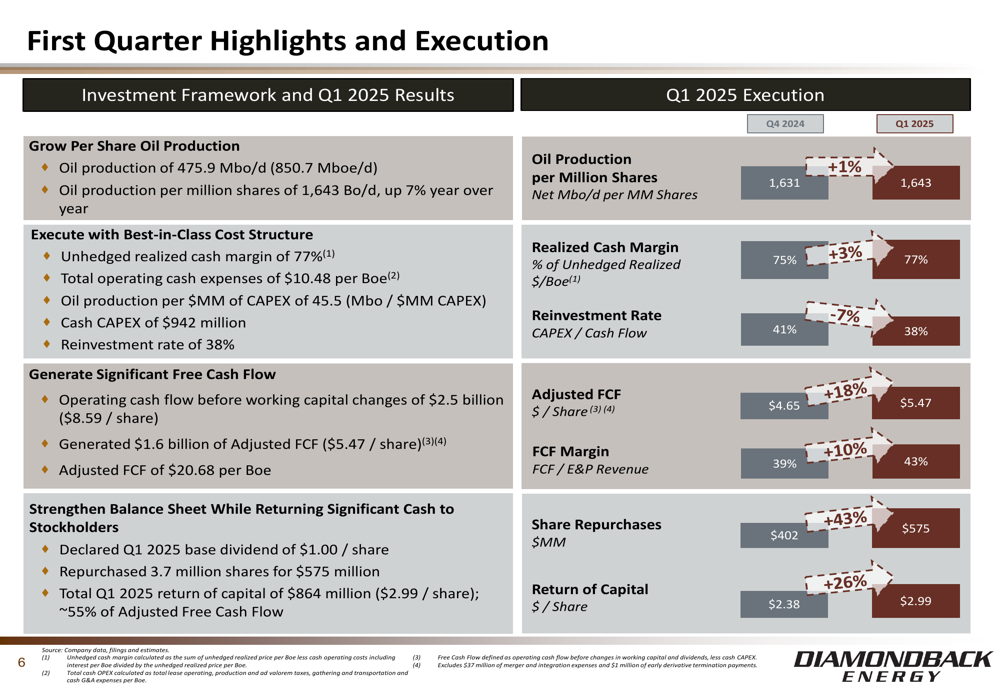
The company achieved an unhedged realized cash margin of 77% in Q1, up from 75% in the previous quarter. Operating cash expenses remained disciplined at $10.48 per barrel of oil equivalent (Boe), while the reinvestment rate decreased to 38% from 41% in Q4 2024, demonstrating Diamondback’s commitment to capital discipline.
Particularly impressive was Diamondback’s 43% quarter-over-quarter increase in share repurchases to $575 million, along with a 26% increase in total return of capital per share to $2.99. The company returned approximately 55% of its adjusted free cash flow to shareholders during the quarter, exceeding its commitment to return at least 50% of quarterly free cash flow.
Strategic Positioning and Asset Overview
Diamondback has significantly expanded its Permian Basin footprint, now controlling approximately 900,000 net acres with run-rate production of about 885 thousand barrels of oil equivalent per day beginning in Q2 2025. The company’s strategic focus on the Midland Basin has resulted in substantial growth in both acreage and inventory.
The following asset overview illustrates Diamondback’s transformation into the premier Permian pure-play:
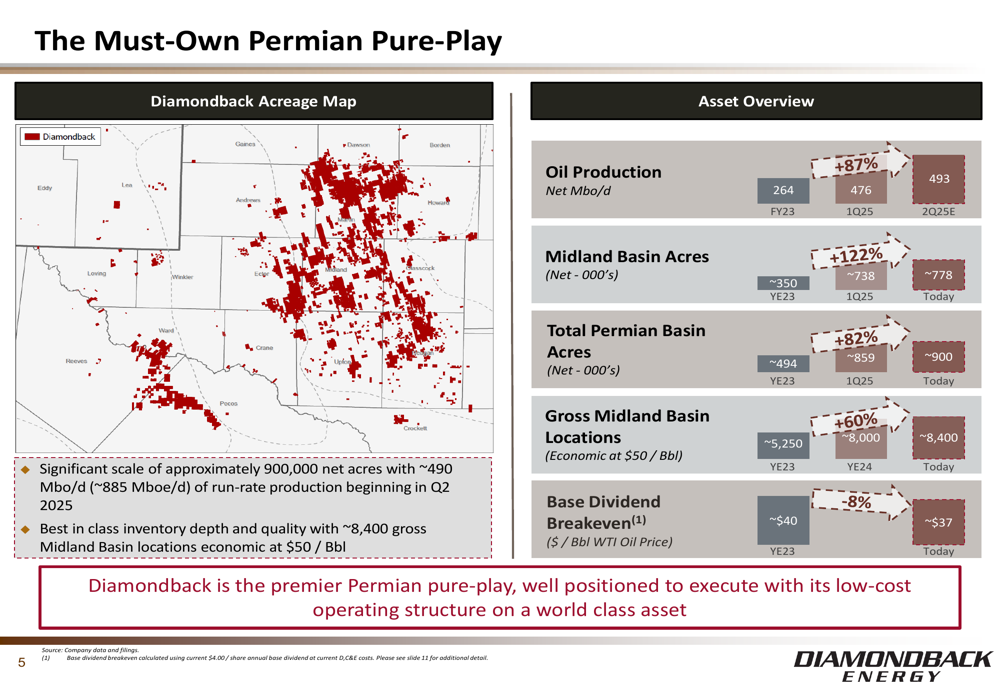
Year-over-year comparisons are striking, with oil production up 87%, Midland Basin acreage increased by 122%, and total Permian Basin acreage expanded by 82%. Perhaps most importantly, the company’s gross Midland Basin locations economic at $50 per barrel WTI have increased 60% to approximately 8,400, providing years of high-quality drilling inventory.
This expanded inventory positions Diamondback for sustainable long-term growth while reducing its base dividend breakeven price to approximately $37 per barrel WTI, an 8% improvement from year-end 2023.
Updated 2025 Guidance
Diamondback has updated its full-year 2025 guidance, reflecting improved capital efficiency and strong production growth. The company now expects to produce 487,500 barrels of oil per day, representing a 45% increase from 2024 levels.
The updated guidance demonstrates Diamondback’s focus on per-share metrics and capital efficiency:
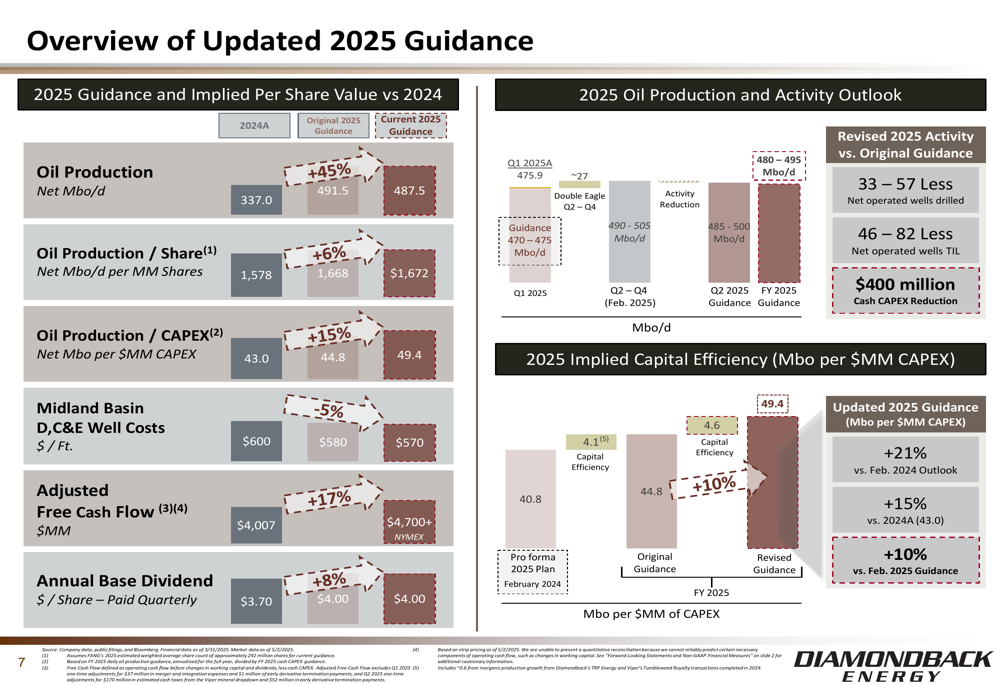
Oil production per share is expected to increase 6% year-over-year to 1,672 barrels per day per million shares, while oil production per million dollars of capital expenditure is projected to improve 15% to 49.4 thousand barrels. Midland Basin drilling, completion, and equipping costs are expected to decrease 5% to $570 per foot, highlighting the company’s operational efficiency.
Diamondback anticipates generating at least $4.7 billion in adjusted free cash flow in 2025 at current commodity prices, a 17% increase from 2024. The company has also increased its annual base dividend to $4.00 per share, up 8% from 2024.
Capital Allocation and Shareholder Returns
Diamondback’s capital allocation framework prioritizes sustainable shareholder returns while maintaining financial discipline. The company has committed to returning at least 50% of quarterly free cash flow to stockholders through a combination of base dividends, share repurchases, and variable dividends.
The following chart illustrates Diamondback’s capital allocation strategy:
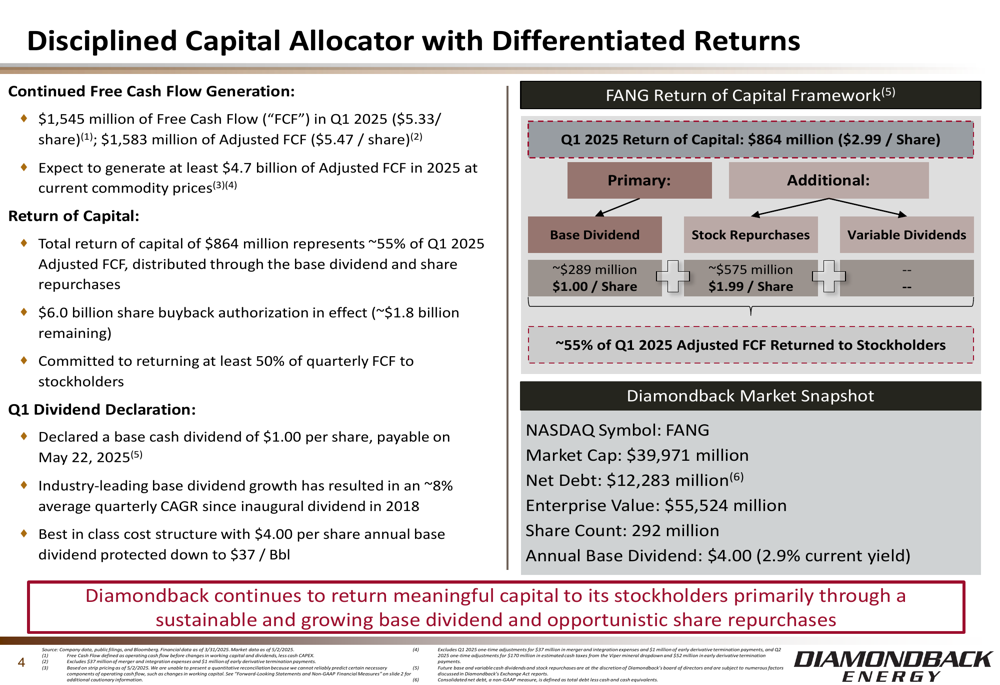
In Q1 2025, Diamondback returned $864 million to shareholders, including a base dividend of $1.00 per share ($289 million total) and $575 million in share repurchases. The company has a $6.0 billion share repurchase authorization in place, with approximately $1.8 billion remaining.
Diamondback’s free cash flow generation remains robust even at lower oil prices, as demonstrated by this sensitivity analysis:
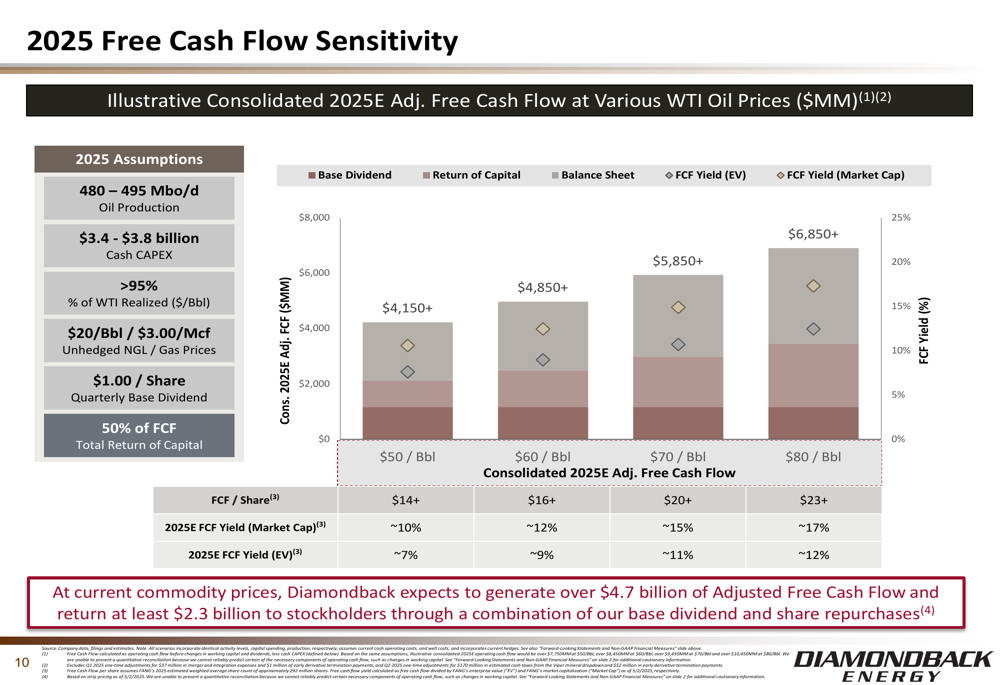
At $70 per barrel WTI, the company expects to generate over $5.85 billion in adjusted free cash flow in 2025, representing approximately $20 per share and a 15% market cap free cash flow yield. Even at $50 per barrel WTI, Diamondback projects over $4.15 billion in adjusted free cash flow, highlighting the resilience of its business model.
Balance Sheet and Financial Strength
Diamondback maintains an investment-grade balance sheet, providing financial flexibility and stability. The company reported consolidated net debt of approximately $12.3 billion as of March 31, 2025, with a net debt to annualized Q1 adjusted EBITDA ratio of 1.04x.
The following chart details Diamondback’s debt maturity profile and liquidity position:
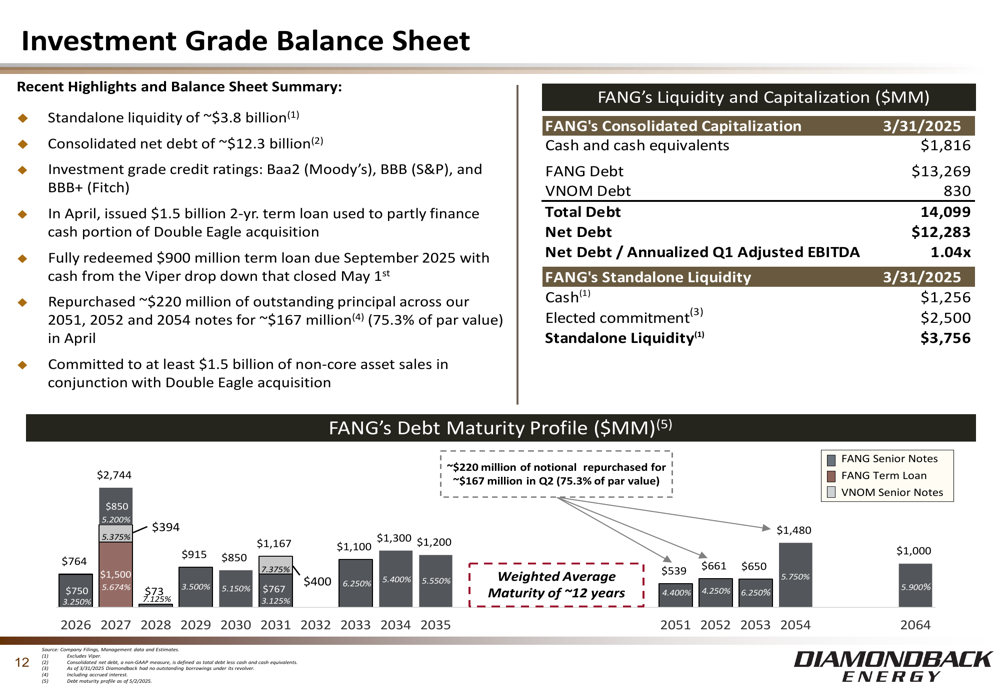
With standalone liquidity of approximately $3.8 billion and investment-grade credit ratings from all three major rating agencies (Baa2 from Moody’s, BBB from S&P, and BBB+ from Fitch), Diamondback is well-positioned to navigate commodity price volatility while continuing to return capital to shareholders.
Industry Leadership and Competitive Positioning
Diamondback consistently outperforms its peers in key financial and operational metrics, particularly in free cash flow generation and capital efficiency. The company’s disciplined approach to capital allocation and operational excellence has resulted in industry-leading performance.
As illustrated in the following peer comparison:
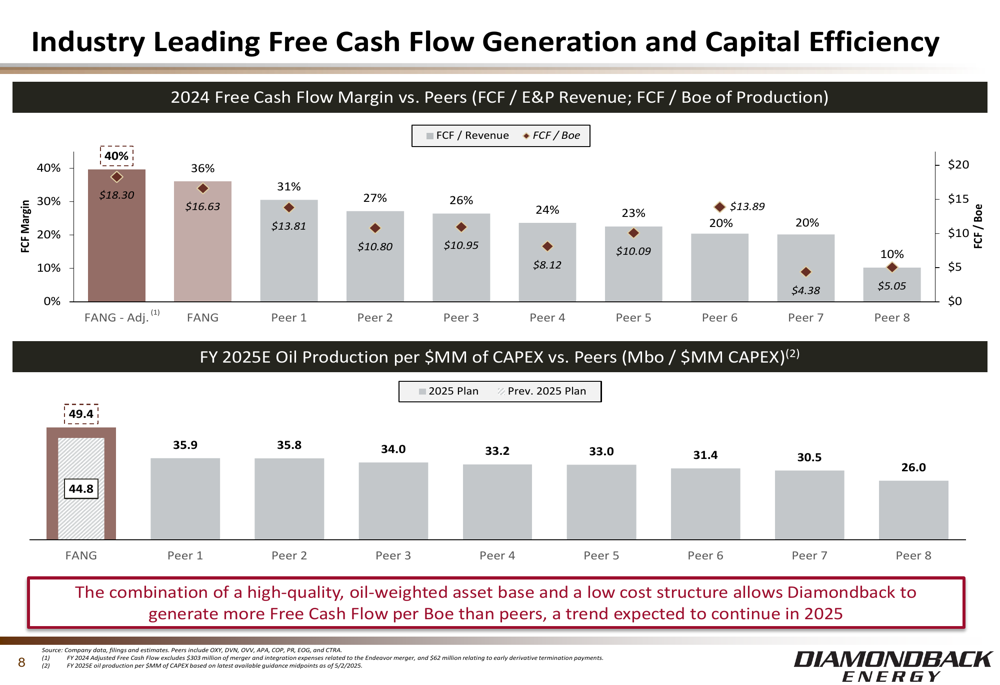
Diamondback’s free cash flow margin and capital efficiency metrics rank at the top of its peer group. This superior performance is driven by the company’s high-quality asset base, operational expertise, and strategic focus on the most productive areas of the Permian Basin.
Forward Outlook
Looking ahead, Diamondback is well-positioned to continue delivering strong results throughout 2025. The company expects to drill 385-435 gross wells and complete 475-550 gross wells during the year, with a capital expenditure budget of $3.4-$3.8 billion.
For the second quarter of 2025, Diamondback projects oil production of 485-500 thousand barrels per day, with cash capital expenditures of $800-900 million and cash taxes of $340-400 million.
The company’s expanded inventory of high-quality drilling locations, combined with its disciplined capital allocation framework and operational excellence, provides a clear path for sustainable long-term growth and shareholder returns. With a base dividend protected down to $37 per barrel WTI and significant free cash flow generation capacity, Diamondback remains well-positioned to deliver value through the commodity price cycle.
Full presentation:
This article was generated with the support of AI and reviewed by an editor. For more information see our T&C.