Fubotv earnings beat by $0.10, revenue topped estimates

Introduction & Market Context
Diamondback Energy (NASDAQ:FANG) released its Q2 2025 investor presentation on August 5, revealing significant capital expenditure reductions while maintaining production targets for the year. The presentation comes as the company’s stock faces pressure following a Q2 earnings miss, with shares falling 3.22% to close at $147.78 and continuing to decline in pre-market trading.
Despite missing EPS forecasts with Q2 earnings of $2.67 per share versus the expected $2.86, Diamondback highlighted strong free cash flow generation and industry-leading capital efficiency in its presentation. The company’s actual revenue of $3.68 billion exceeded forecasts by 8.88%, demonstrating operational strength amid challenging market conditions.
Updated 2025 Guidance
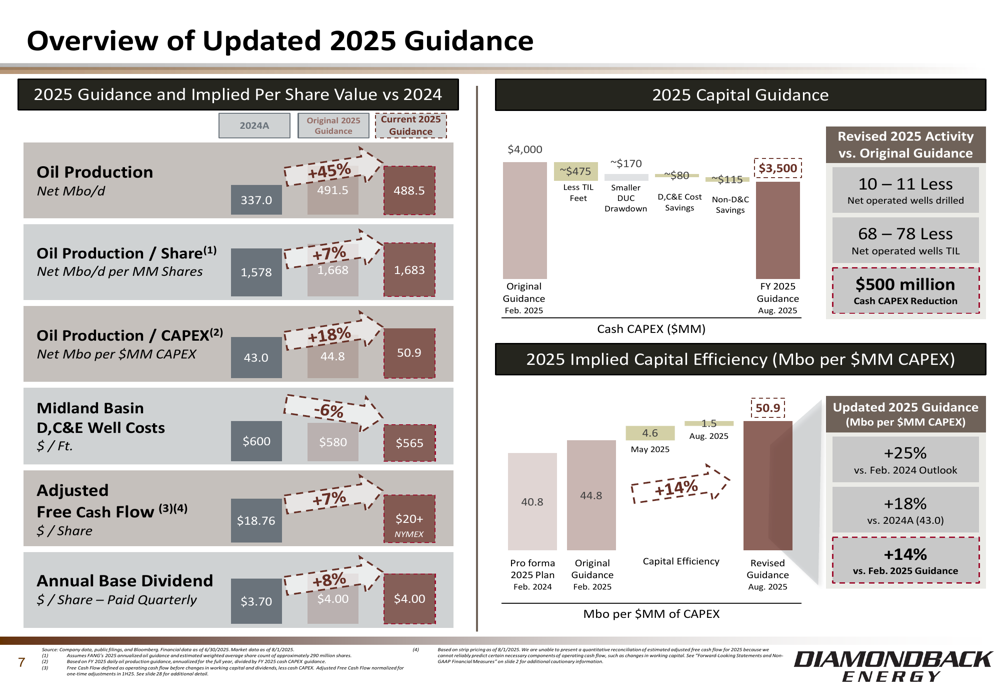
A key highlight of Diamondback’s presentation is the significant reduction in its 2025 capital expenditure guidance, cutting $500 million from its previous forecast while maintaining production targets. The company now expects to spend $3.4-$3.6 billion in capital for the year, down from the original $4.0 billion guidance.
This capital efficiency improvement comes from several factors, including fewer net operated wells, smaller DUC (drilled but uncompleted wells) drawdown, and D,C&E cost savings. Despite this CAPEX reduction, Diamondback maintained its oil production guidance at 485-492 thousand barrels per day (Mbo/d).
As shown in the following updated guidance chart, the company has significantly improved its capital efficiency metrics:
Quarterly Performance Highlights
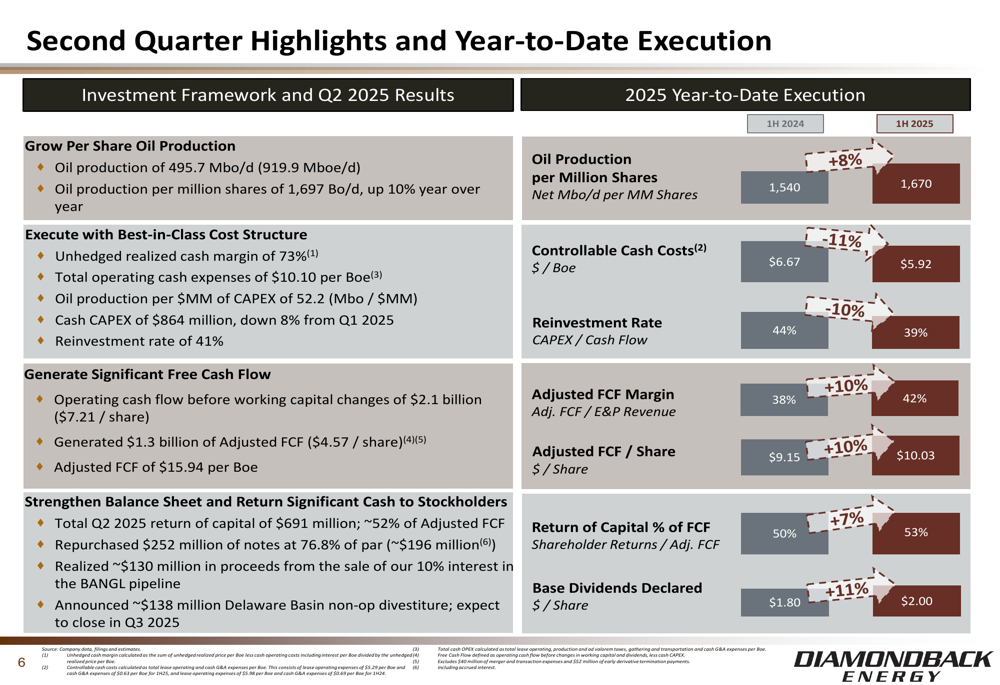
For Q2 2025, Diamondback reported oil production of 495.7 Mbo/d (919.9 Mboe/d), with oil production per million shares increasing 10% year-over-year to 1,697 Bo/d. The company generated $1.3 billion of adjusted free cash flow ($4.57 per share) and returned $691 million to shareholders, representing approximately 52% of adjusted FCF.
The company’s operational efficiency is reflected in its unhedged realized cash margin of 73% and total operating cash expenses of $10.10 per Boe. Year-to-date execution shows improvements across key metrics compared to the first half of 2024, including an 8% increase in oil production per million shares, 11% reduction in controllable cash costs, and 10% improvement in adjusted FCF per share.
The following chart illustrates Diamondback’s Q2 performance and year-to-date execution:
Capital Allocation & Shareholder Returns
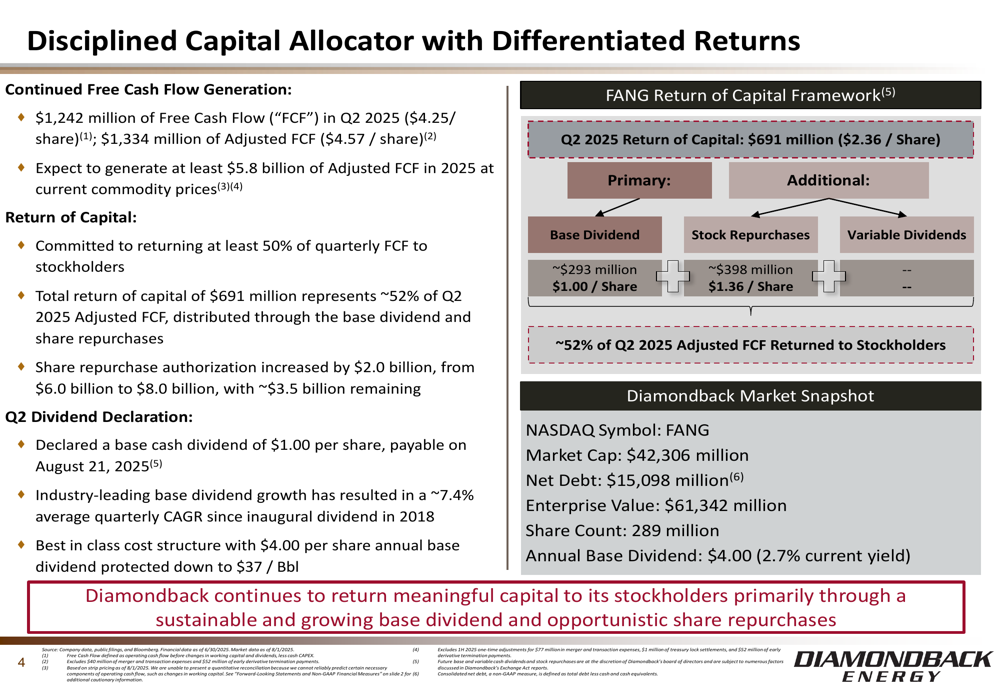
Diamondback continues to prioritize shareholder returns, committing to return at least 50% of quarterly free cash flow to stockholders. The company declared a base cash dividend of $1.00 per share for Q2 (equating to $4.00 annually or a 2.7% yield), while also increasing its share repurchase authorization to $8.0 billion, with approximately $3.5 billion remaining.
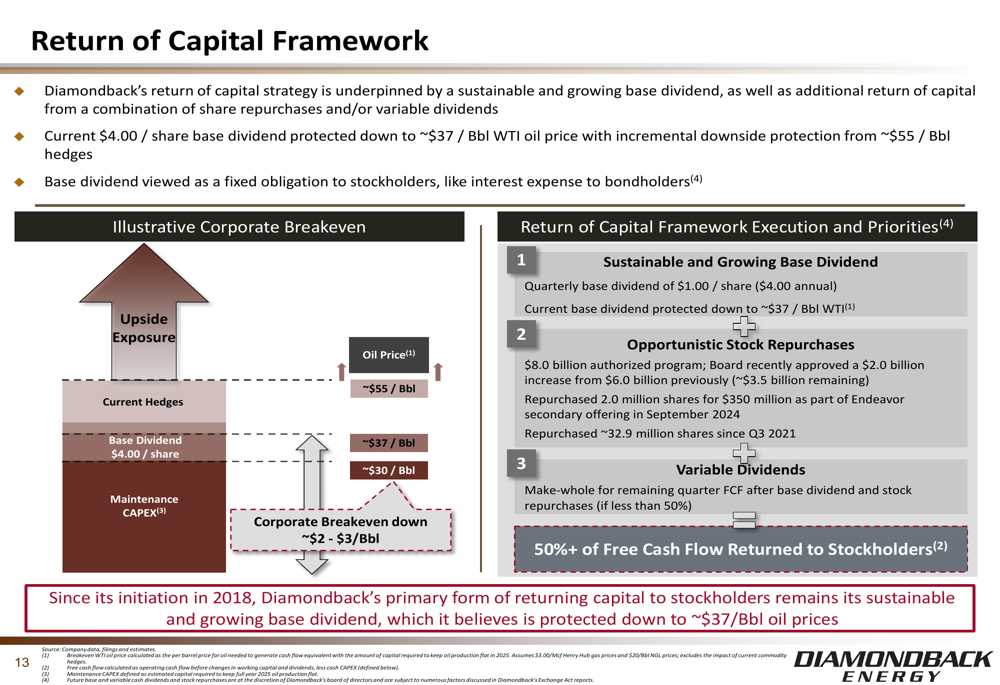
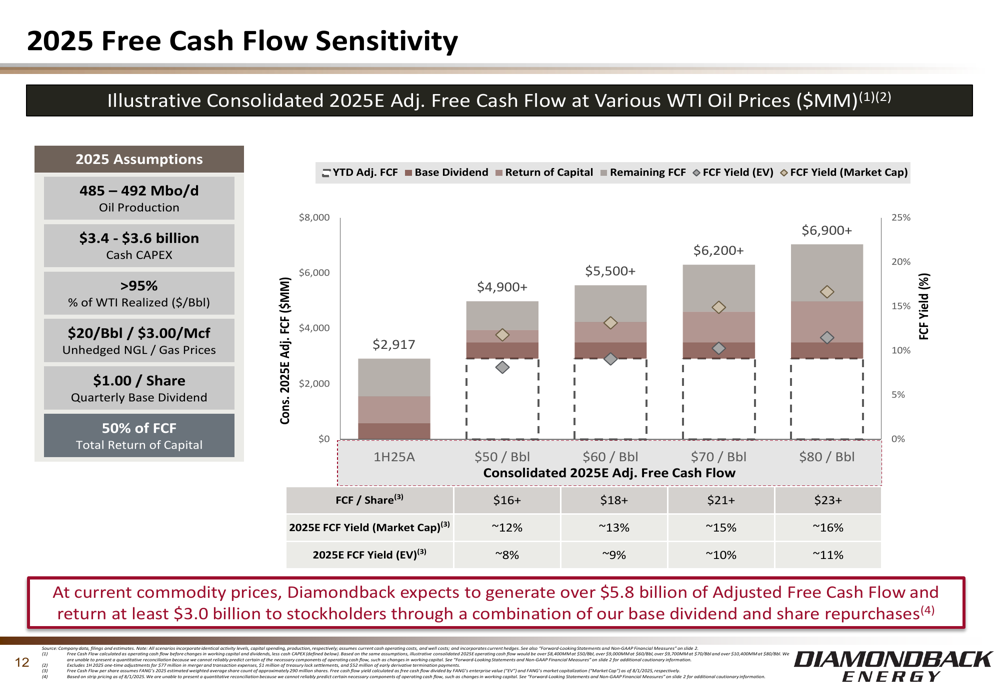
At current commodity prices, Diamondback expects to generate at least $5.8 billion of adjusted free cash flow in 2025. The company’s return of capital framework emphasizes a sustainable and growing base dividend, opportunistic stock repurchases, and variable dividends when appropriate.
The following chart details Diamondback’s capital allocation strategy and return of capital to shareholders:
The company’s return of capital framework provides flexibility across different oil price scenarios, with the base dividend protected at approximately $37/Bbl WTI oil price:
Competitive Industry Position
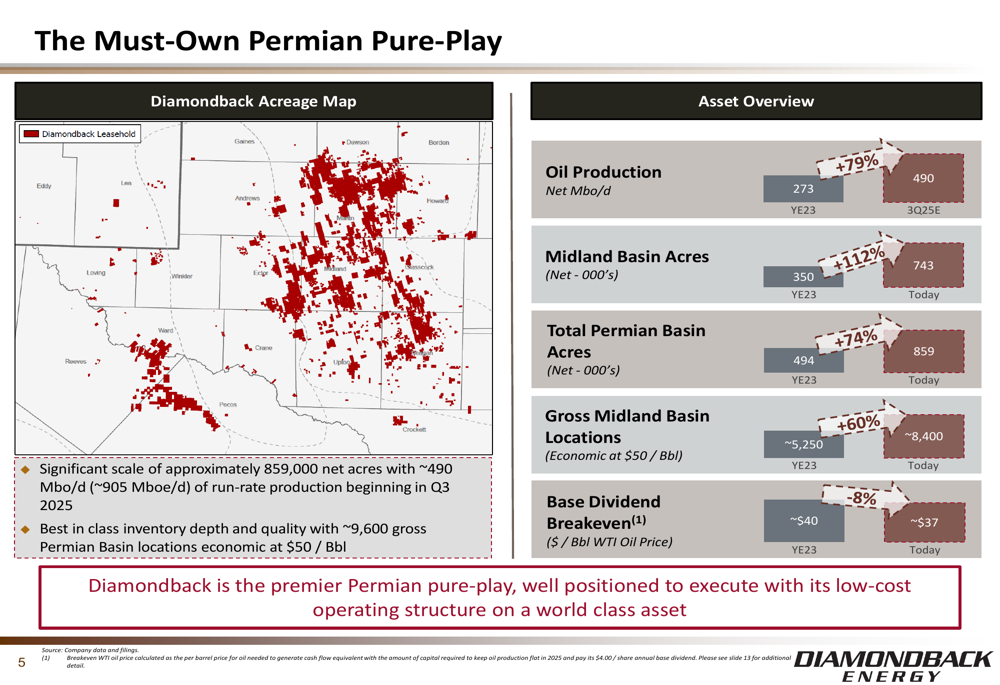
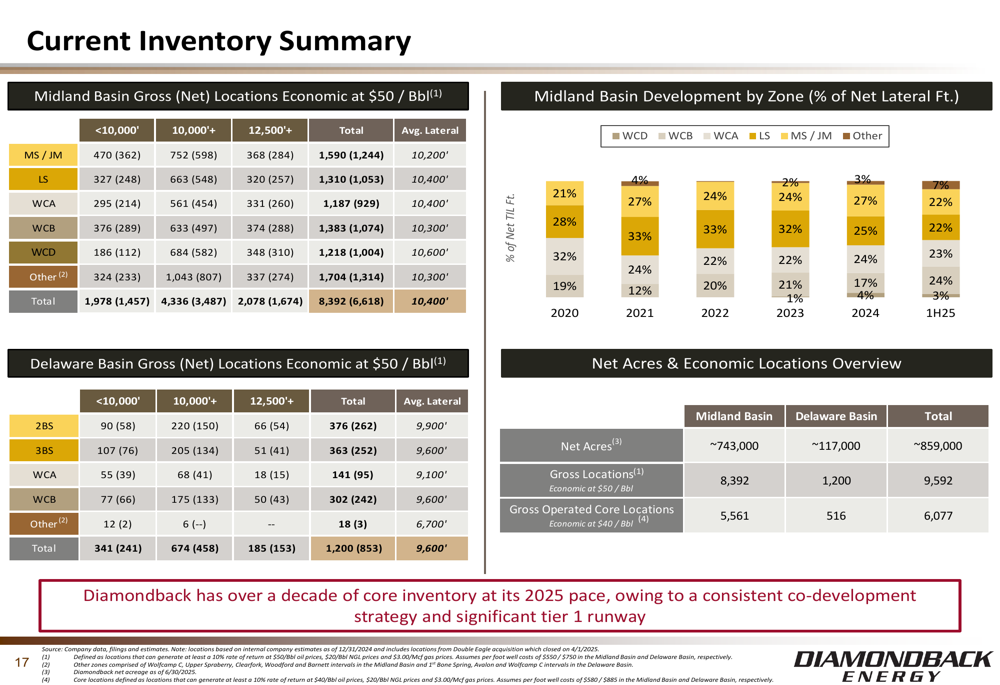
Diamondback positions itself as "The Must-Own Permian Pure-Play," with approximately 859,000 net acres and ~490 Mbo/d of run-rate production beginning in Q3 2025. The company highlights its best-in-class inventory depth and quality, with ~9,600 gross Permian Basin locations economic at $50/Bbl.
The following map and asset overview illustrate Diamondback’s significant Permian Basin position:
The company emphasizes its industry-leading capital efficiency, which it attributes to its strong, oil-weighted asset base and efficient cost structure. Diamondback’s free cash flow sensitivity analysis demonstrates robust cash generation even at lower oil prices:
Operational Efficiency
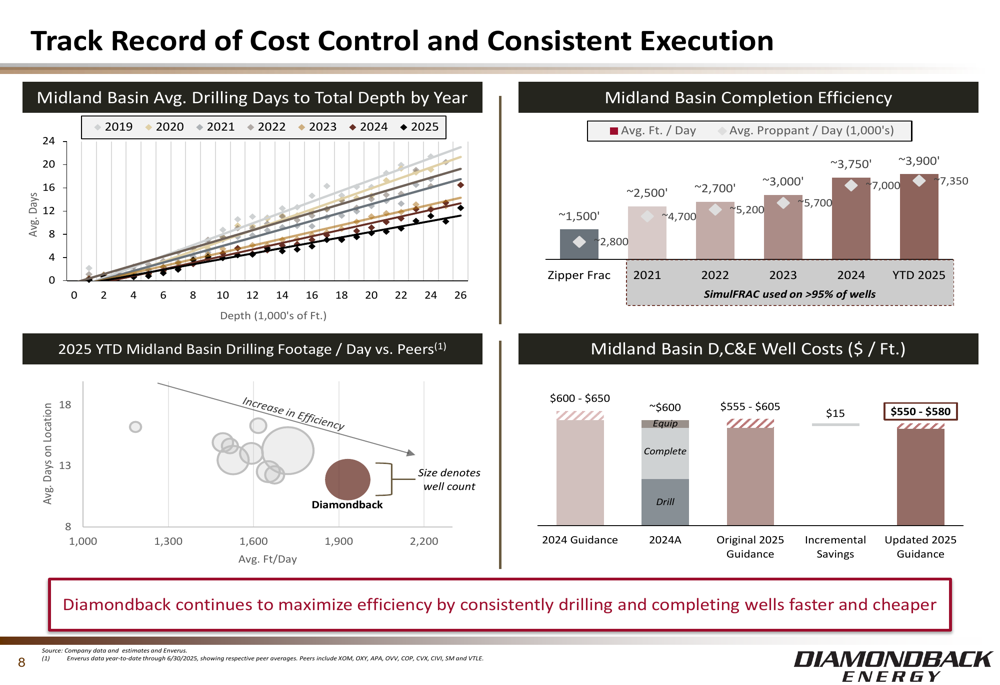
Diamondback highlights its operational improvements through decreasing drilling days to total depth and increasing completion efficiency. The company’s Midland Basin drilling efficiency compares favorably to peers, with consistent improvements in footage per day and proppant per day metrics.
The following chart demonstrates Diamondback’s cost control and efficiency trends:
Balance Sheet & Risk Management
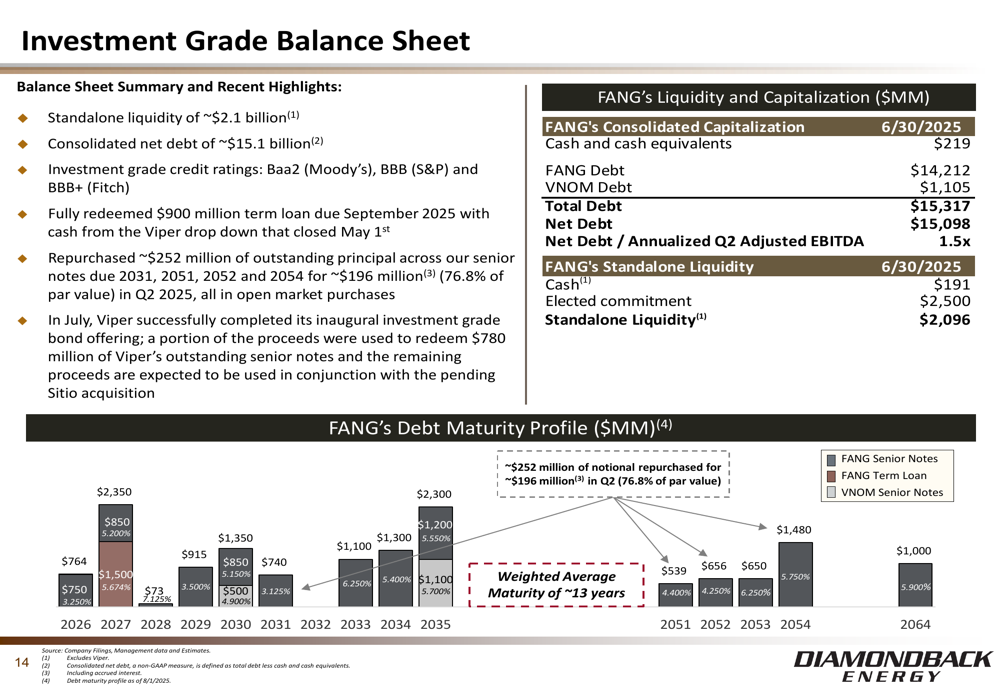
Diamondback maintains an investment grade balance sheet with consolidated net debt of approximately $15.1 billion and standalone liquidity of ~$2.1 billion. The company holds investment grade credit ratings from all three major agencies: Baa2 (Moody’s), BBB (S&P), and BBB+ (Fitch).
The debt maturity profile shows a well-structured timeline, with the company having repurchased $252 million of notional debt:
Forward-Looking Statements
Looking ahead, Diamondback expects to maintain its capital discipline while focusing on operational efficiency. The company’s presentation strikes an optimistic tone about future performance, though this contrasts somewhat with the market’s reaction to its Q2 earnings miss.
CEO Case Vantolf’s statement in the earnings call that "We’re closer to discussing growth again" suggests potential future expansion, despite the current focus on capital efficiency and shareholder returns. However, the company faces challenges from volatile oil market dynamics and reduced rig counts in the Permian Basin.
Diamondback’s inventory depth provides runway for continued development, with the following breakdown of its economic locations:
While the presentation emphasizes Diamondback’s strong positioning and operational excellence, investors should note the disconnect between the company’s positive messaging and the market’s negative reaction to its Q2 earnings miss. The stock’s decline following the earnings release suggests that despite the company’s operational improvements and capital discipline, investors may be concerned about its ability to meet profitability expectations in the current market environment.
Full presentation:
This article was generated with the support of AI and reviewed by an editor. For more information see our T&C.