First Brands Group debt targeted by Apollo Global Management - report

Dollar Tree Inc (NASDAQ:DLTR) presented its second-quarter 2025 financial results on September 3, 2025, highlighting strong comparable store sales growth and strategic progress following the divestiture of its Family Dollar business. The company’s shares closed at $111.35 on September 2, up 2% from the previous session, with premarket trading showing minimal movement at $111.39.
Quarterly Performance Highlights
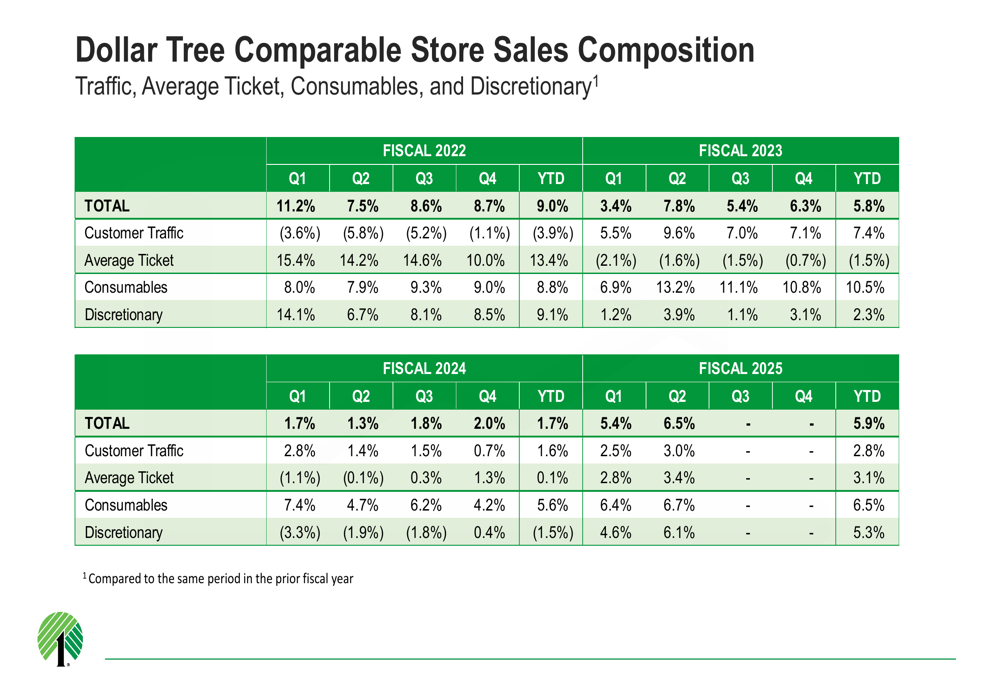
Dollar Tree reported adjusted diluted earnings per share from continuing operations of $0.77 for the second quarter, which included a $0.20 positive impact from tariff timing. The retailer delivered impressive comparable store sales growth of 6.5%, driven by a 3.0% increase in customer traffic and a 3.4% rise in average ticket size.
The company’s performance showed strength across product categories, with consumables comparable sales growing 6.7% and discretionary items rising 6.1%. This balanced growth demonstrates Dollar Tree’s appeal to value-conscious consumers across both essential and non-essential purchases.
As shown in the following chart of comparable store sales composition, Dollar Tree has maintained positive momentum in both traffic and ticket size through 2025:
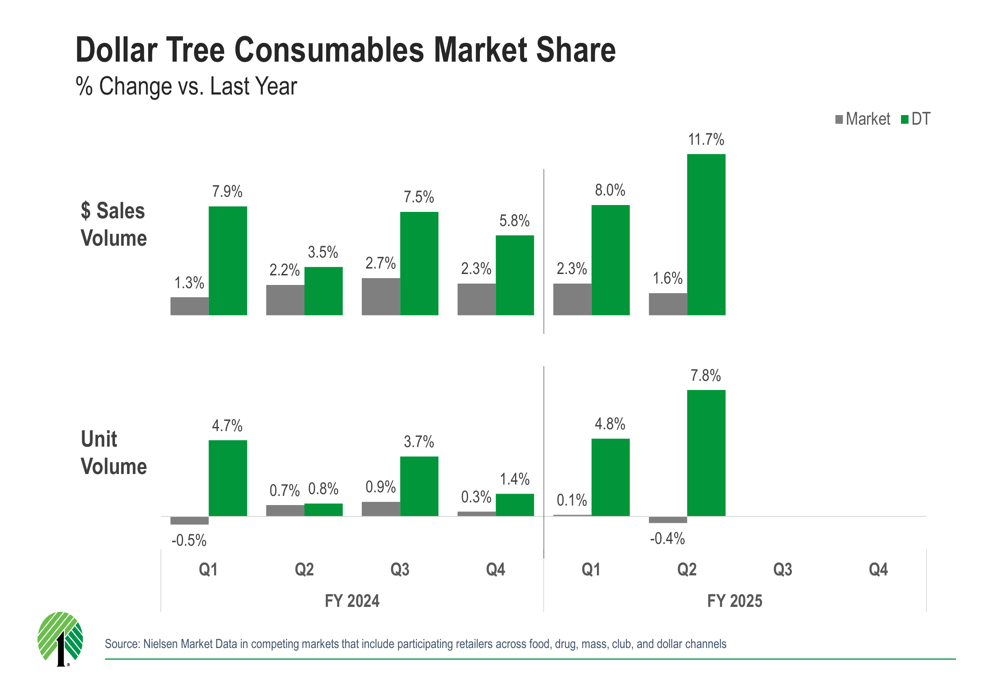
The retailer’s consumables business continues to outpace the broader market, gaining significant market share. Dollar Tree’s consumables sales volume increased by 11.7% in Q2 2025, while unit volume grew by 7.8%, reflecting the company’s strengthening position in this competitive segment.
This market share growth is illustrated in the following chart:
Strategic Initiatives & Store Growth
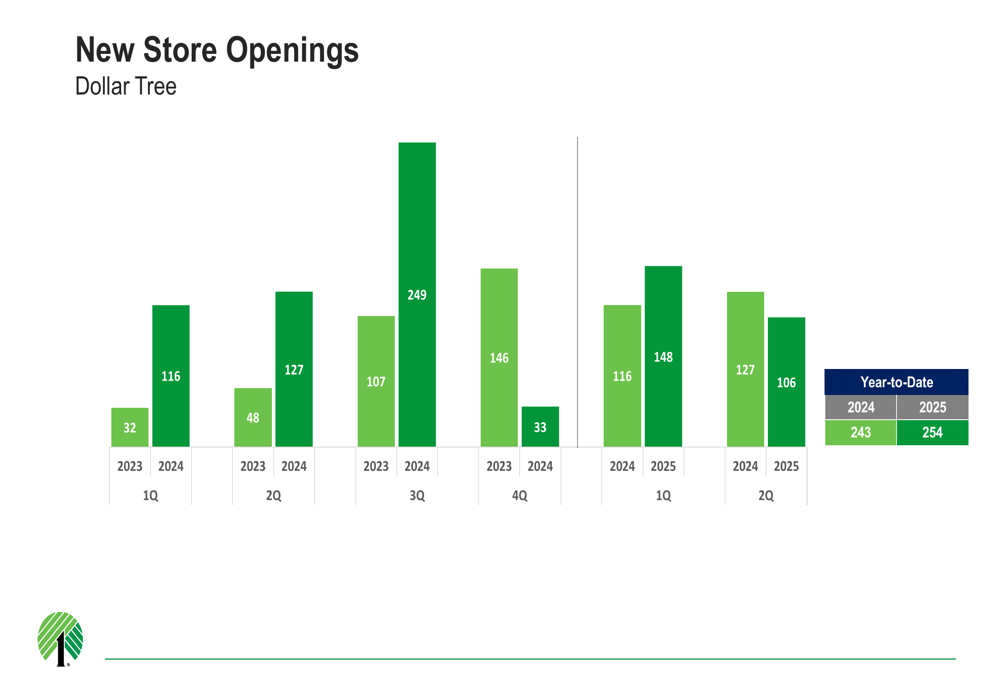
Dollar Tree has accelerated its store expansion strategy, opening 106 new stores during the second quarter, significantly more than the 48 stores opened in the same period last year. This brings the company’s total store count to 9,148 locations. Additionally, 26 former Family Dollar Combo stores were converted to full Dollar Tree stores during the quarter, with plans to convert 31 more by year-end.
The company’s store opening trajectory is illustrated in this chart:
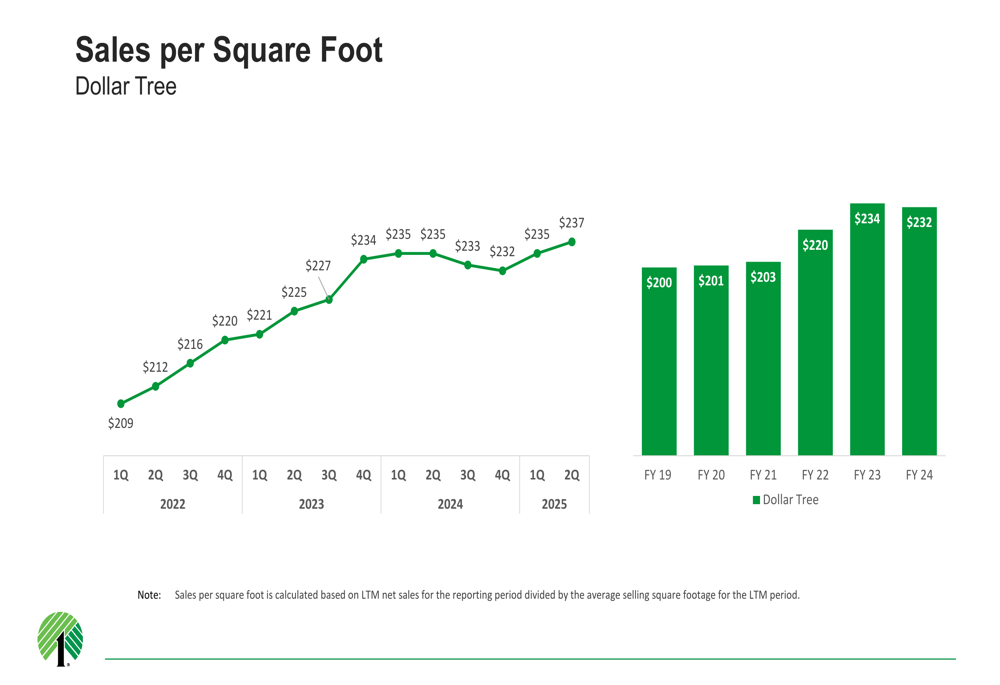
Store productivity continues to improve, with sales per square foot reaching $237 in Q2 2025, demonstrating the effectiveness of Dollar Tree’s merchandising and operational strategies.
As shown in the following chart of sales per square foot:
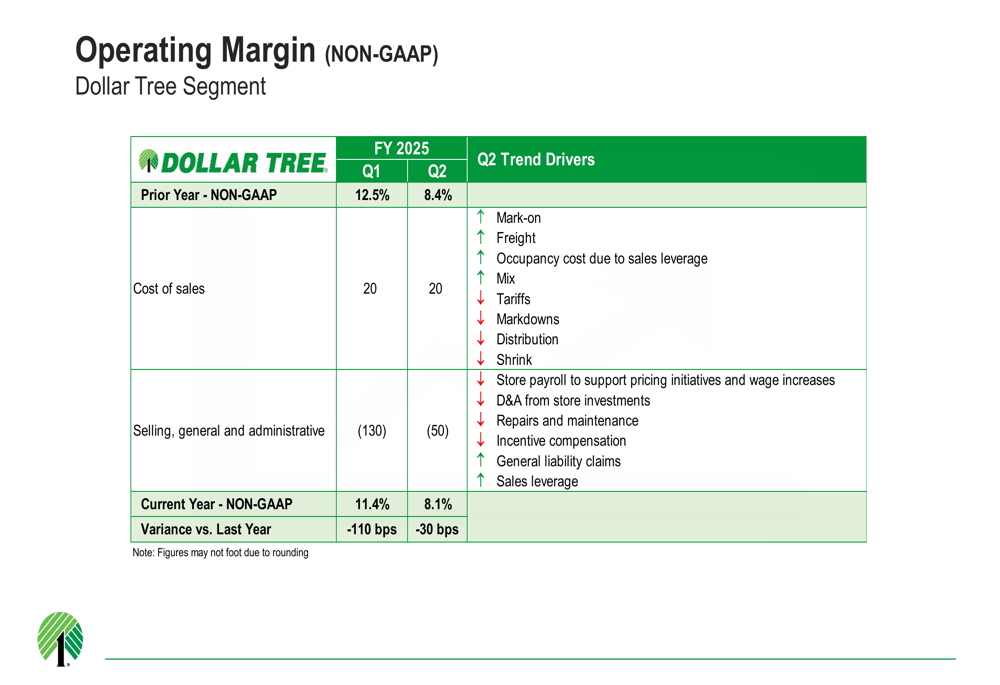
While Dollar Tree’s gross margin expanded by 20 basis points in the second quarter, adjusted operating margin contracted by 20 basis points. This reflects ongoing investments in the business and inflationary pressures affecting operational costs.
The operating margin trends are illustrated in the following chart:
Financial Position & Capital Allocation
Dollar Tree has maintained a strong balance sheet following the completion of its Family Dollar divestiture. The company reported $666 million in cash and cash equivalents at the end of the quarter and generated $145 million in year-to-date free cash flow from continuing operations.
The retailer has been actively returning capital to shareholders, repurchasing 5.0 million shares for $501 million during Q2, with an additional 0.6 million shares purchased for $71 million after quarter-end. The company also paid off $1.0 billion of maturing May 2025 4.00% senior notes, reducing its debt obligations.
The Family Dollar sale was completed with a purchase consideration of $1.0 billion, resulting in net proceeds of approximately $800 million. Dollar Tree received $665 million at closing, with $22 million to be received within 90 days and $113 million expected from monetizing cash through working capital reduction. The company has entered into transition services agreements for up to 18 months to ensure a smooth separation.
Forward-Looking Statements & Outlook
Dollar Tree provided an updated outlook for fiscal year 2025, projecting sales between $19.3 billion and $19.5 billion, with comparable store sales expected to increase 4% to 6%. The company anticipates gross margin expansion of approximately 50 basis points for the full year.
The detailed outlook is presented in the following chart:
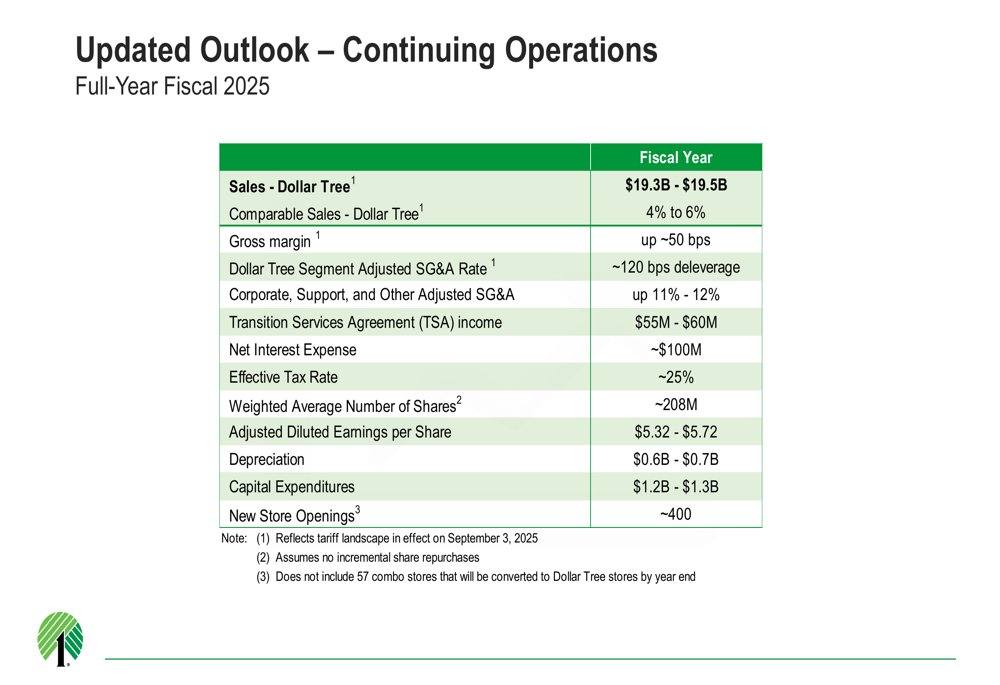
The company expects to open approximately 400 new stores during fiscal 2025, continuing its expansion strategy. Capital expenditures are projected to be between $1.2 billion and $1.3 billion, reflecting ongoing investments in store growth and infrastructure.
Dollar Tree’s adjusted diluted earnings per share for fiscal 2025 are expected to range from $5.32 to $5.72. This outlook reflects the company’s confidence in its core business following the strategic divestiture of Family Dollar, allowing management to focus resources and attention on the Dollar Tree brand and its growth opportunities.
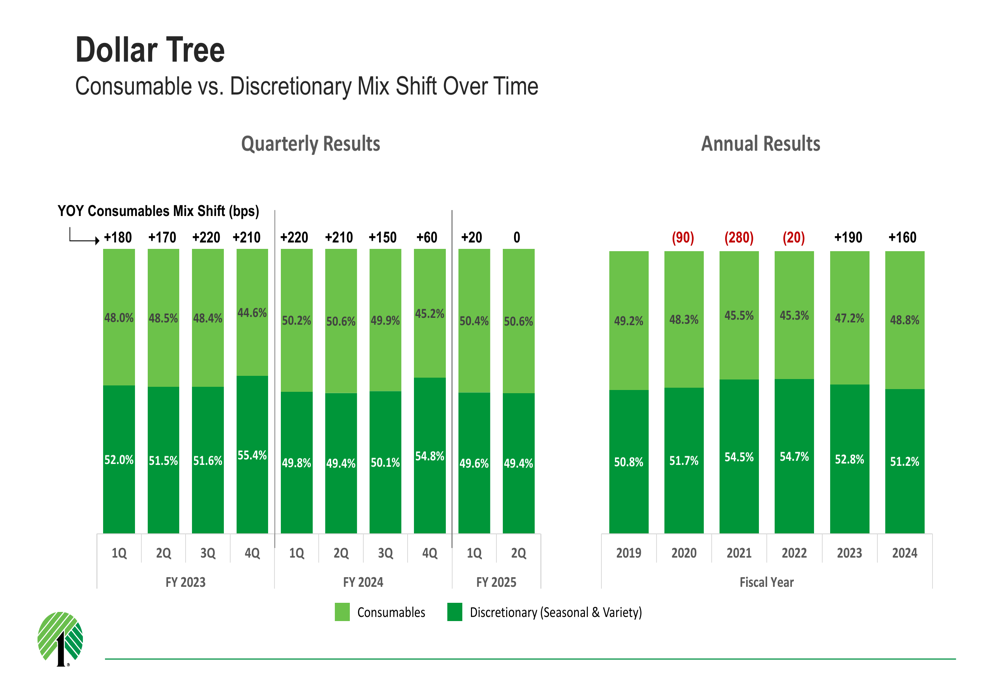
The retailer’s product mix continues to evolve, with a strategic balance between consumables and discretionary items. This mix shift is illustrated in the following chart:
With its streamlined business model, strong comparable sales growth, and aggressive store expansion plans, Dollar Tree appears well-positioned to capitalize on consumer demand for value in the current economic environment.
Full presentation:
This article was generated with the support of AI and reviewed by an editor. For more information see our T&C.