How are energy investors positioned?

DXC Technology Co (NYSE:DXC) shares plunged 12.62% in after-hours trading following the release of its fourth-quarter fiscal year 2025 results on May 14, 2025, as investors reacted to continued revenue declines despite improvements in bookings and cash flow metrics.
Quarterly Performance Highlights
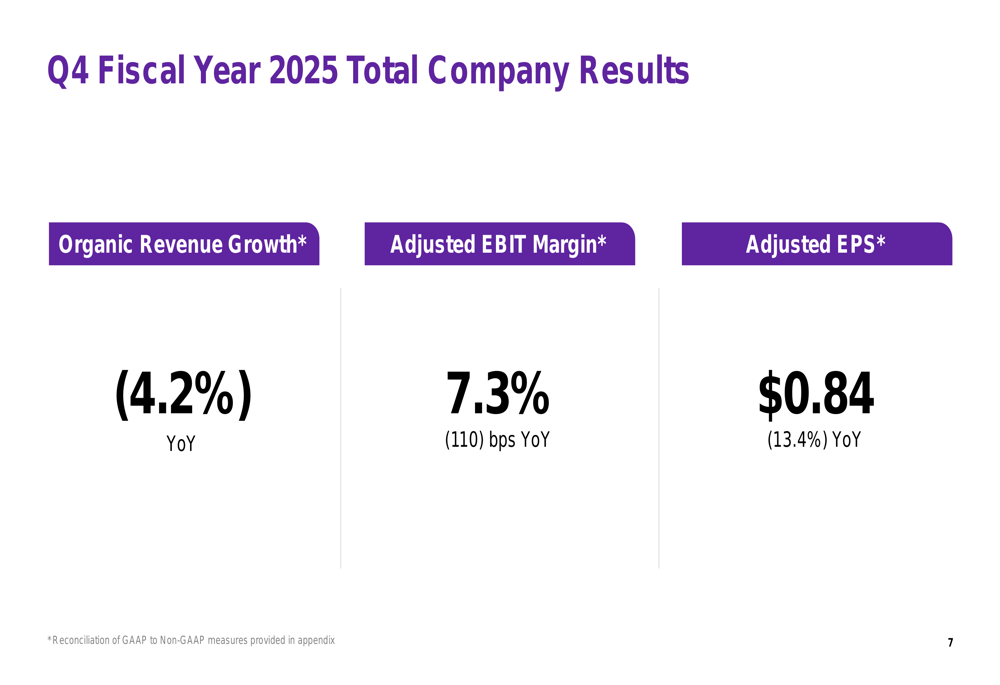
The technology services company reported an organic revenue decline of 4.2% year-over-year for Q4 FY2025, with adjusted EBIT margin contracting to 7.3%, down 110 basis points from the same period last year. Adjusted earnings per share fell 13.4% year-over-year to $0.84.
These results reflect a continuation of the challenging revenue environment DXC has faced in recent quarters, with the Q4 performance showing a deterioration from the 5.6% revenue decline reported in Q2 FY2025.
As shown in the following company-wide performance summary:
Segment Analysis
DXC’s Global Business Services (GBS) segment, which includes consulting, engineering services, and insurance software, posted revenue of $1.63 billion with an organic revenue decline of 2.4% year-over-year. The segment maintained a relatively healthy profit margin of 10.9% and achieved a book-to-bill ratio of 1.16x, indicating potential future revenue growth.
The segment breakdown reveals:
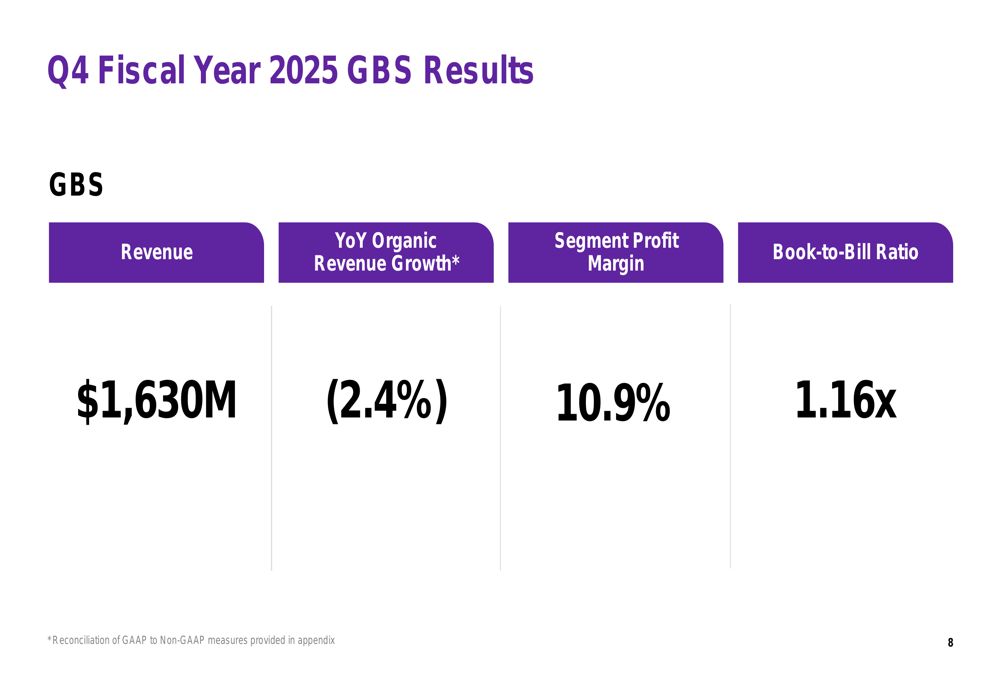
Within GBS, the Insurance Software (ETR:SOWGn) & BPS offering was a bright spot, growing 2.7% organically, while Consulting & Engineering Services declined by 3.9%.
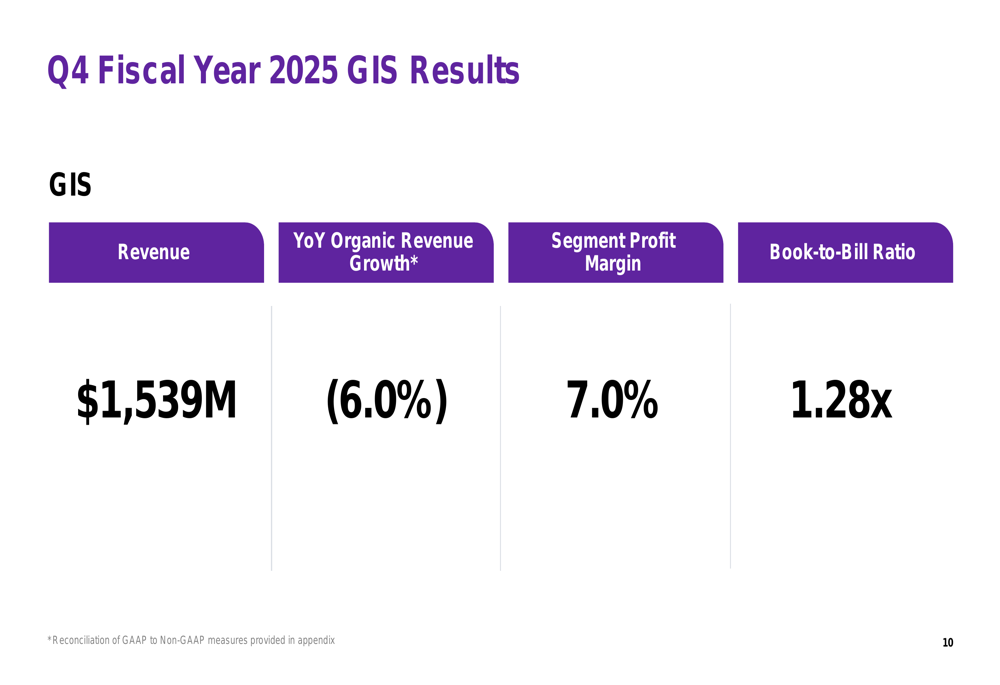
The Global Infrastructure Services (GIS) segment experienced a more significant organic revenue decline of 6.0% year-over-year, with revenue of $1.54 billion. Despite the revenue challenges, the segment achieved a profit margin of 7.0% and a strong book-to-bill ratio of 1.28x.
The GIS performance metrics are illustrated here:
Bookings and Cash Flow Improvements
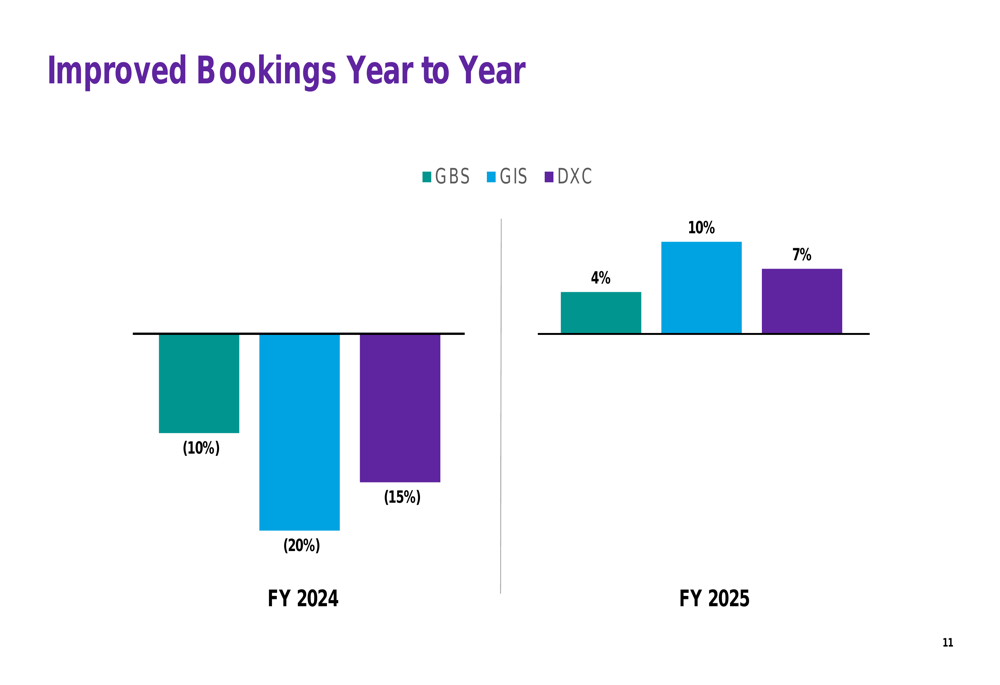
A key positive development for DXC was the significant improvement in bookings compared to the previous fiscal year. After experiencing double-digit declines in bookings during FY2024, the company achieved positive booking growth across both segments in FY2025, with GBS bookings up 4%, GIS bookings up 10%, and total company bookings up 7%.
This bookings turnaround is visualized in the following chart:
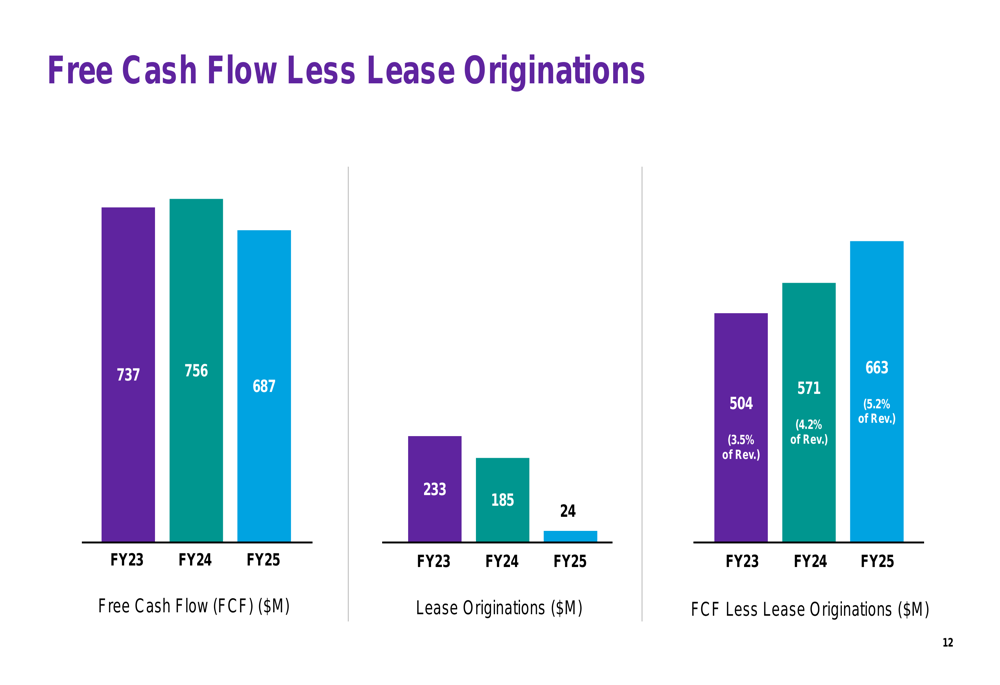
DXC’s free cash flow for FY2025 was $687 million, down from $756 million in FY2024. However, when accounting for lease originations, which decreased substantially from $185 million in FY2024 to just $24 million in FY2025, the company’s free cash flow less lease originations improved to $663 million (5.2% of revenue) from $571 million (4.2% of revenue) in the previous year.
The free cash flow trends are illustrated in this chart:
Balance Sheet Strengthening
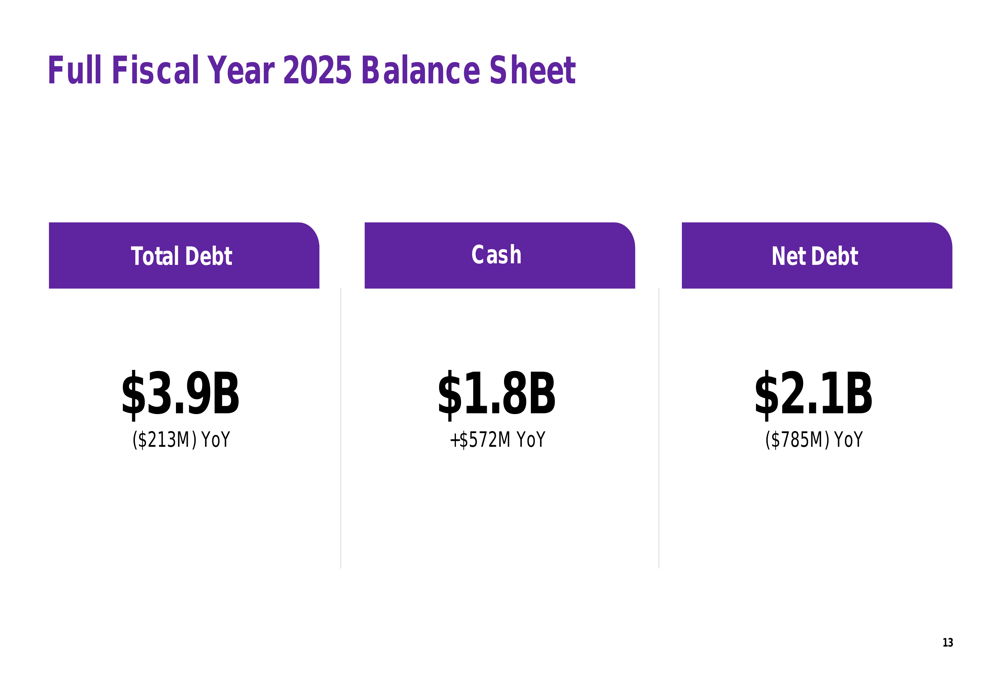
DXC made significant progress in strengthening its balance sheet during FY2025. The company reduced its total debt by $213 million year-over-year to $3.9 billion, while increasing its cash position by $572 million to $1.8 billion. As a result, net debt decreased by $785 million to $2.1 billion.
This balance sheet improvement is summarized here:
Forward Guidance and Outlook
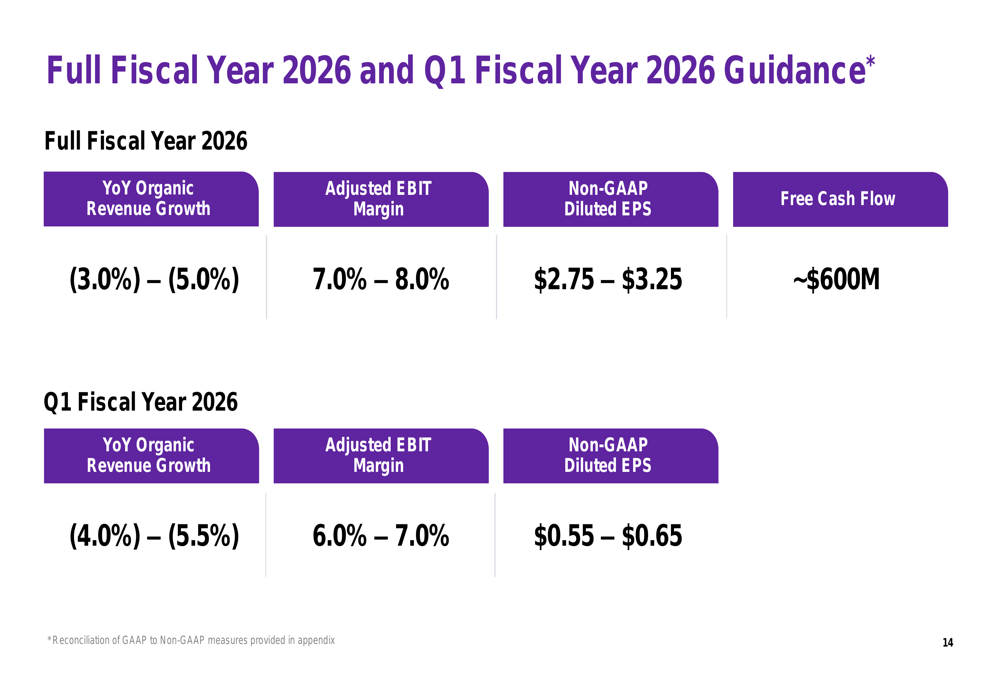
Looking ahead, DXC provided guidance for both Q1 and the full fiscal year 2026 that suggests continued revenue challenges but potential stabilization in margins. For FY2026, the company expects:
- Organic revenue growth of -3.0% to -5.0%
- Adjusted EBIT margin of 7.0% to 8.0%
- Non-GAAP diluted EPS of $2.75 to $3.25
- Free cash flow of approximately $600 million
For Q1 FY2026, DXC forecasts:
- Organic revenue growth of -4.0% to -5.5%
- Adjusted EBIT margin of 6.0% to 7.0%
- Non-GAAP diluted EPS of $0.55 to $0.65
The complete guidance is presented in this slide:
Market Context and Strategic Position
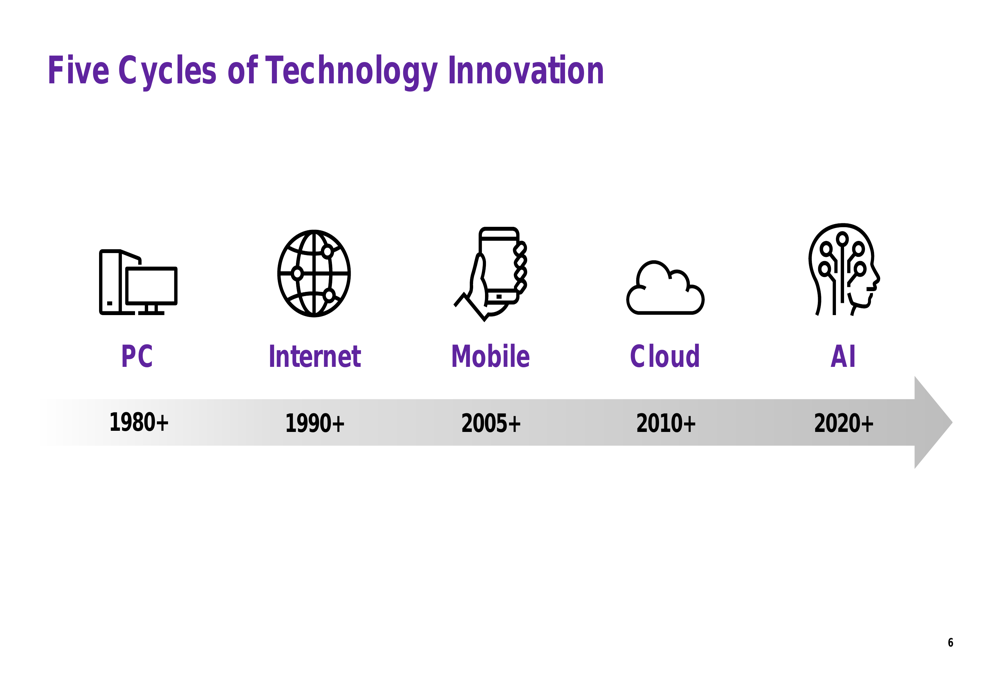
DXC’s presentation positioned the company within the context of five major technology innovation cycles, with artificial intelligence representing the current cycle beginning in 2020. This strategic framing suggests the company is working to align its services with emerging technologies amid its ongoing transformation.
The technology innovation cycles are illustrated here:
Despite the improvements in bookings and balance sheet metrics, investors appeared to focus on the continued revenue declines and the guidance for further contraction in FY2026. The sharp after-hours stock decline of 12.62% to $14.47 reflects market disappointment, particularly as the stock had already been trading near its 52-week low of $13.44 prior to the earnings release.
The company’s challenge moving forward will be to convert its improved bookings into revenue growth while maintaining margin discipline and cash flow generation. The significant gap between the stock’s current price and its 52-week high of $24.83 highlights the market’s ongoing concerns about DXC’s ability to successfully navigate its transformation in an increasingly competitive technology services landscape.
Full presentation:
This article was generated with the support of AI and reviewed by an editor. For more information see our T&C.