Oil prices rebound sharply on smaller-than-feared OPEC+ output hike

Eagle Point Credit Company (NYSE:ECC) released its Q2 2025 quarterly update presentation on August 12, 2025, highlighting strong portfolio cash distributions and maintaining its high-yield monthly distribution rate despite a decline in net asset value (NAV) compared to previous quarters.
Executive Summary
Eagle Point Credit Company, which completed its IPO in October 2014, reported total portfolio cash distributions of $88.15 million for Q2 2025. The company continues to pay a monthly distribution of $0.14 per share, representing a 24.4% distribution rate based on current market price. Since its IPO, ECC has paid cumulative distributions of $22.75 per share.
As shown in the following quarterly snapshot, the company received substantial distributions from its CLO equity investments:
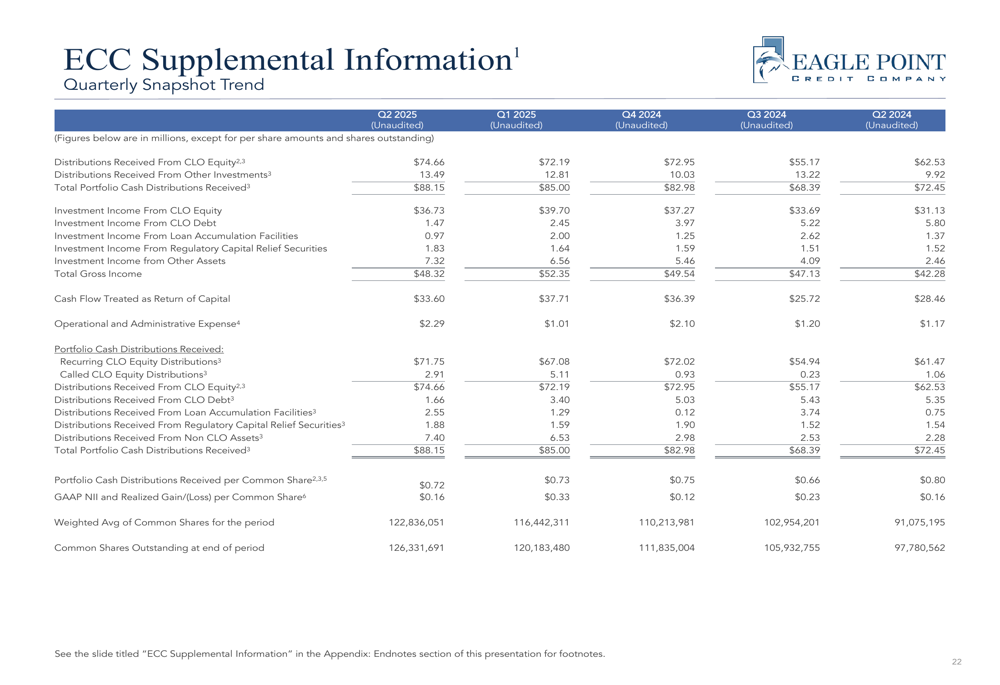
The company’s primary investment objective remains generating high current income through investments in CLO equity and junior debt tranches. As of Q2 2025, ECC reported a total market capitalization of $1.4 billion and over $12 billion in assets under management across the Eagle Point platform.
Quarterly Performance Highlights
For Q2 2025, ECC reported GAAP net investment income of $0.23 per share before non-recurring expenses, with a quarter-end NAV of $7.31 per share. The common share market price stood at $7.66 at period end, trading at a premium to NAV.
The company’s income statement and balance sheet highlights reveal key financial metrics across recent quarters:
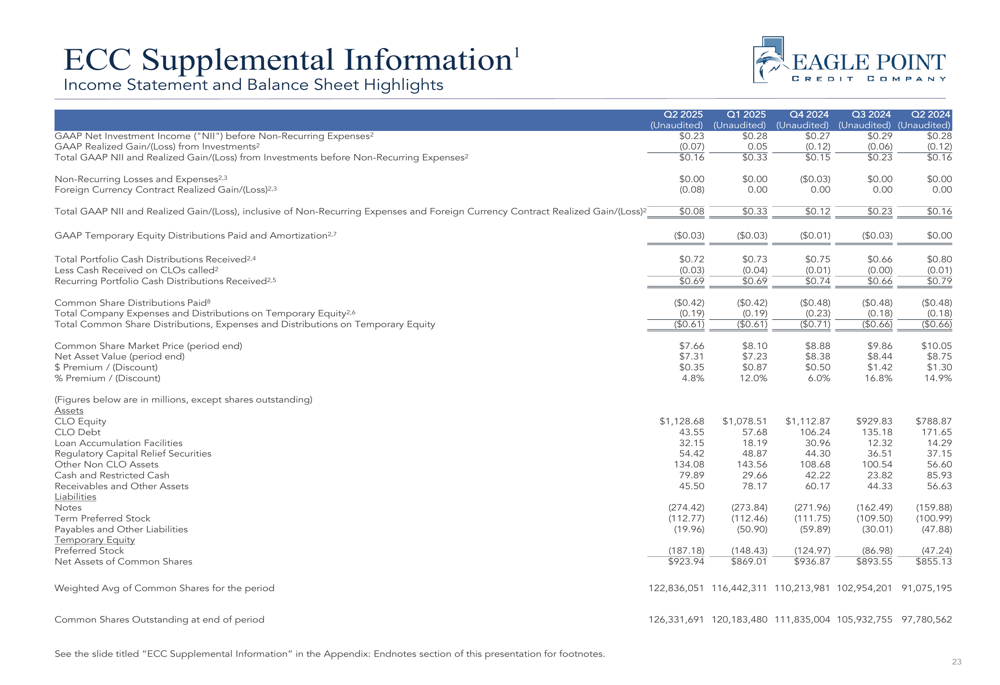
The NAV of $7.31 represents a decline from the $8.60 reported in Q3 2024, suggesting some deterioration in underlying asset values over the past several quarters. Despite this decline, the company has maintained its $0.14 monthly distribution, which may raise questions about distribution sustainability if NAV continues to decline.
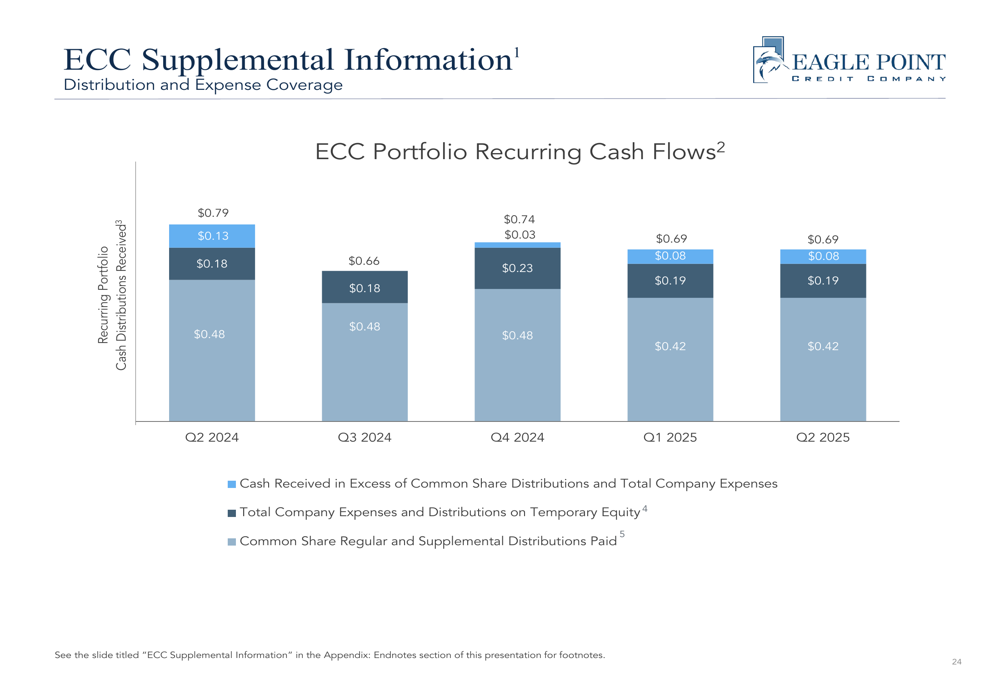
ECC’s portfolio recurring cash flows have remained relatively stable, though they show some fluctuation quarter to quarter:
Investment Strategy and Market Position
Eagle Point maintains a differentiated investment approach to CLO equity, which it describes as more akin to private equity than typical fixed income investing. The company focuses on proactively sourcing opportunities and taking significant stakes in CLO equity tranches.
The presentation highlights why CLO equity is an attractive asset class, noting historical performance data:
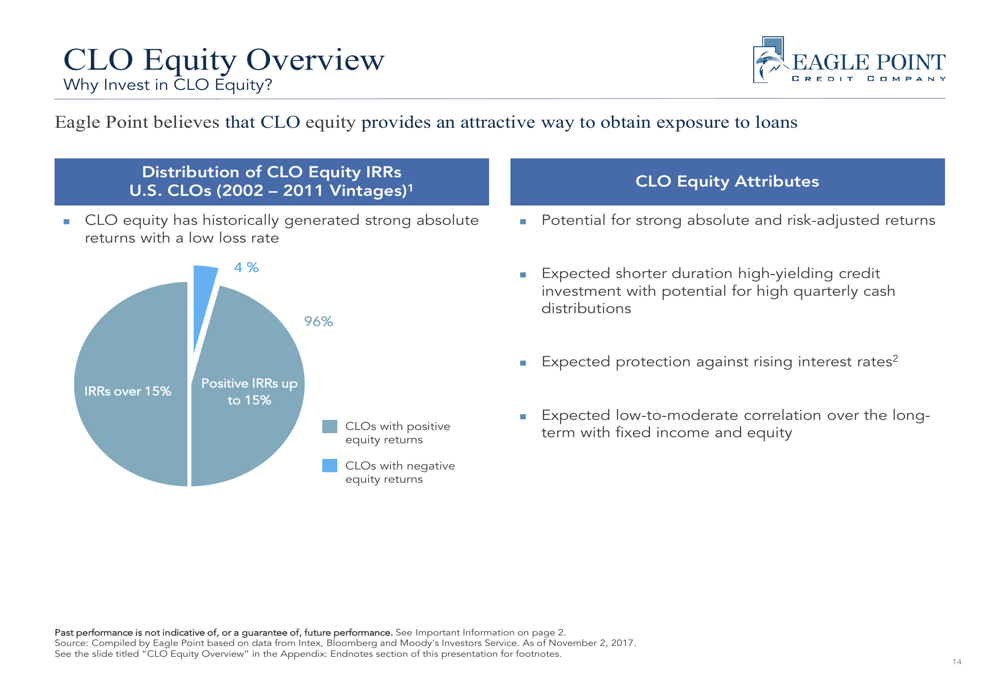
The company emphasizes that CLO equity has historically generated strong absolute returns with a low loss rate, with 96% of investments generating positive IRRs. The CLO market itself has shown significant growth, expanding at a 10% CAGR from 2018 to 2025 YTD:
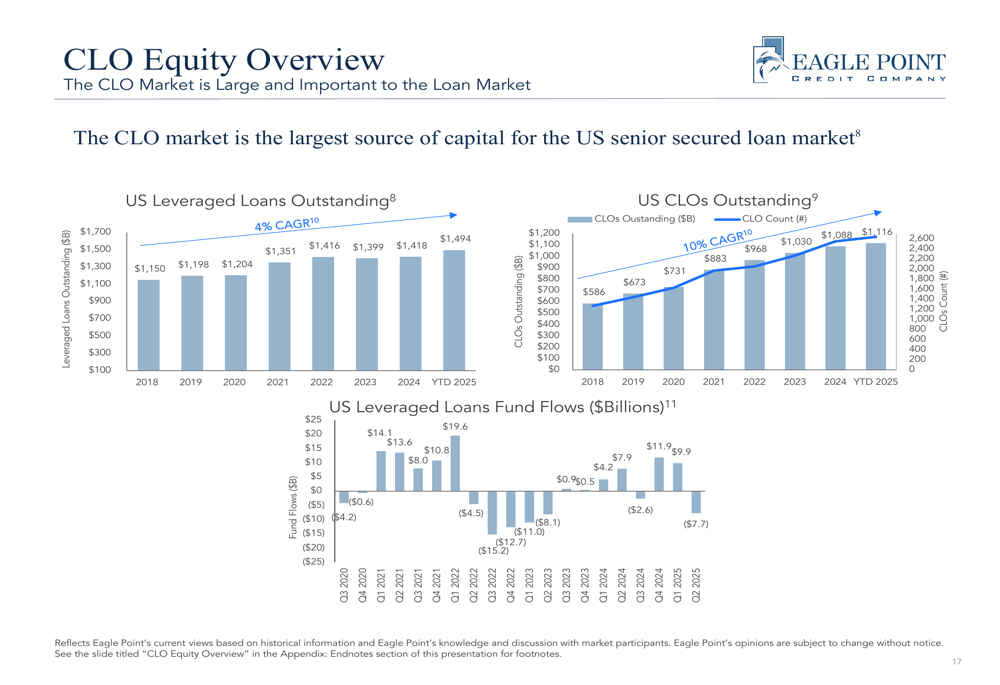
This growth outpaces the broader leveraged loan market, which has grown at a 4% CAGR during the same period. The company notes that CLOs have become the largest source of capital for the US senior secured loan market.
Portfolio Analysis
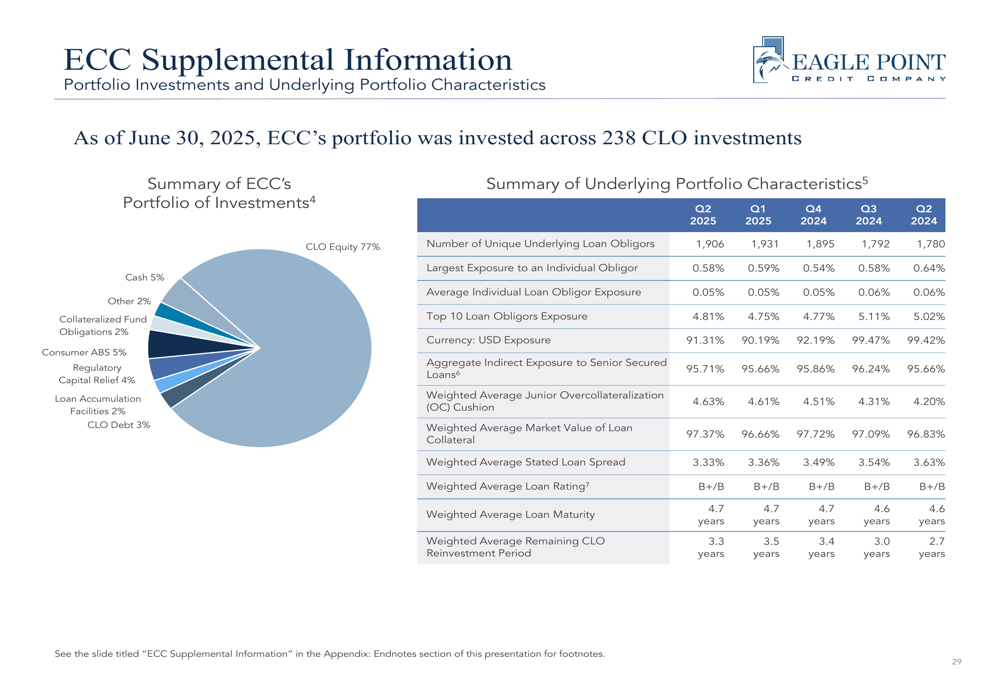
ECC’s portfolio remains well-diversified across 1,906 unique underlying loan obligors, with the largest exposure to an individual obligor at just 0.58%. The portfolio maintains a 95.71% aggregate indirect exposure to senior secured loans, with a weighted average remaining CLO reinvestment period of 3.3 years.
The following slide details the key portfolio and loan characteristics:
The company’s top industry exposures show a concentration in technology, healthcare, and hospitality sectors:
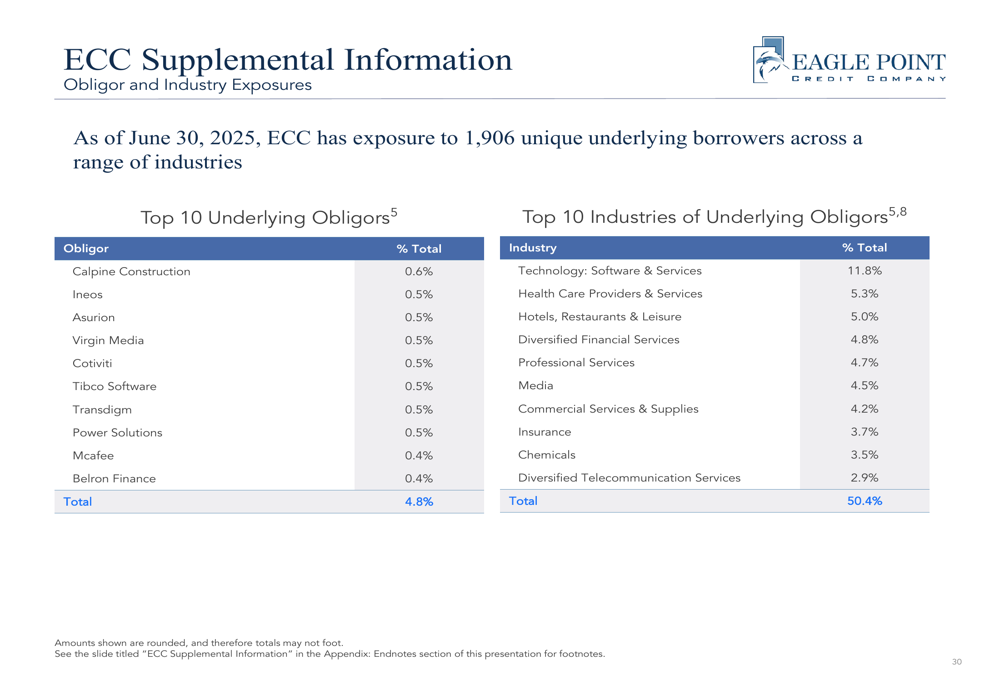
This diversification helps mitigate risk, though the technology sector exposure at 11.8% represents a significant concentration relative to other industries.
Forward-Looking Statements
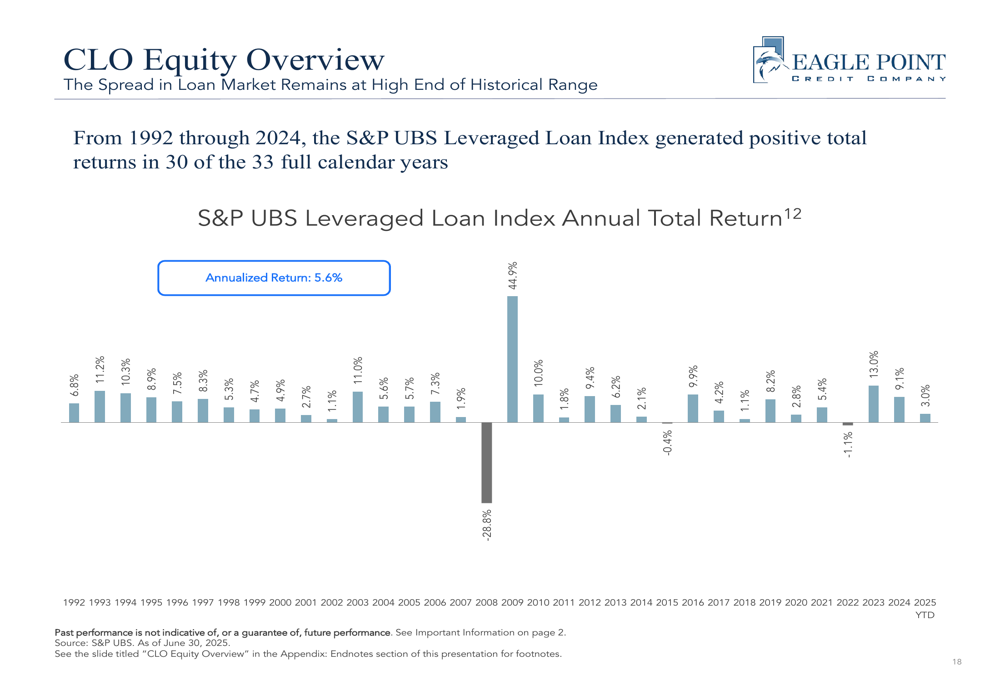
Eagle Point remains optimistic about the CLO market, highlighting the historical performance of the S&P UBS Leveraged Loan Index, which has generated positive total returns in 30 of the past 33 full calendar years:
The company emphasizes several key statistics that summarize its investment approach and portfolio characteristics:
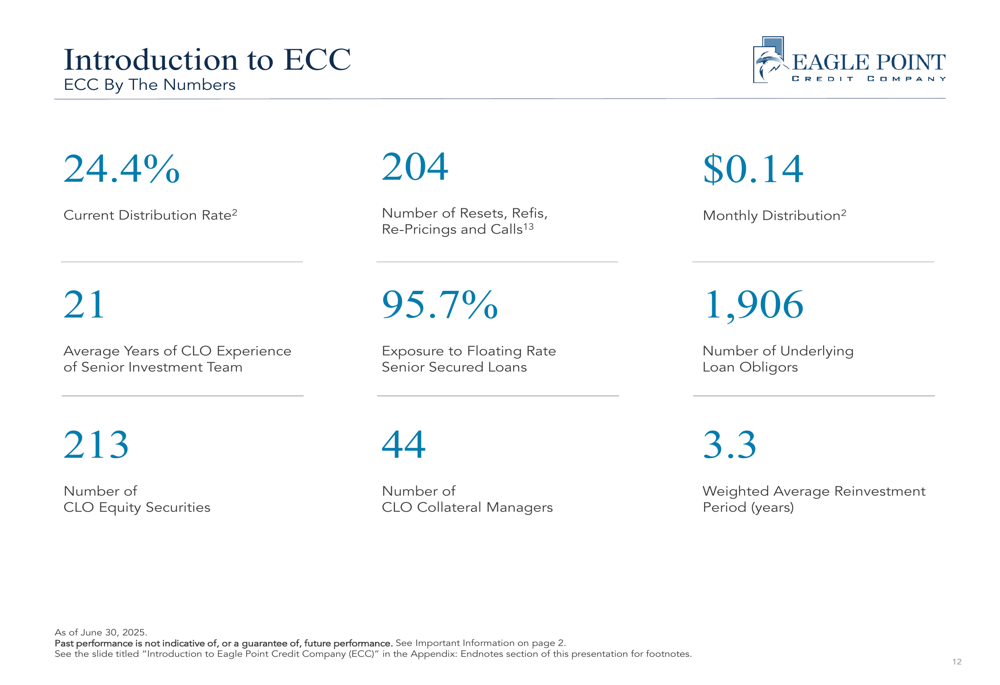
Looking ahead, ECC’s strategy continues to focus on maintaining a long reinvestment period (currently 3.3 years weighted average) to navigate market volatility. The company’s loan maturity profile shows limited near-term maturities, with only 1.6% of underlying loans maturing prior to 2027.
In the context of recent performance, investors should note that while the Q2 2025 presentation shows strong cash flows, there has been a decline in NAV compared to previous quarters. The company’s ability to maintain its high distribution rate of 24.4% will depend on continued strong performance from its CLO portfolio and stable market conditions in the leveraged loan market.
With premarket trading showing ECC at $6.24 on August 12, 2025, down slightly from the previous close of $6.25, investors appear cautious despite the company’s high distribution yield. This current market price represents a significant discount to the Q2 2025 reported NAV of $7.31, suggesting investor concerns about NAV sustainability or distribution coverage.
Full presentation:
This article was generated with the support of AI and reviewed by an editor. For more information see our T&C.