Bitcoin price today: struggles at $111k as trade tensions, risk aversion weigh

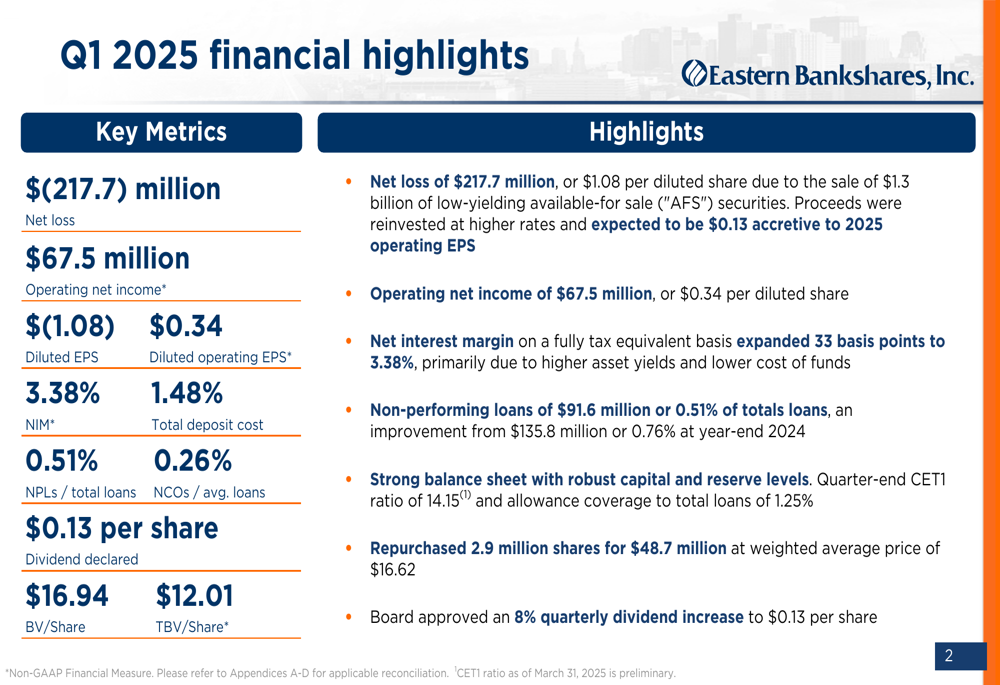
Eastern Bankshares Inc (NASDAQ:EBC) reported a net loss of $217.7 million for the first quarter of 2025, primarily due to a strategic sale of $1.3 billion in low-yielding available-for-sale securities. Despite the headline loss, the bank’s operating performance showed improvement across key metrics, according to its April 24 earnings presentation.
Executive Summary
The bank’s Q1 results reflected a tale of two narratives: a significant GAAP net loss of $1.08 per share driven by the securities sale, alongside solid operating net income of $67.5 million, or $0.34 per diluted share. Management indicated the securities restructuring is expected to be $0.13 accretive to 2025 operating EPS.
Eastern Bankshares also reported expansion in net interest margin to 3.38%, a decrease in non-performing loans, and maintained strong capital ratios. The board approved an 8% quarterly dividend increase to $0.13 per share, while the bank repurchased 2.9 million shares for $48.7 million during the quarter.
As shown in the following comprehensive overview of key metrics from the presentation:
Quarterly Performance Highlights
Eastern’s net interest income reached $188.9 million in Q1 2025, up from $179.2 million in the previous quarter and $129.9 million in the same period last year. This growth contributed to the expansion of net interest margin by 33 basis points to 3.38%.
The income statement reveals the significant impact of the securities sale, with a noninterest loss of $236.1 million compared to noninterest income of $37.3 million in Q4 2024:
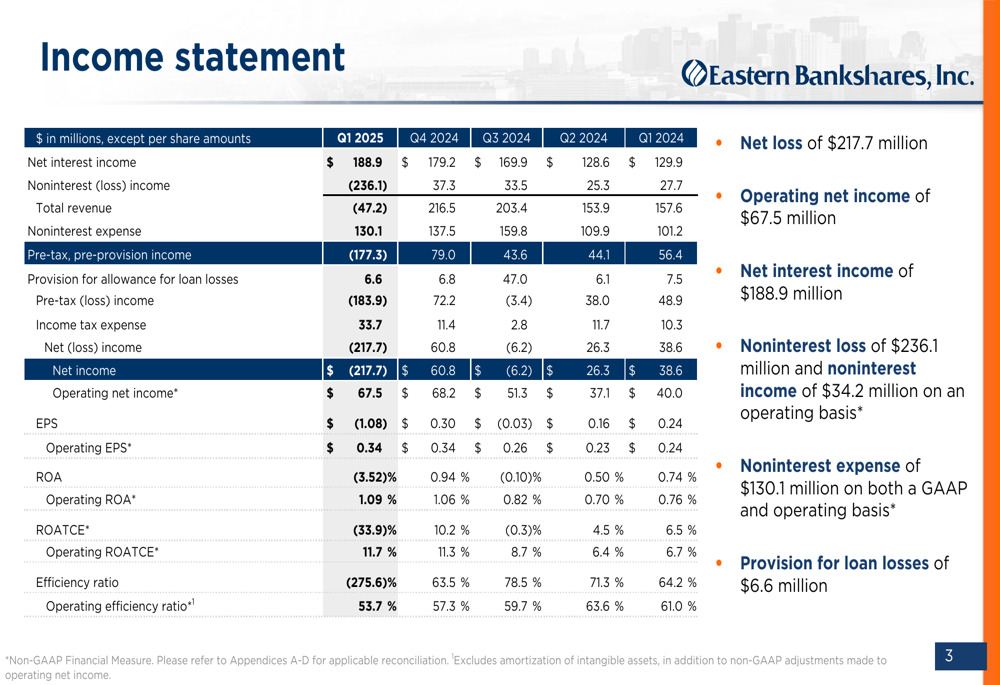
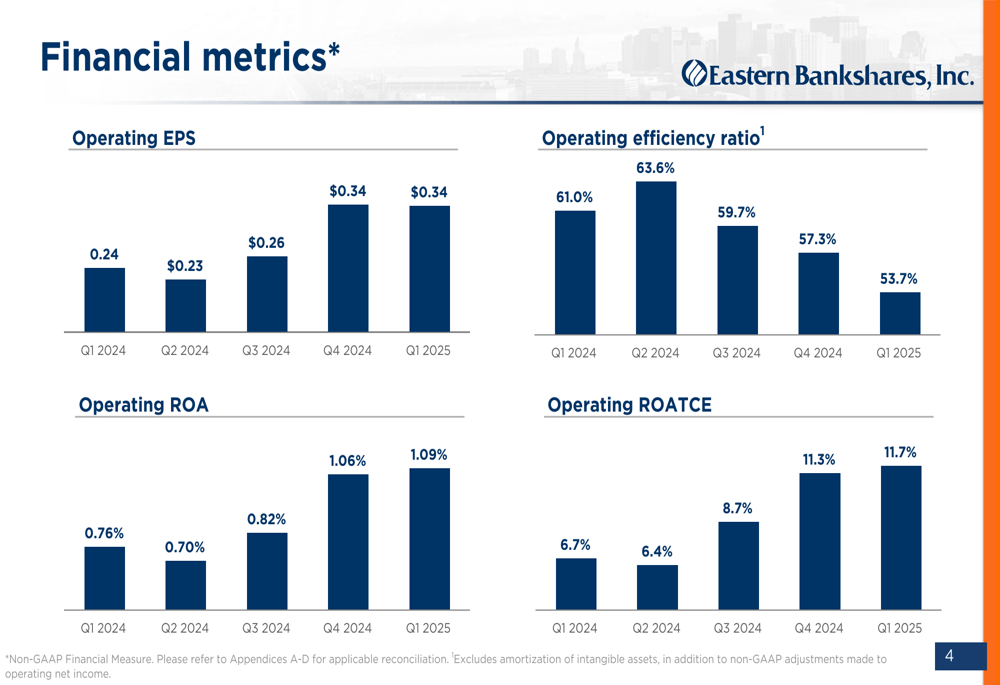
Operating efficiency continued to improve, with the efficiency ratio decreasing to 53.7% from 57.3% in the previous quarter. Similarly, operating return on average assets (ROA) increased to 1.09% from 1.06%, while operating return on average tangible common equity (ROATCE) rose to 11.7% from 11.3%.
The following chart illustrates these positive trends in key performance metrics:
Strategic Initiatives
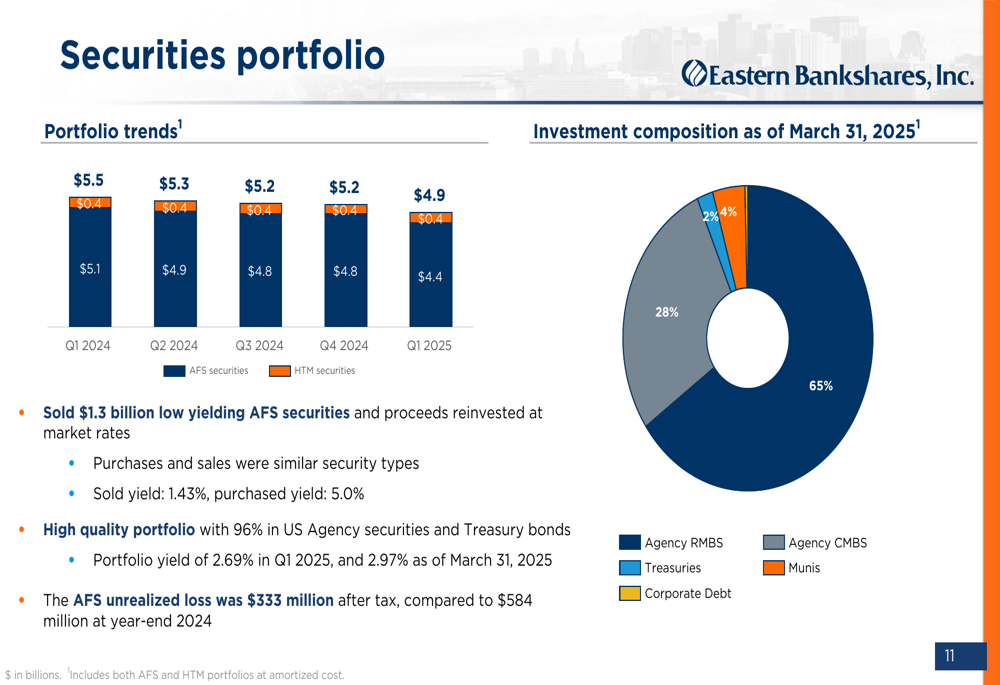
The most significant strategic action during the quarter was the sale of $1.3 billion in low-yielding available-for-sale securities, resulting in a loss of $269.6 million. Management explained that proceeds are being reinvested at market rates and are expected to contribute $0.13 to 2025 operating EPS.
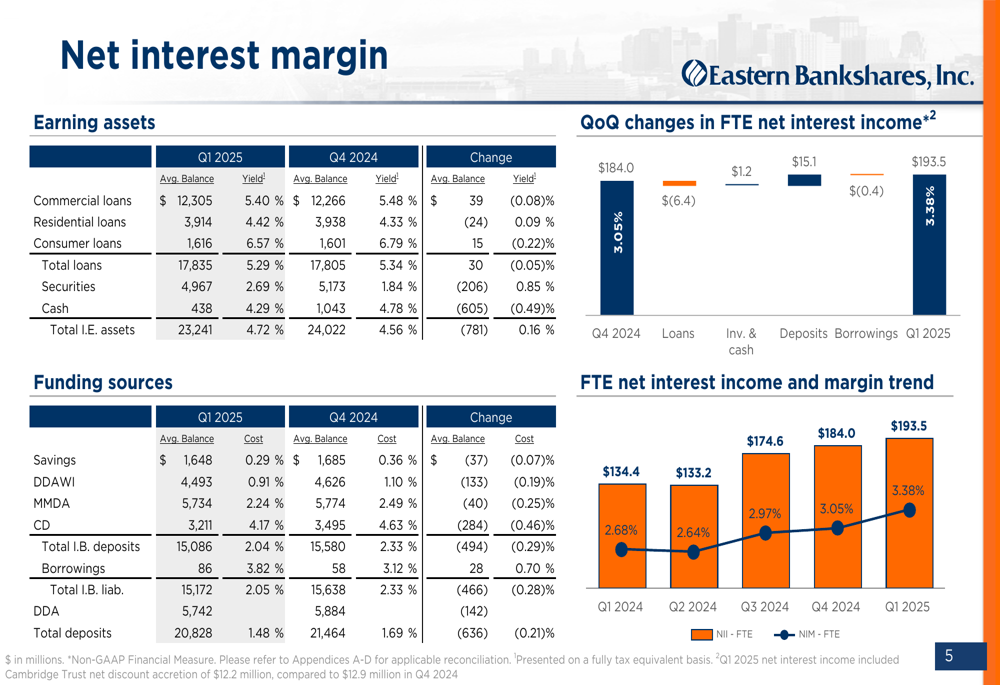
The net interest margin detail shows how the bank is managing its earning assets and funding sources to improve profitability:
Eastern’s securities portfolio remains high quality, with 96% invested in U.S. Agency securities and Treasury bonds. After the strategic sale, the AFS portfolio decreased to $4.4 billion from $4.8 billion at year-end 2024:
Deposit and Loan Trends
Total (EPA:TTEF) deposits decreased by $522 million quarter-over-quarter to $20.8 billion, while deposit costs improved, decreasing 21 basis points to 1.48%. The bank maintained a favorable deposit mix with 50% in checking accounts.
Loans increased by $125 million or 3% annualized in the quarter, reaching $18.2 billion. Commercial loans grew by $142 million, while residential loans decreased by $25 million and consumer loans increased by $8 million.
Asset Quality & Capital Position
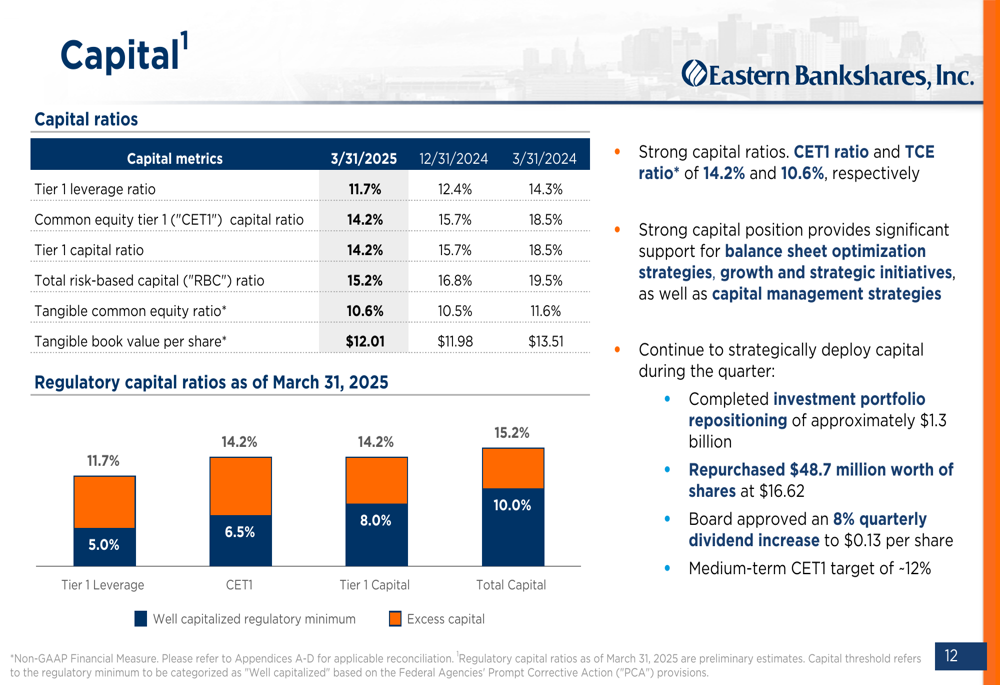
Asset quality metrics showed improvement, with non-performing loans decreasing to $91.6 million (0.51% of total loans) from $135.8 million at year-end 2024. The bank maintains strong capital ratios, with a CET1 ratio of 14.2% and tangible common equity ratio of 10.6%.
The following slide details Eastern’s capital position:
Commercial real estate (CRE) exposure remains a focus area, with the bank’s $7.2 billion CRE portfolio having a weighted average loan-to-value ratio in the low-to-mid 50% range. Office exposure, a particular concern in the current market, totals $876 million with 46% in mixed-use or medical office properties.
Market Context
Eastern Bankshares stock closed at $15.48 on April 24, 2025, rising 2% on the day of the earnings release. The stock has traded between $12.54 and $19.40 over the past 52 weeks. In aftermarket trading, shares slipped slightly by 0.32% to $15.74.
The Q1 2025 operating EPS of $0.34 matches the figure reported in Q3 2024, suggesting flat sequential performance on this metric. However, the net interest margin has continued to expand significantly from 2.97% in Q3 2024 to 3.38% in Q1 2025, reflecting the bank’s improving core profitability.
Forward-Looking Statements
Management expressed confidence that the strategic securities restructuring will enhance future earnings, with the expected $0.13 accretion to 2025 operating EPS. The strong capital position, with CET1 and TCE ratios of 14.2% and 10.6% respectively, provides significant support for continued balance sheet optimization.
The bank’s wealth management division, with $8.4 billion in assets under management, represents a diversified revenue stream with fees generated at approximately 75 basis points of AUM. The division’s asset allocation remains primarily in equities (61%) and fixed income (30%).
Eastern Bankshares continues to strategically deploy capital through share repurchases and dividend increases, while maintaining strong reserve coverage and capital ratios to navigate potential economic uncertainties.
Full presentation:
This article was generated with the support of AI and reviewed by an editor. For more information see our T&C.