Nvidia among investors in xAI’s $20 bln capital raise- Bloomberg

Enerpac Tool Group Corp (NYSE:EPAC) reported a return to organic growth in its third quarter fiscal 2025 earnings presentation released on June 27, 2025. The industrial tools manufacturer posted 2% organic growth after a challenging second quarter, though regional performance varied significantly and the company now expects results in the lower half of its previously announced guidance range.
Quarterly Performance Highlights
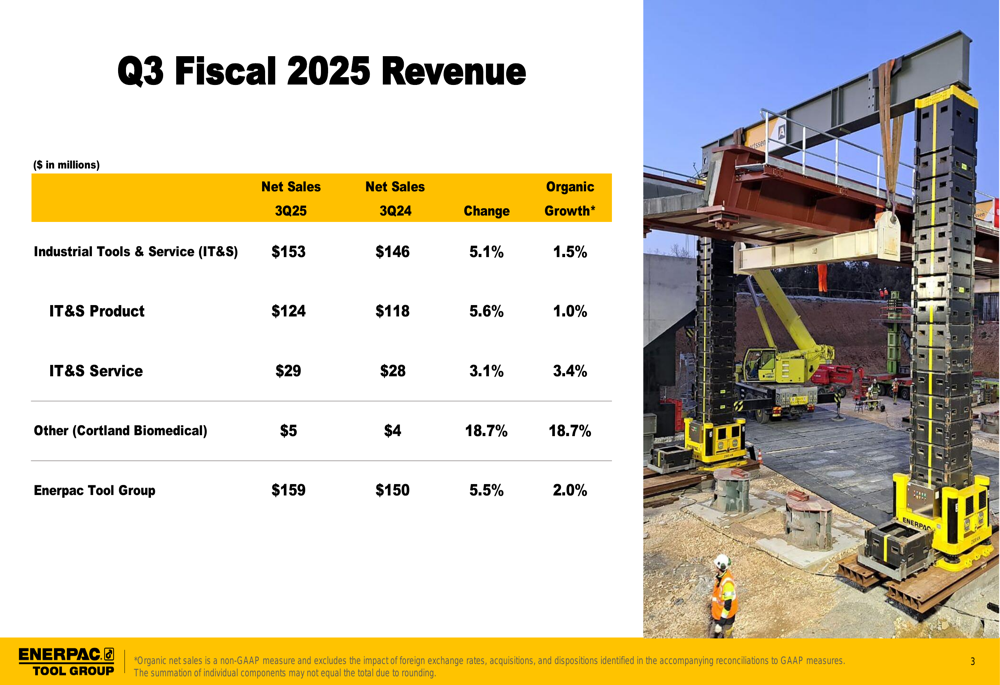
Enerpac reported Q3 FY25 net sales of $159 million, representing a 5.5% increase compared to $150 million in the same period last year. Organic growth, which excludes currency effects and acquisitions, was 2.0% for the quarter.
"We believe our performance continues to reflect above market growth and strong execution in what remains a very soft industrial sector," CEO Paul Sternleve had noted during the company’s previous earnings call.
The Industrial Tools & Services (IT&S) segment, which represents the bulk of Enerpac’s business, delivered net sales of $153 million, up 5.1% year-over-year with organic growth of 1.5%. Within this segment, product sales grew 5.6% to $124 million while service revenue increased 3.1% to $29 million.
As shown in the following revenue breakdown:
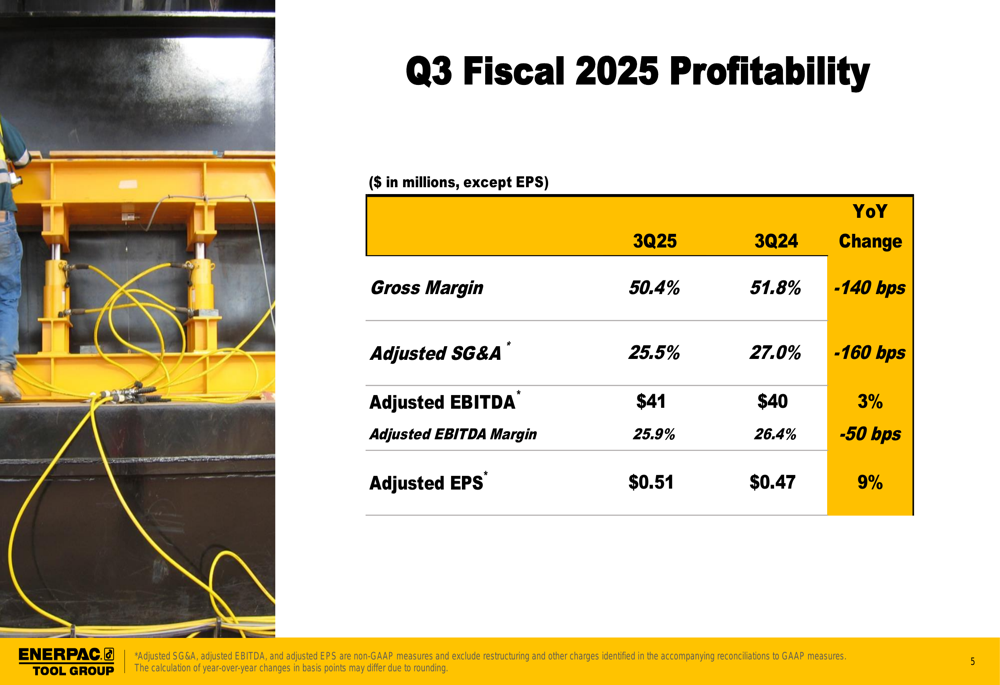
On the profitability front, Enerpac reported Q3 adjusted earnings per share of $0.51, a 9% increase from $0.47 in Q3 FY24, despite some margin pressure. Gross margin declined 140 basis points to 50.4%, while adjusted EBITDA margin contracted 50 basis points to 25.9%. The company partially offset these pressures through improved operational efficiency, reducing adjusted SG&A as a percentage of sales by 160 basis points to 25.5%.
The following chart illustrates the key profitability metrics:
Regional Performance Analysis
Enerpac’s performance varied significantly by region in the third quarter. The Americas delivered high single-digit growth, continuing the strong momentum from previous quarters. However, the EMEA (Europe, Middle East, and Africa) region, which accounts for 41% of IT&S sales, experienced a high single-digit decline, reversing the low double-digit growth seen in the same quarter last year. The Asia-Pacific region showed mid-single-digit growth, recovering from a low double-digit decline in Q3 FY24.
This regional disparity is clearly illustrated in the following chart:
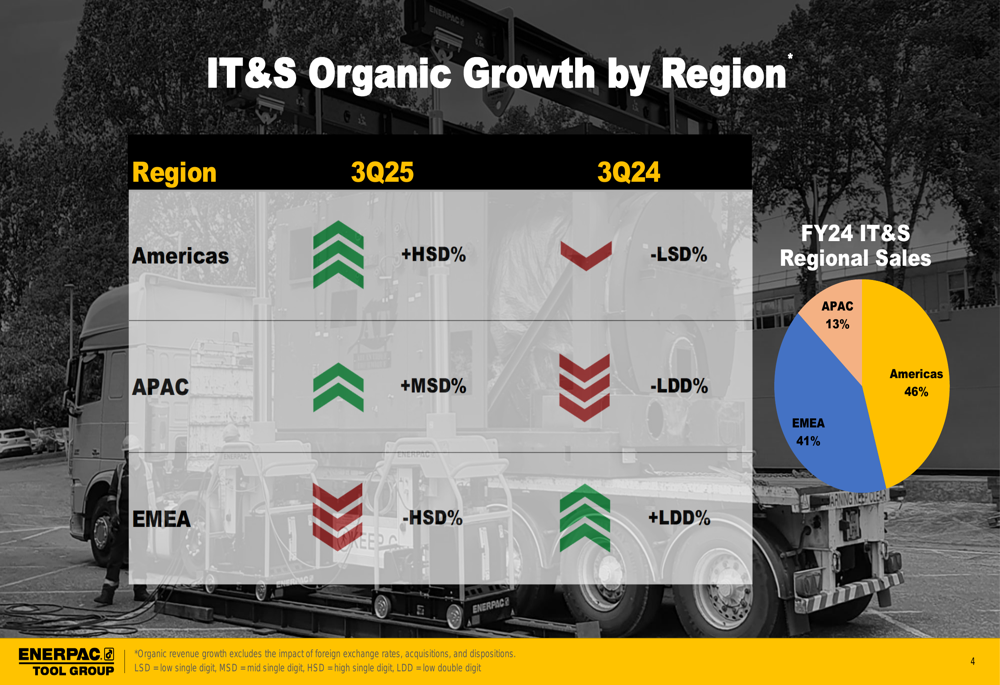
The contrasting regional performance reflects both macroeconomic conditions and specific market dynamics. The Americas region has been a consistent bright spot for Enerpac, while European markets have faced increasing headwinds. This aligns with broader industrial sector trends, where North American manufacturing has shown more resilience than European counterparts.
Tariff Impact and Mitigation
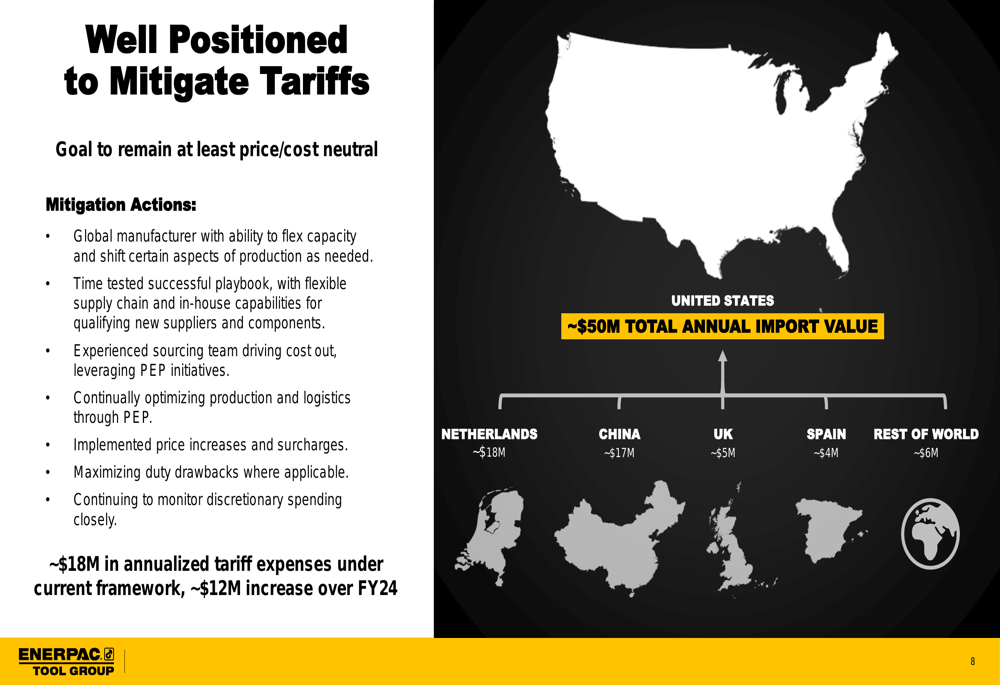
A significant focus of Enerpac’s presentation was the company’s strategy to address increasing tariff pressures. The company expects approximately $18 million in annualized tariff expenses under the current framework, representing a $12 million increase over FY24 levels.
Enerpac outlined several mitigation strategies, including leveraging its global manufacturing footprint, implementing price increases and surcharges, and optimizing production. The company’s goal is to remain at least price/cost neutral despite these headwinds.
The following slide details Enerpac’s tariff mitigation approach and global import value distribution:
Capital Allocation and Innovation Strategy
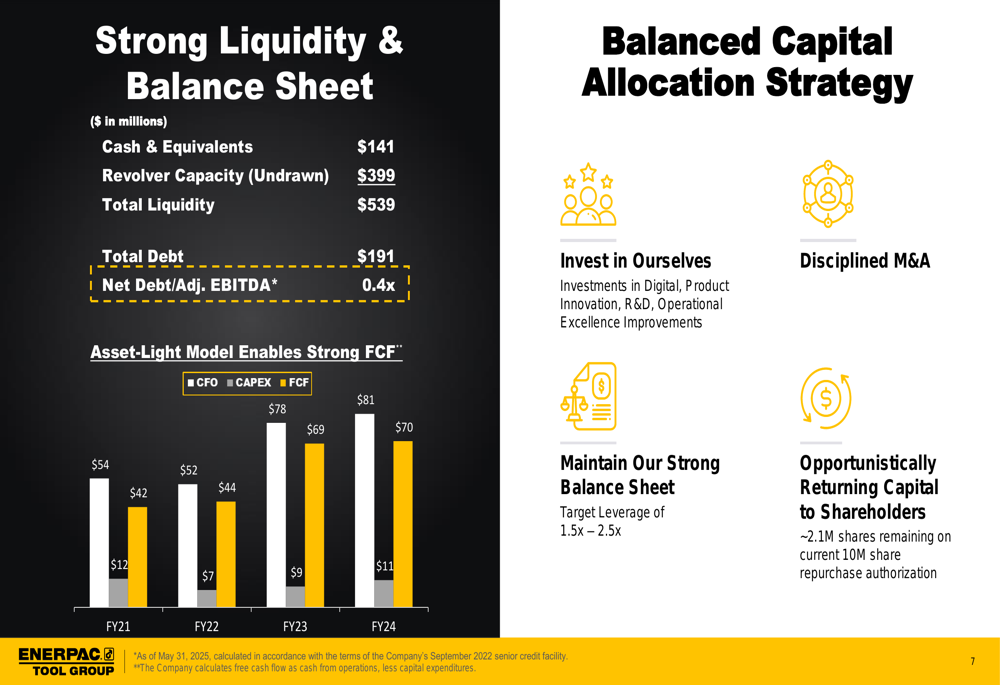
Enerpac highlighted its strong financial position, with $141 million in cash and equivalents, $399 million in undrawn revolver capacity, and a low net debt to adjusted EBITDA ratio of 0.4x. This financial flexibility supports the company’s balanced capital allocation strategy focused on internal investment, disciplined M&A, and opportunistic share repurchases.
The company’s asset-light business model has enabled strong free cash flow generation, as illustrated in the following slide:
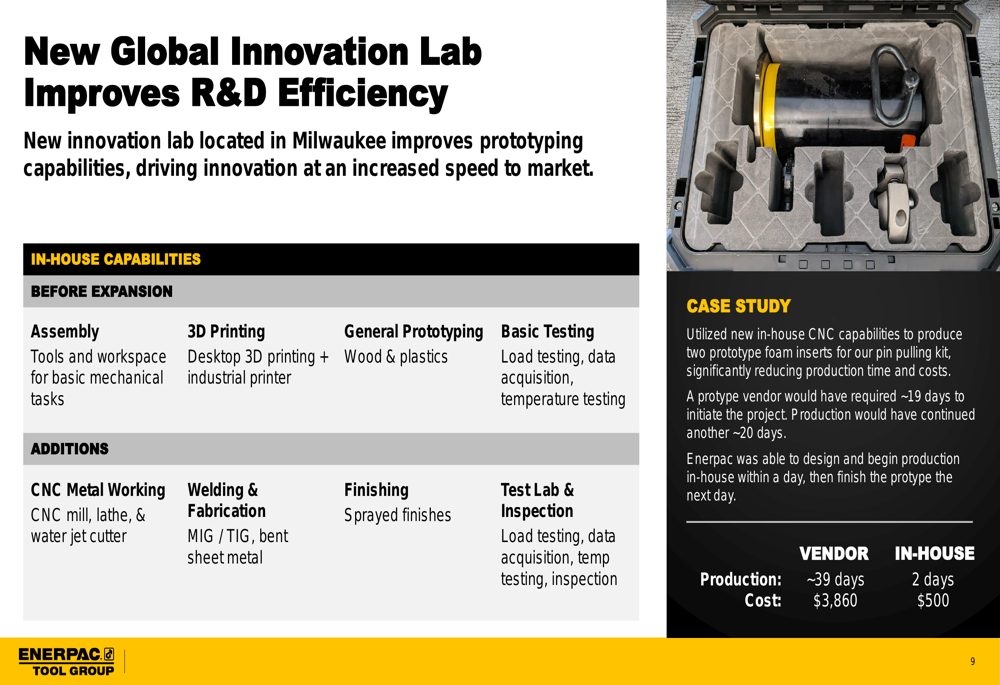
Enerpac also showcased its new global innovation lab in Milwaukee, which is designed to improve R&D efficiency and accelerate time to market. The facility enhances in-house capabilities including CNC metal working, welding, fabrication, and testing.
A case study presented in the earnings slides demonstrated how the new lab reduced prototype production time from 39 days to just 2 days, while cutting costs from $3,860 to $500 for a specific component.
The innovation lab capabilities and benefits are detailed here:
Forward-Looking Statements
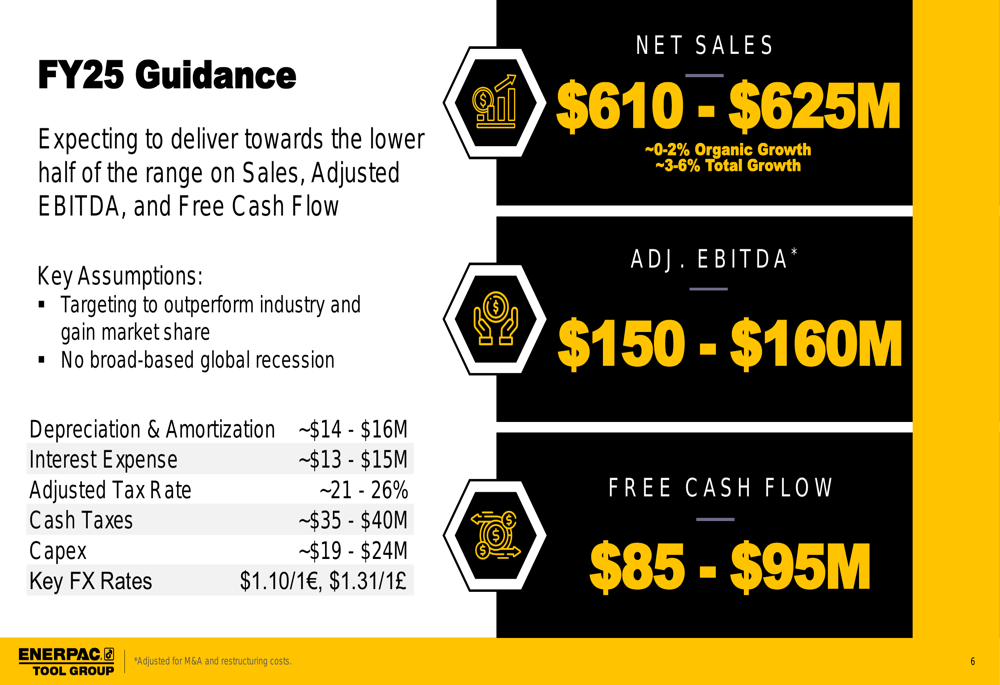
For fiscal year 2025, Enerpac maintained its previous guidance but indicated performance would likely be in the lower half of the projected ranges. The company expects:
- Net sales of $610-625 million (0-2% organic growth, 3-6% total growth)
- Adjusted EBITDA of $150-160 million
- Free cash flow of $85-95 million
The guidance is based on assumptions of outperforming the industry and gaining market share, with no broad-based global recession anticipated.
The detailed guidance is presented in the following slide:
Following its Q2 earnings release in March, Enerpac’s stock had surged 5.65% in after-hours trading, reflecting investor confidence despite mixed results. The company’s e-commerce business was a particular bright spot, growing 43% year-over-year according to previous earnings commentary.
As Enerpac navigates regional challenges and tariff pressures, its strong balance sheet, innovation investments, and established market position provide a foundation for weathering current headwinds while pursuing long-term growth opportunities. However, investors will likely focus on the company’s ability to maintain margins and deliver on its organic growth targets in what remains a challenging industrial environment.
Full presentation:
This article was generated with the support of AI and reviewed by an editor. For more information see our T&C.