Trump calls for Fed Governor Cook’s resignation over mortgage probe

Equinor ASA (NYSE:EQNR) reported strong financial results for the first quarter of 2025, driven primarily by higher European gas prices and increased US onshore production. The Norwegian energy giant presented its quarterly performance on April 30, highlighting robust cash flow generation while acknowledging challenges with its Empire Wind project.
Quarterly Performance Highlights
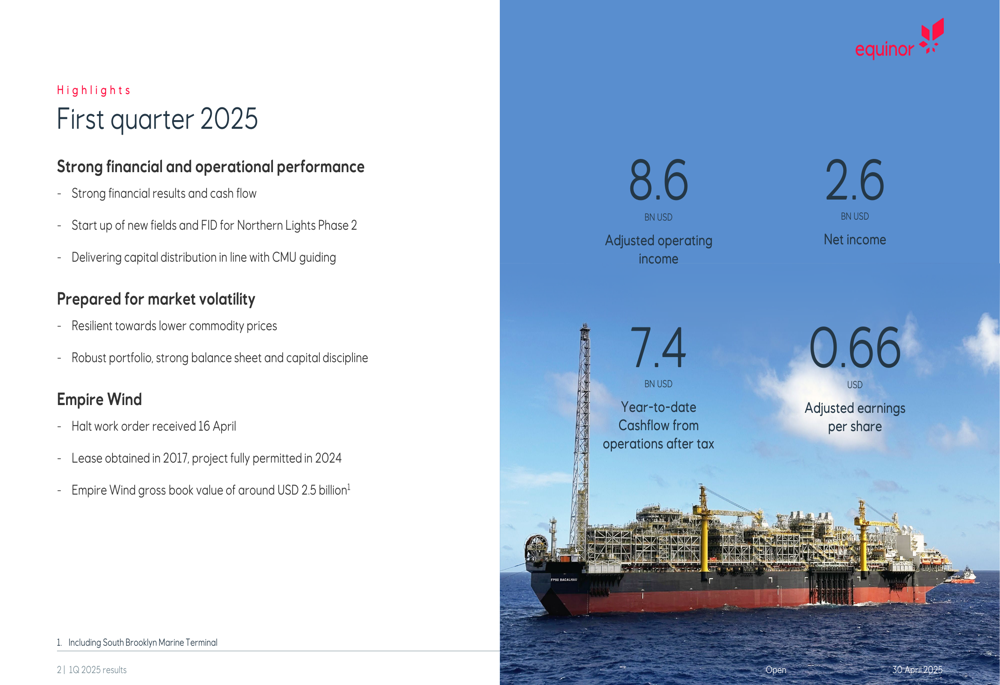
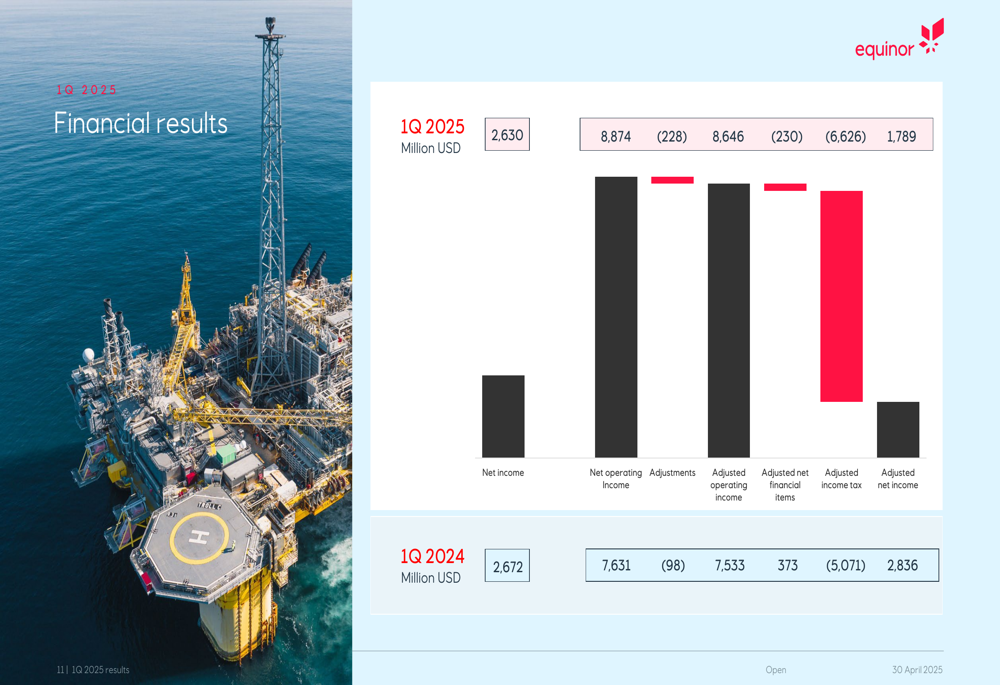
Equinor delivered an adjusted operating income of $8.6 billion for Q1 2025, up from $7.5 billion in the same period last year. Net income reached $2.6 billion, while cash flow from operations after tax amounted to $7.4 billion. The company reported adjusted earnings per share of $0.66.
"We delivered strong financial and operational performance in the first quarter, with robust cash flow generation despite market volatility," said Torgrim Reitan, Equinor’s Chief Financial Officer, during the presentation.
The company’s performance was bolstered by significantly higher European gas prices, which averaged $14.80 per mmbtu in Q1 2025 compared to $9.41 per mmbtu in Q1 2024. North American gas prices also improved, reaching $4.06 per mmbtu versus $2.33 per mmbtu a year earlier.
As shown in the following financial results breakdown:
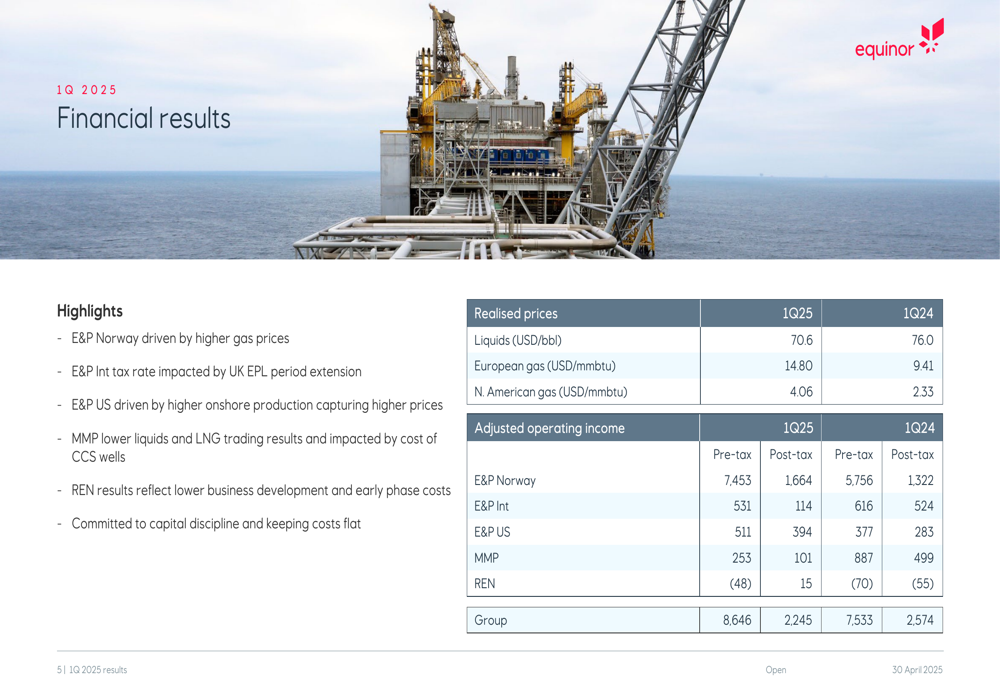
Detailed Financial Analysis
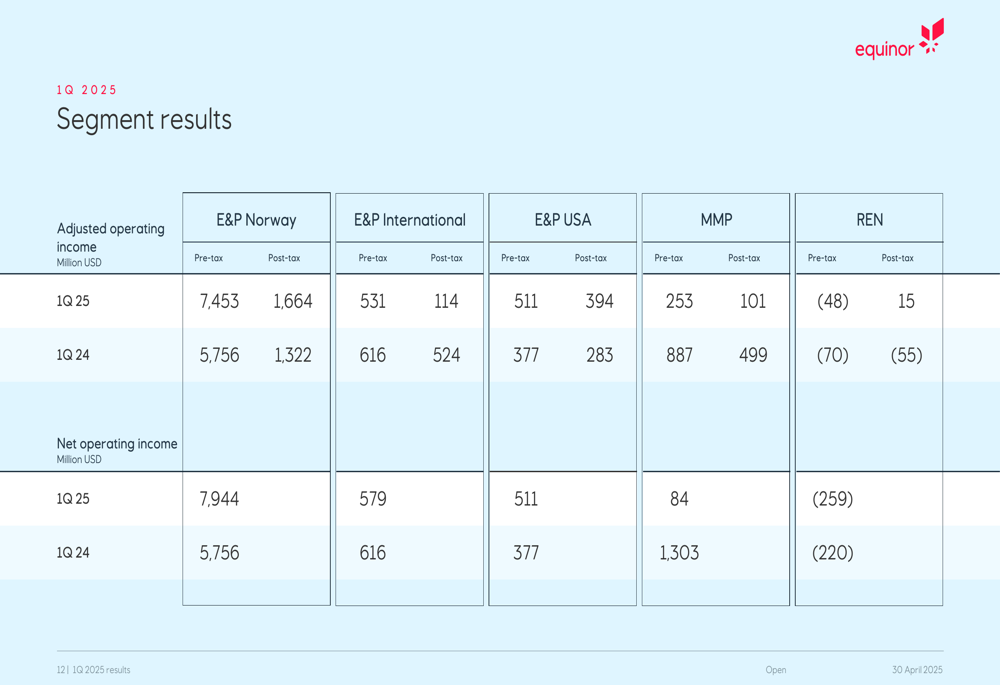
Equinor’s E&P Norway segment was the standout performer, with adjusted operating income of $7.45 billion pre-tax and $1.66 billion post-tax, compared to $5.76 billion and $1.32 billion respectively in Q1 2024. This improvement was primarily driven by higher European gas prices.
The E&P International segment reported pre-tax adjusted operating income of $531 million, slightly down from $616 million in Q1 2024. Post-tax income declined more significantly to $114 million from $524 million, impacted by the UK Energy Profits Levy (EPL) period extension.
Meanwhile, E&P US showed improvement with pre-tax adjusted operating income of $511 million, up from $377 million in Q1 2024, driven by higher onshore production capturing better prices.
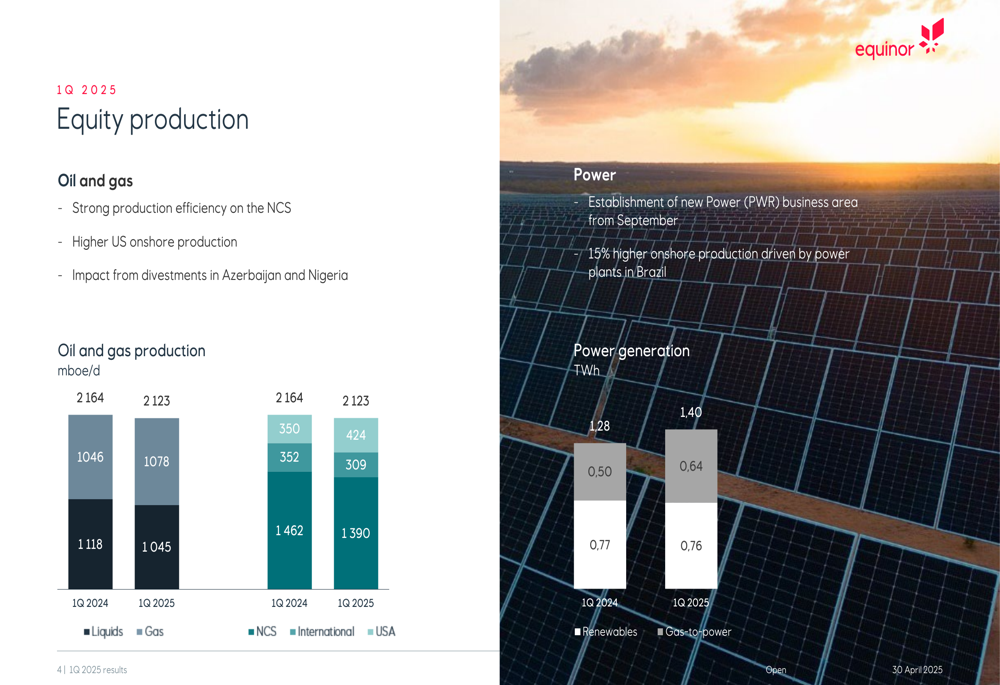
The company’s oil and gas production remained strong, with total equity production of 2,123 mboe/d from the Norwegian Continental Shelf (NCS), 424 mboe/d from international operations, and 309 mboe/d from the US.
The following chart illustrates Equinor’s equity production and power generation:
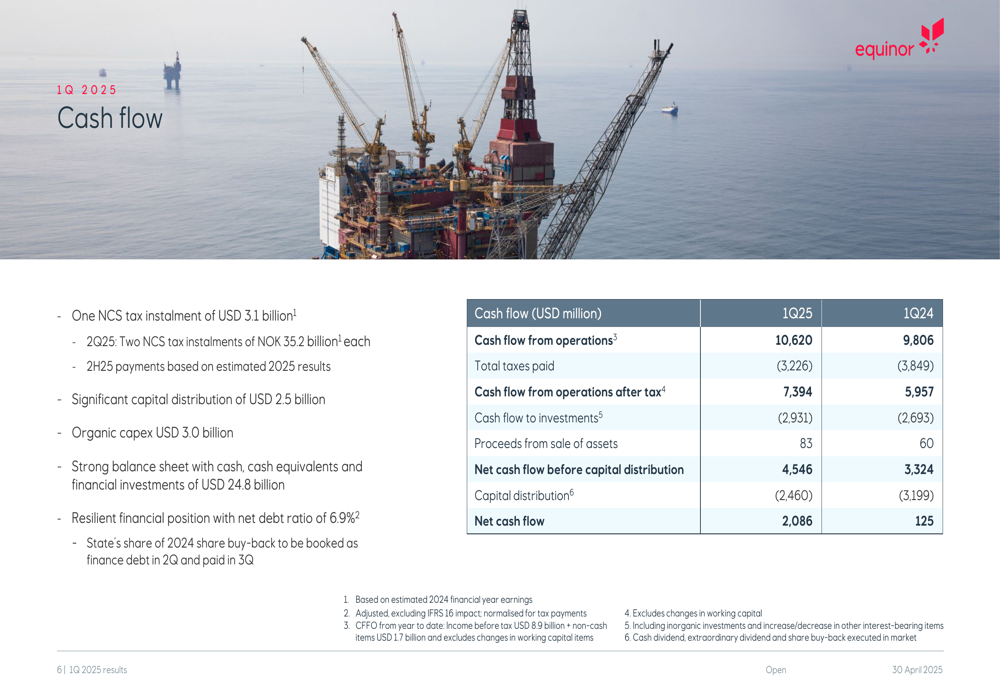
Equinor’s cash flow performance remained robust, with cash flow from operations reaching $10.62 billion in Q1 2025. After tax payments of $3.23 billion, cash flow from operations after tax stood at $7.39 billion, representing a significant increase from $5.96 billion in Q1 2024.
The company maintained a strong balance sheet with cash, cash equivalents, and financial investments totaling $24.8 billion and a net debt ratio of 6.9%, positioning it well to weather potential market volatility.
As shown in the following cash flow statement:
Strategic Initiatives
Equinor highlighted several strategic developments during the quarter, including the start-up of new fields and the Final Investment Decision (FID) for Northern Lights Phase 2, a carbon capture and storage project.
The company also announced the establishment of a new Power (PWR) business area from September, reflecting its commitment to energy transition. Power generation showed a 15% increase in onshore production, driven by power plants in Brazil.
However, Equinor faced a setback with its Empire Wind project, receiving a halt work order on April 16. The project, for which the company obtained a lease in 2017 and full permits in 2024, has a gross book value of approximately $2.5 billion, including the South Brooklyn Marine Terminal.
The following highlights from the presentation summarize key achievements and challenges:
Forward-Looking Statements
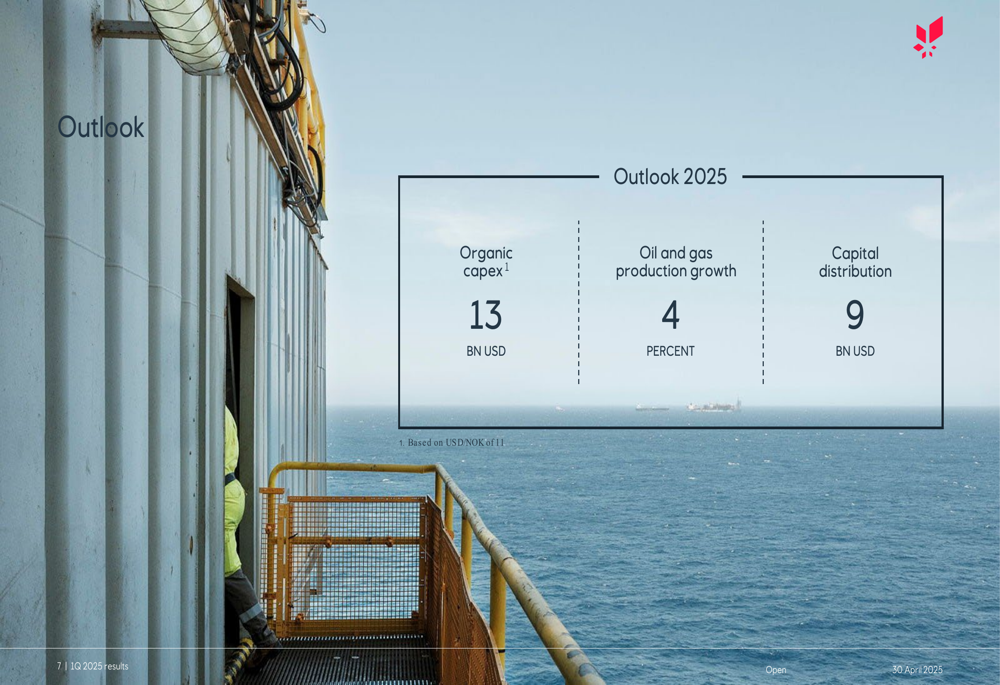
Looking ahead to the remainder of 2025, Equinor projects organic capital expenditure of $13 billion, oil and gas production growth of 4%, and a capital distribution target of $9 billion.
The company emphasized its preparedness for market volatility, highlighting its resilience toward lower commodity prices, robust portfolio, strong balance sheet, and capital discipline.
As illustrated in the company’s outlook for 2025:
Equinor’s segment results provide additional insight into the performance of its various business areas:
The company’s financial results breakdown further details the components of its adjusted net income:
Despite the challenges with the Empire Wind project, Equinor continues to advance its energy transition strategy while delivering strong financial results. The company’s ability to capitalize on higher gas prices while maintaining operational efficiency positions it well for the remainder of 2025, though investors will likely monitor developments with the Empire Wind project and the impact of the UK’s extended Energy Profits Levy on international operations.
Full presentation:
This article was generated with the support of AI and reviewed by an editor. For more information see our T&C.