Asia FX cautious amid US govt shutdown; yen tumbles after Takaichi’s LDP win

Introduction & Market Context
Esprinet (BIT:PRT) shares tumbled 12.41% following the release of its Q1 2025 financial results on May 13, as investors reacted to a significant profit decline despite modest sales growth. The Italian IT distributor reported a 4% year-over-year increase in sales, but saw its net income plummet by 85% as operating costs surged amid inflationary pressures.
The company highlighted a recovery in consumer demand, particularly in the PC segment, and noted positive industry fundamentals despite ongoing geopolitical and macroeconomic challenges. However, the market’s negative reaction suggests concerns about Esprinet’s ability to maintain profitability in the face of rising costs and working capital challenges.
Quarterly Performance Highlights
Esprinet reported Q1 2025 sales of €962.4 million, representing a 4% increase compared to Q1 2024. However, this top-line growth was overshadowed by significant pressure on profitability metrics across the board.
As shown in the following comprehensive P&L summary, the company’s gross profit increased marginally to €54.4 million (+2% YoY), but gross margin contracted slightly to 5.65% from 5.74% in the prior year period. More concerning was the 12% surge in SG&A expenses, which led to a substantial decline in adjusted EBITDA to €10.8 million (-24% YoY) and net income of just €0.5 million (-85% YoY).
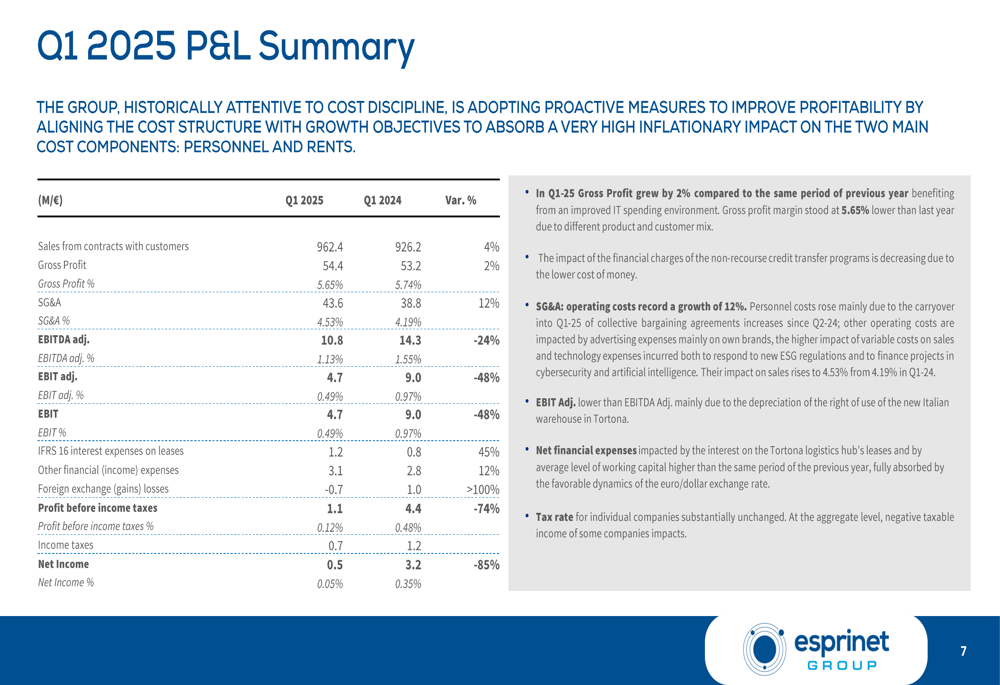
The company attributed the sharp increase in operating costs to inflationary pressures and the impact of collective bargaining agreements. These factors, combined with higher financial expenses, resulted in profit before income taxes falling 74% to €1.1 million, with a corresponding margin of just 0.12% compared to 0.48% a year earlier.
Detailed Financial Analysis
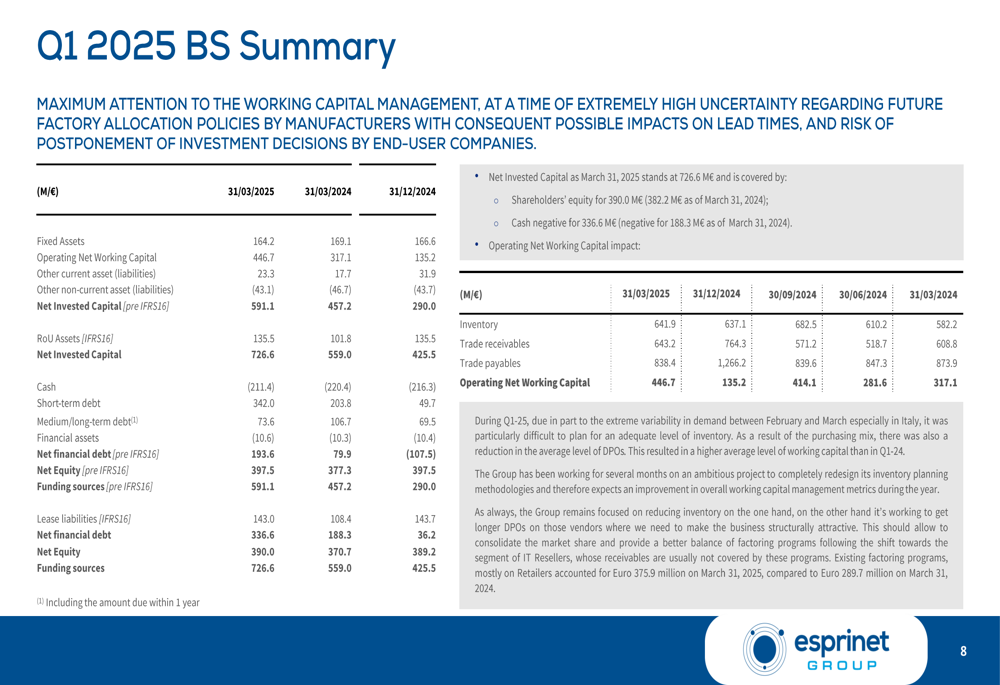
Esprinet’s balance sheet reflected significant changes in working capital management, with the operating net working capital increasing to €446.7 million as of March 31, 2025, compared to €317.1 million a year earlier and €135.2 million at the end of 2024. This substantial increase has contributed to a deterioration in the company’s financial position.
The following balance sheet summary highlights the significant increase in net financial debt, which rose to €336.6 million from €188.3 million in Q1 2024:
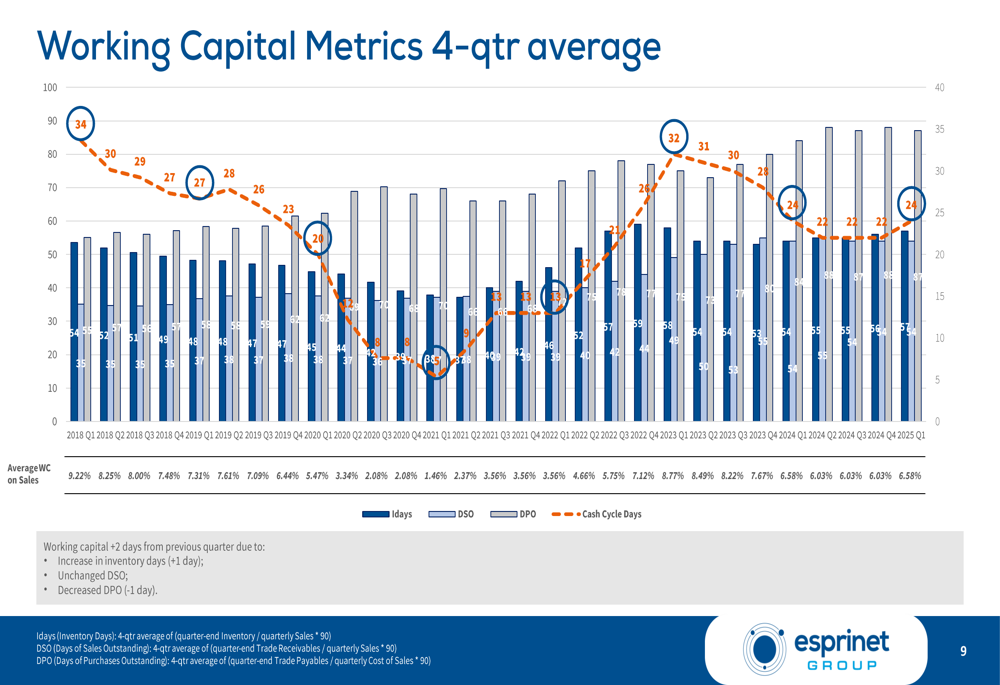
Working capital metrics show a concerning trend, with the cash conversion cycle extending to 24 days, representing a 2-day increase compared to Q4 2024. The company noted uncertainty regarding manufacturer factory allocation policies as a factor affecting working capital management.
The following chart illustrates the evolution of working capital metrics on a 4-quarter average basis:
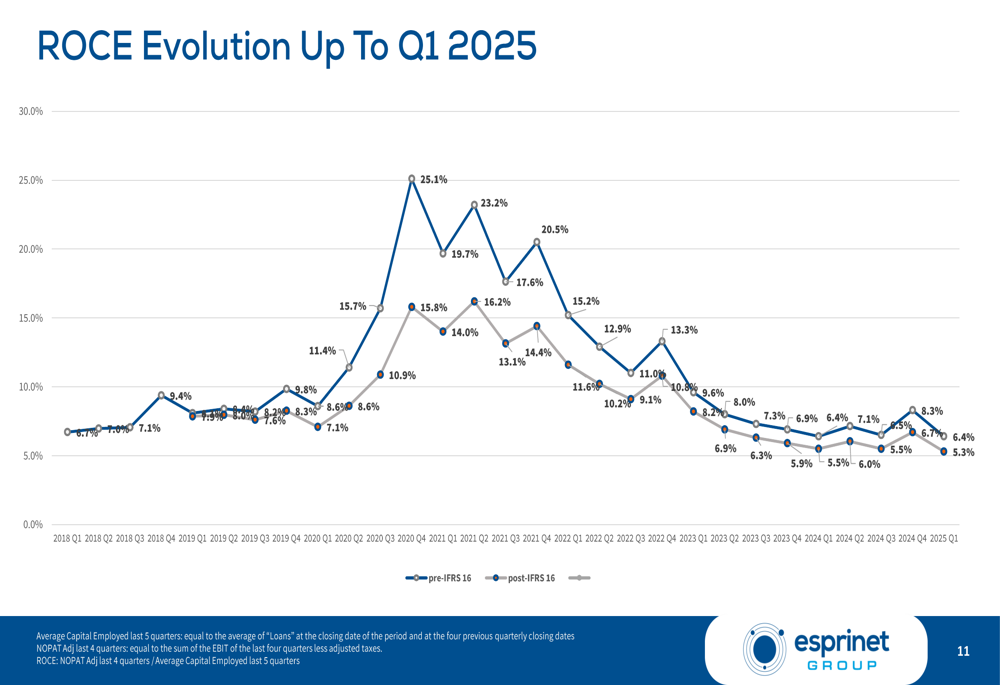
Despite these challenges, Esprinet’s Return on Capital Employed (ROCE) remained stable at 6.4% year-over-year, though this represents a significant decline from historical levels as shown in the ROCE evolution chart:
Geographic and Segment Performance
Esprinet’s performance varied significantly across geographic markets and product segments. The company reported strong growth in the Iberian Peninsula, with sales in Spain increasing by 9% and Portugal showing remarkable growth of 78% year-over-year. Morocco also performed well with 45% growth, while the core Italian market remained flat.
The following breakdown of sales evolution by country and product category provides a detailed view of these performance disparities:
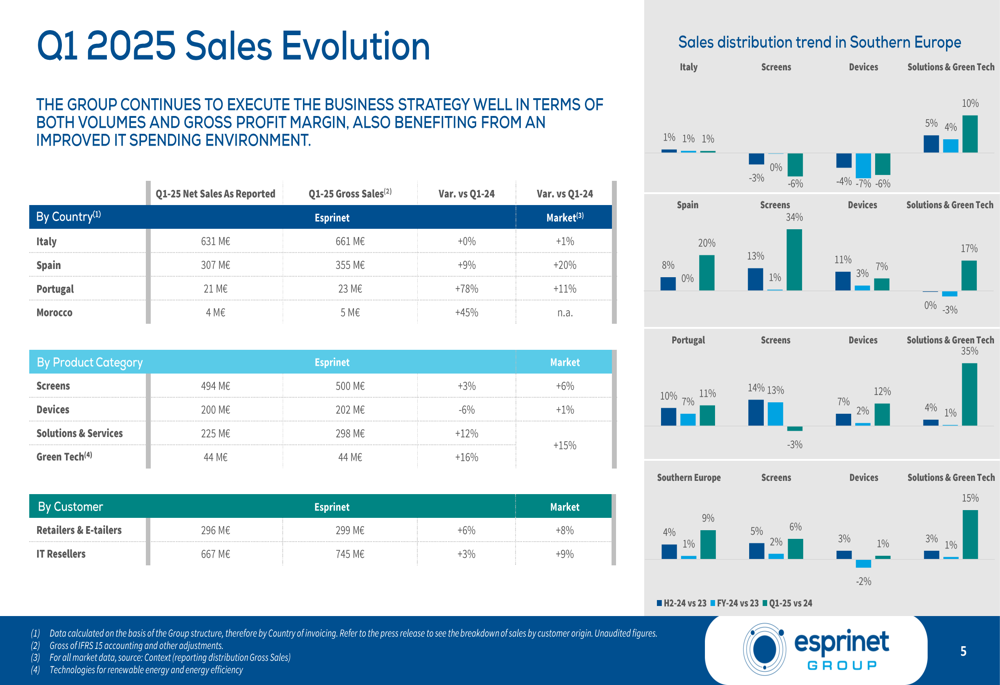
From a product perspective, the company’s three business dimensions showed divergent performance. The V-Valley segment, which focuses on Solutions and Services, demonstrated strong growth of 14% year-over-year, while the Zeliatech segment (Green Tech) grew by 16%. However, the core Esprinet business showed mixed results, with Screens growing by 3% but Devices declining by 6%.
The profitability breakdown by business dimension reveals that V-Valley generated the highest EBITDA at €8.8 million (+5% YoY), while the core Esprinet business saw its EBITDA decline sharply to €1.5 million (-71% YoY):

Forward-Looking Statements
Despite the challenging Q1 results, Esprinet maintained a relatively stable outlook for the full year 2025. The company provided EBITDA guidance of between €63 million and €71 million, compared to €69.5 million in 2024, suggesting management expects performance to improve in subsequent quarters.
The company outlined several strategic priorities, including a focus on redesigning its structure to improve working capital efficiency and optimize costs. Management also emphasized potential growth through acquisitions and continued development of high-margin business segments.
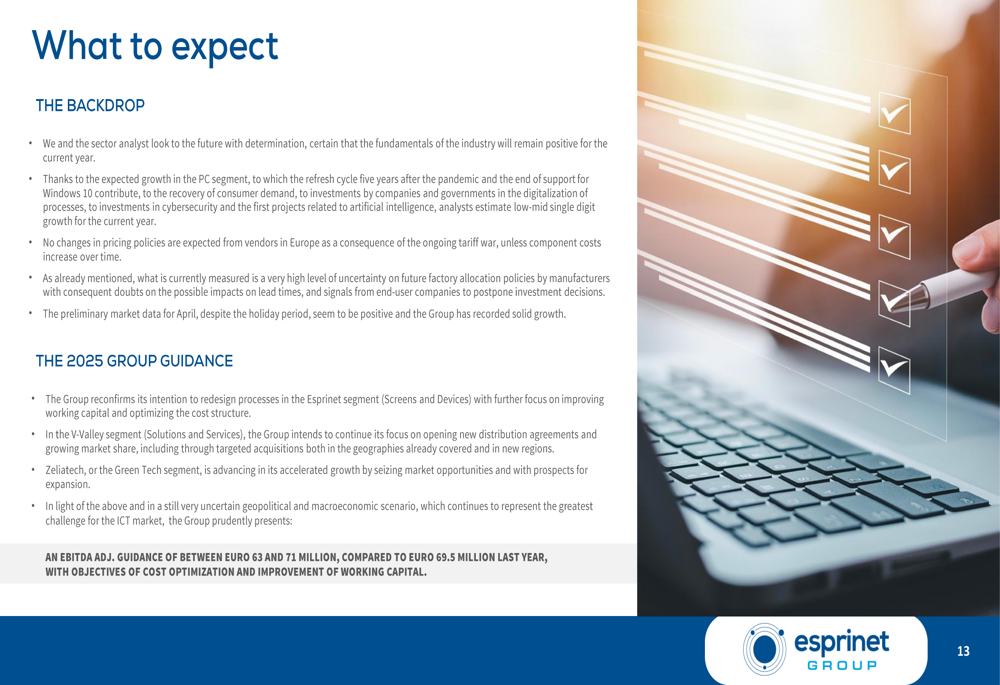
Esprinet noted that analyst expectations call for low to mid-single digit growth in the IT distribution market. The company highlighted its April performance as showing solid growth, providing some optimism for Q2 despite the disappointing Q1 results.
However, given the significant decline in Q1 profitability and the market’s negative reaction to the results, investors will likely scrutinize the company’s ability to deliver on its full-year guidance and address the operational challenges that impacted its first-quarter performance.
Full presentation:
This article was generated with the support of AI and reviewed by an editor. For more information see our T&C.