Oklo stock tumbles as Financial Times scrutinizes valuation

Introduction & Market Context
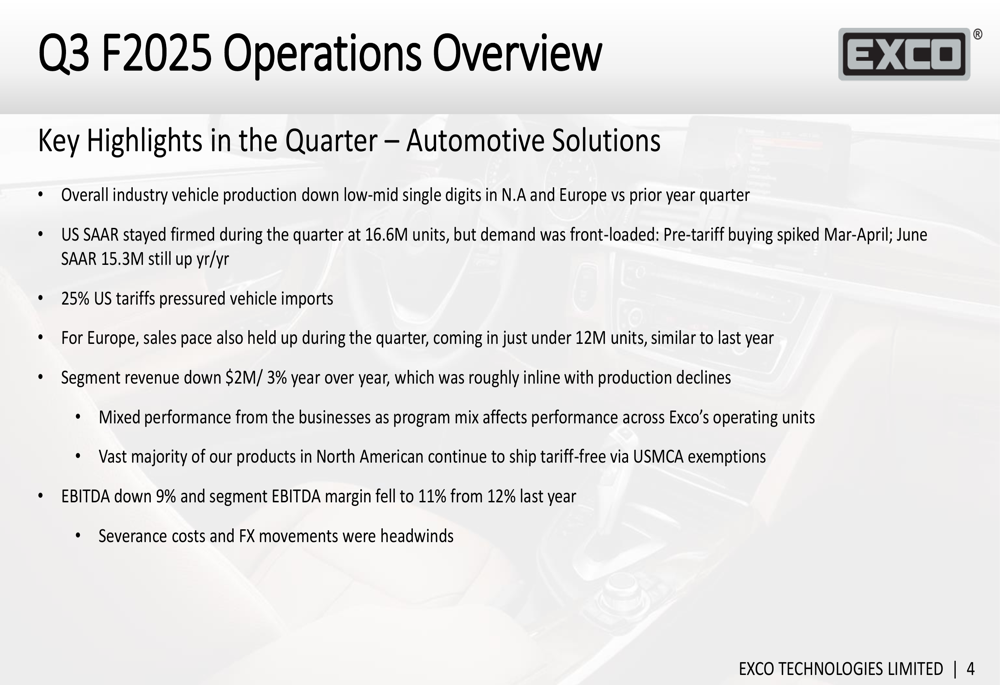
Exco Technologies Limited (TSX:XTC) presented its Q3 F2025 earnings results on July 31, 2025, revealing declining revenue and profitability amid challenging conditions in the automotive sector. The company faced headwinds from reduced vehicle production in key markets, with industry vehicle production down low-to-mid single digits in North America and Europe compared to the prior year quarter.
The presentation highlighted that while the US Seasonally Adjusted Annual Rate (SAAR) remained firm at 16.6 million units during the quarter, demand was front-loaded due to pre-tariff buying that spiked in March-April. By June, the SAAR had declined to 15.3 million units, though this still represented a year-over-year increase. The European market maintained relative stability with sales just under 12 million units, similar to last year’s levels.
As shown in the following slide detailing the Automotive Solutions segment performance:
Quarterly Performance Highlights
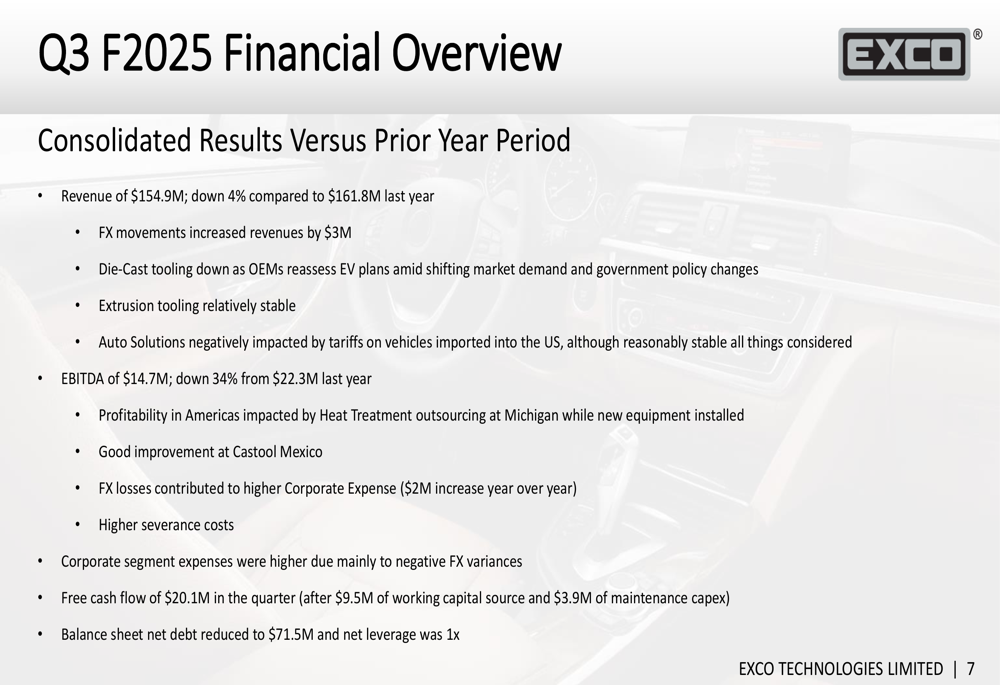
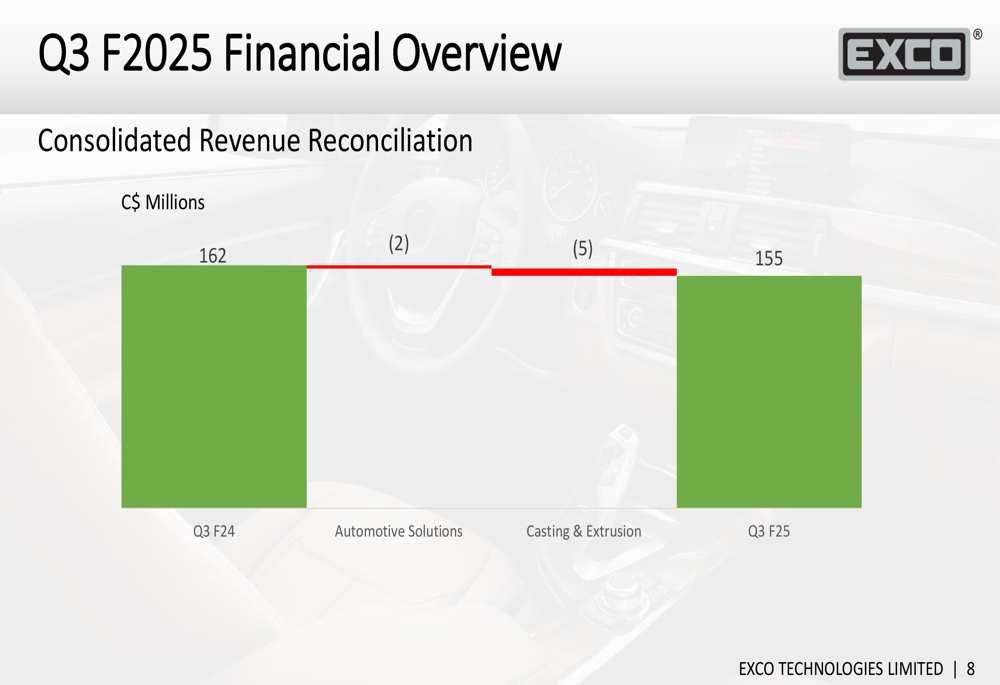
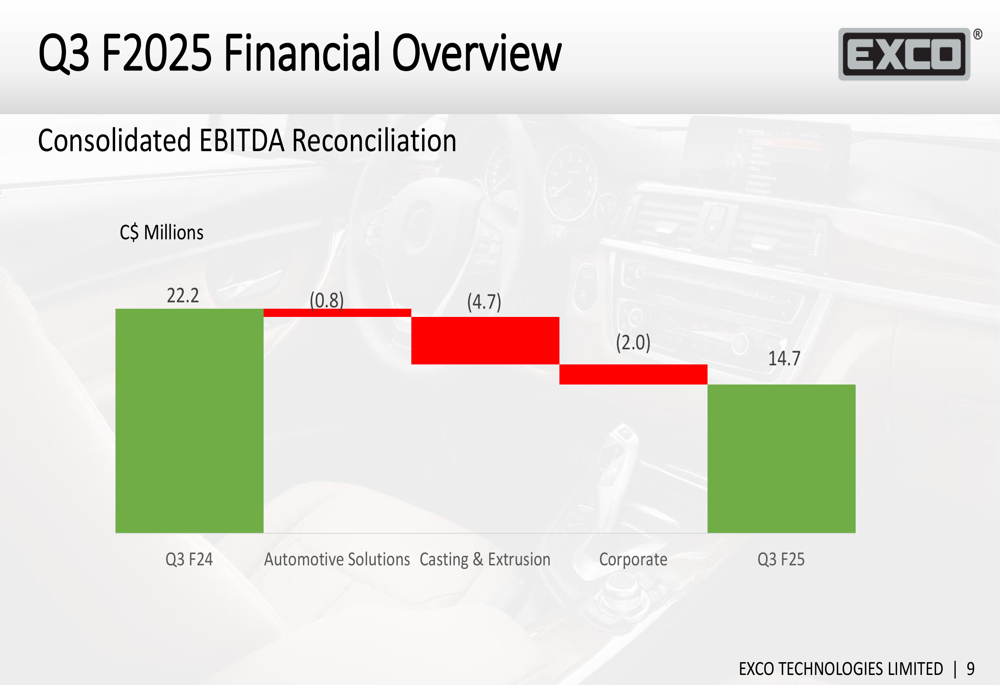
Exco reported consolidated revenue of $154.9 million for Q3 F2025, representing a 4% decrease compared to $161.8 million in the same period last year. EBITDA declined more significantly, falling 34% to $14.7 million from $22.3 million in Q3 F24. Despite these challenges, the company generated strong free cash flow of $20.1 million during the quarter, which included a $9.5 million working capital source and $3.9 million in maintenance capital expenditures.
The company’s financial performance was negatively impacted by several factors, including heat treatment outsourcing costs in Michigan while new equipment was being installed, foreign exchange losses that contributed to higher corporate expenses, and increased severance costs. However, these were partially offset by contributions from European extrusion operations and significant year-over-year improvement at Castool Mexico.
The following slide provides a comprehensive overview of the consolidated financial results:
The waterfall chart below illustrates how each segment contributed to the overall revenue decline:
Similarly, this chart breaks down the EBITDA decrease by segment:
Segment Analysis
Automotive Solutions Segment
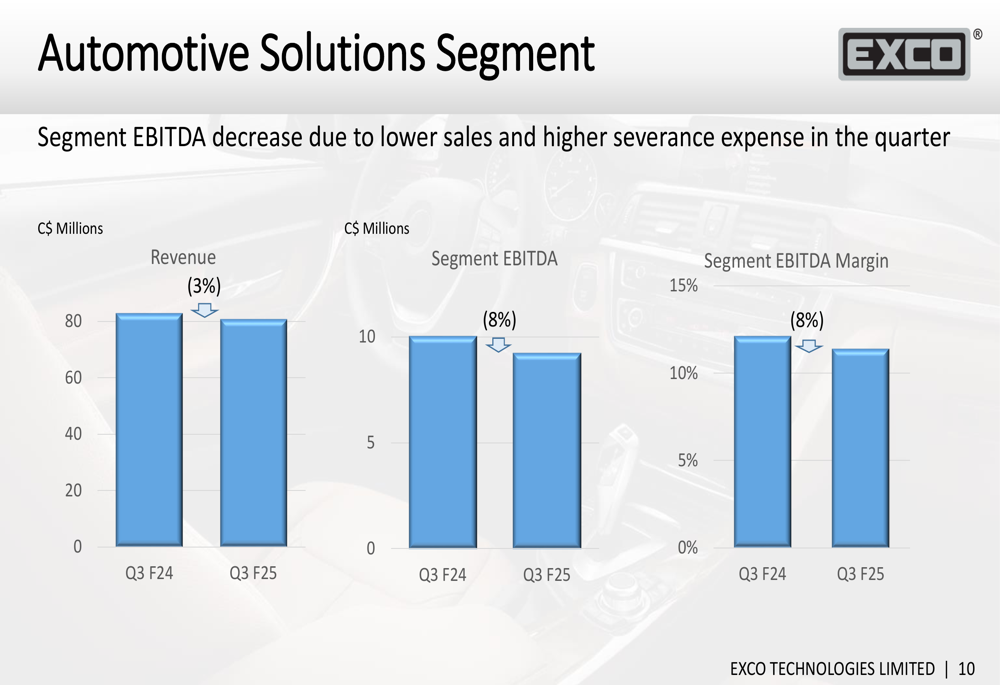
The Automotive Solutions segment experienced a 3% year-over-year revenue decline, roughly in line with production decreases in North America and Europe. The segment’s EBITDA fell by 8%, with EBITDA margin contracting to 11% from 12% in the prior year. Performance varied across Exco’s operating units due to program mix effects.
The company noted that the vast majority of its products in North America continue to ship tariff-free via USMCA exemptions, providing some insulation from the 25% US tariffs that have pressured vehicle imports. However, severance costs and foreign exchange movements created additional headwinds for this segment.
The following chart illustrates the Automotive Solutions segment performance:
Casting & Extrusion Segment
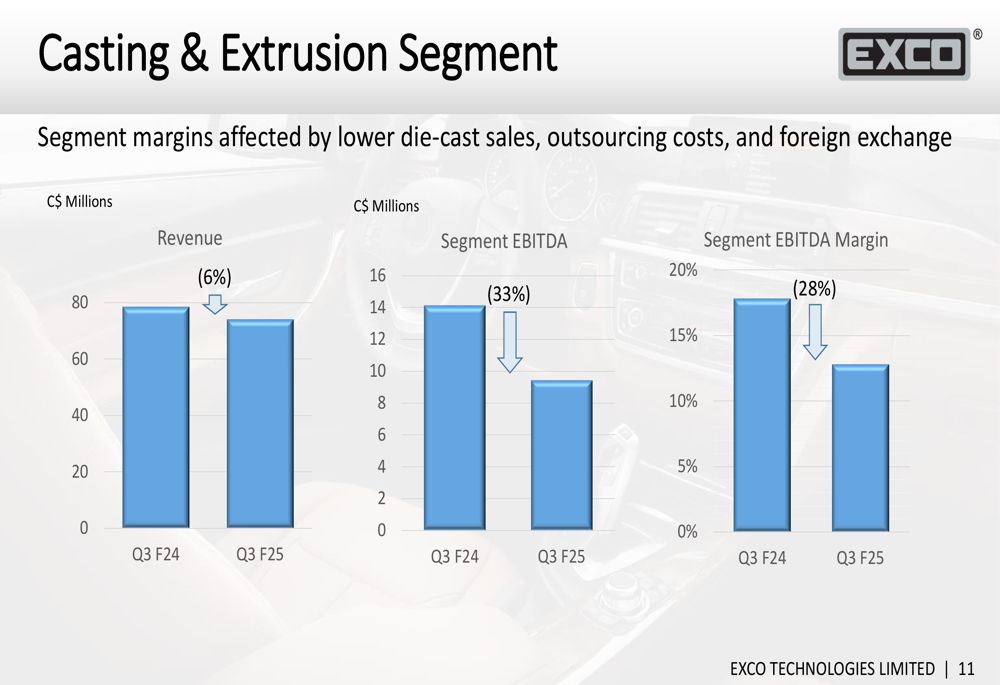
The Casting & Extrusion segment faced more significant challenges, with revenue declining by 6% year-over-year, primarily due to lower sales of die-cast products. Segment EBITDA fell by 33% to $9.4 million from $14.1 million in the prior year, with EBITDA margin contracting substantially.
The decline in die-cast product volumes was attributed to OEMs reassessing their electric vehicle plans amid shifting market demand and government policy changes. While the segment benefited from contributions from European extrusion operations, improvements at Castool Mexico, and select price increases, these positive factors were outweighed by the volume declines, heat treatment outsourcing costs, restructuring expenses, and foreign exchange losses.
The following chart details the Casting & Extrusion segment performance:
Financial Position & Outlook
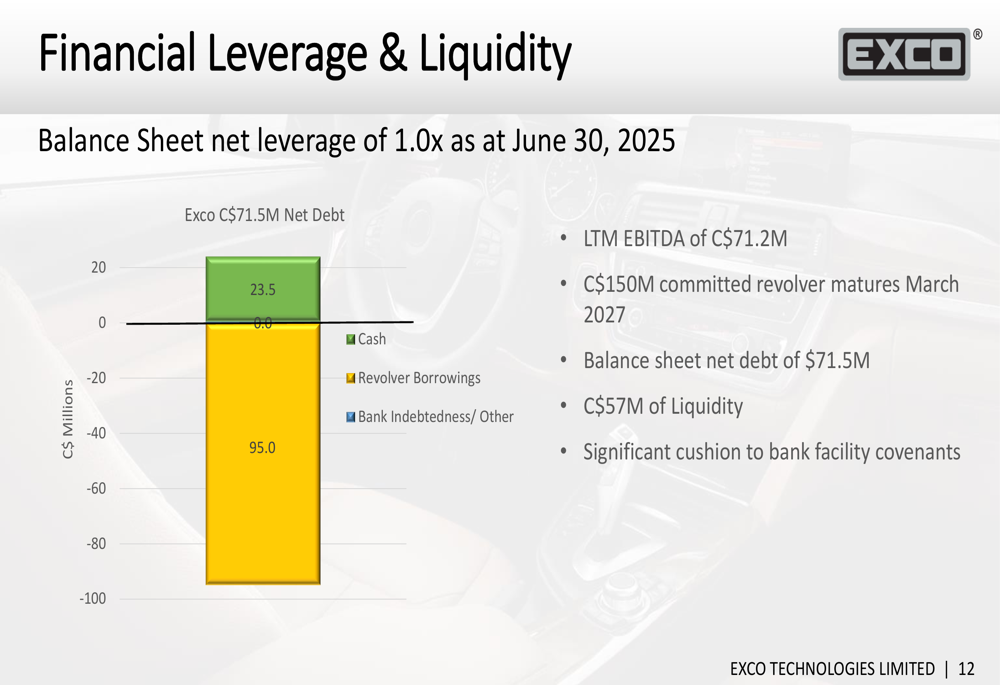
Despite the operational challenges, Exco maintained a strong financial position with balance sheet net debt of $71.5 million and a net leverage ratio of 1.0x. The company reported $23.5 million in cash and $57 million in available liquidity, with a $150 million committed revolving credit facility that matures in March 2027.
The following slide provides details on the company’s financial leverage and liquidity:
Comparative Context
Comparing these Q3 F2025 results with the previous quarter’s performance reveals a deteriorating trend. In Q2 2025, Exco had reported a 1% year-over-year increase in consolidated sales to $166.1 million, whereas Q3 saw a 4% decline. Similarly, while Q2 showed a 21% decline in net income, Q3’s EBITDA drop of 34% indicates accelerating pressure on profitability.
The stock market’s reaction to the earnings release was negative, with Exco’s share price declining 1.45% to close at $6.88 on July 31, 2025. This contrasts with the 4.21% increase seen after the Q2 results, suggesting investors are concerned about the deteriorating performance trend.
Despite these challenges, Exco’s consistent cash flow generation and solid balance sheet provide some stability as the company navigates through the current automotive industry headwinds. Management’s focus on strategic investments in greenfield locations and efficiency improvements, as highlighted in previous communications, will be crucial for the company’s ability to return to growth as market conditions stabilize.
Full presentation:
This article was generated with the support of AI and reviewed by an editor. For more information see our T&C.