Asahi shares mark weekly slide after cyberattack halts production

Introduction & Market Context
Fannie Mae (OTC:FNMA) reported first quarter 2025 net income of $3.66 billion, down 15.3% from $4.32 billion in the same period last year, according to the company’s Q1 2025 financial presentation released on April 30, 2025. Despite the earnings decline, the mortgage finance giant continued to strengthen its capital position while providing liquidity to the housing market amid uneven regional home price growth.
The company delivered $76 billion in liquidity to single-family and multifamily mortgage markets during the quarter, helping approximately 287,000 households buy, refinance, or rent homes. Fannie Mae’s total assets stood at $4.35 trillion at quarter-end, with a guaranty book of business of $4.1 trillion.
Quarterly Performance Highlights
Fannie Mae’s comprehensive income for Q1 2025 reached $3.66 billion, down from $4.32 billion in Q1 2024. Net interest income remained relatively stable at $7.0 billion, a slight decrease of $22 million year-over-year. The company’s efficiency ratio increased to 36.1% from 30.9% in the prior-year period, reflecting higher administrative expenses.
As shown in the following financial results summary, the company reported a provision for credit losses of $24 million in Q1 2025, compared to a benefit of $180 million in Q1 2024, while fair value gains decreased significantly to $123 million from $480 million a year earlier:
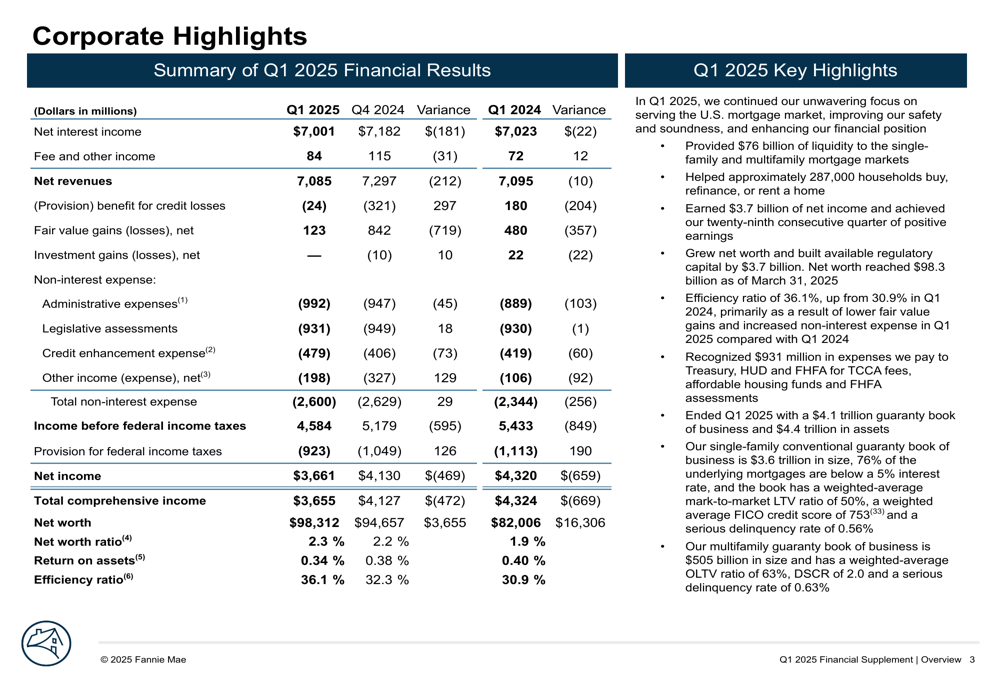
Administrative expenses increased by $103 million year-over-year to $992 million, while credit enhancement expenses rose by $60 million to $479 million. The company also recognized $931 million in expenses paid to the Treasury, HUD, and FHFA during the quarter.
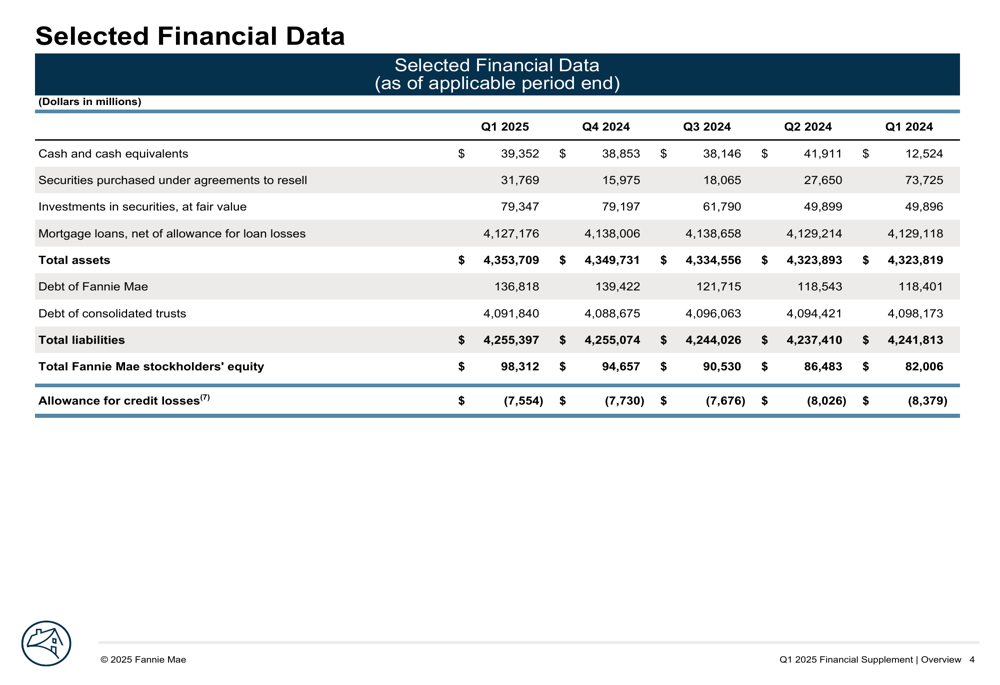
Selected financial data shows the company’s balance sheet remains substantial, with total assets of $4.35 trillion and stockholders’ equity reaching $98.31 billion as of March 31, 2025:
Housing Market Analysis
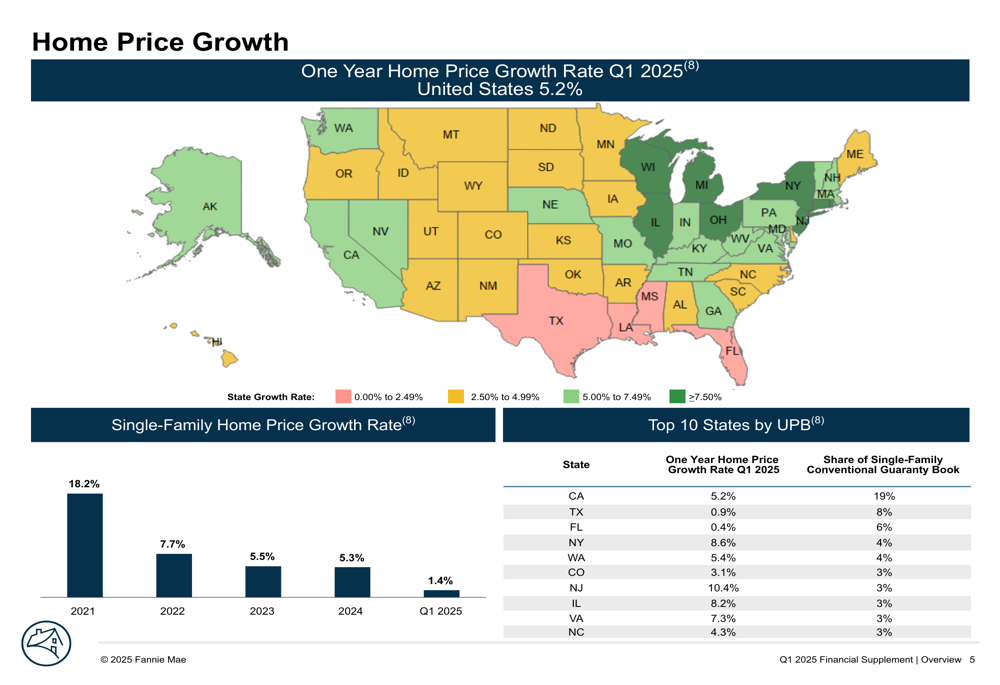
The U.S. housing market showed significant regional variations in home price growth during Q1 2025. The national one-year home price growth rate stood at 5.2%, with quarterly growth of 1.4%, continuing a trend of moderate price appreciation.
As illustrated in the following home price growth map, northeastern states showed the strongest appreciation, with New Jersey leading at 10.4%, followed by New York at 8.6% and Illinois at 8.2%. In contrast, southern states like Florida (0.4%) and Texas (0.9%) experienced minimal growth:
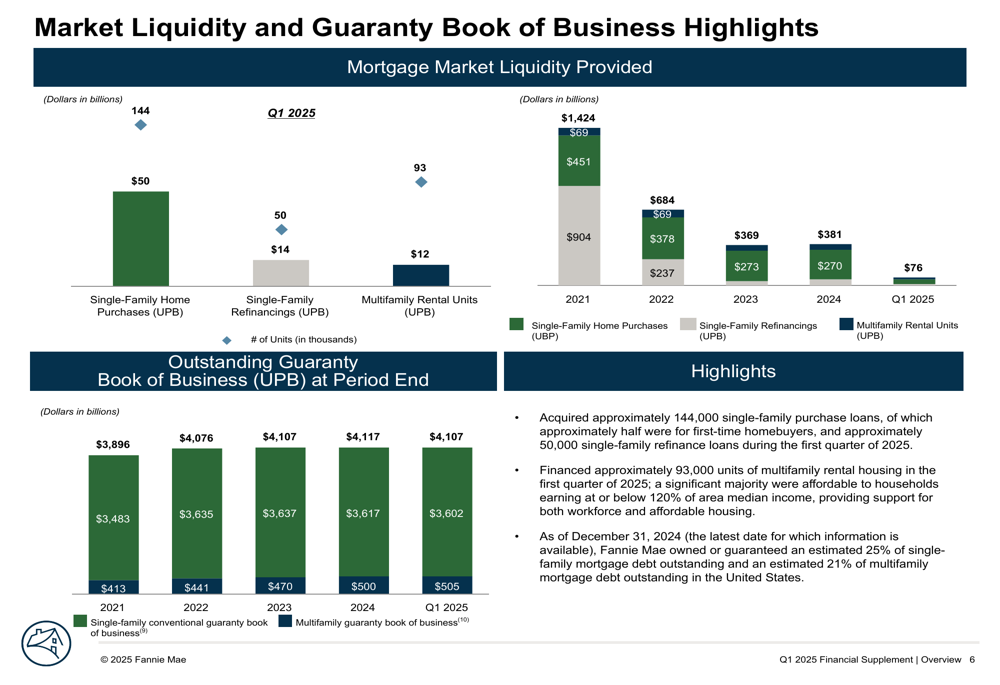
Fannie Mae’s mortgage market activity reflected these conditions, with the company acquiring approximately 144,000 single-family home purchases and 50,000 refinancings during Q1 2025. The company also financed approximately 93,000 units of multifamily rental housing.
The following chart shows Fannie Mae’s mortgage market liquidity provided over recent years, highlighting the significant decline in refinancing activity compared to the 2021 peak:
Business Segment Performance
Fannie Mae’s single-family business generated net income of $2.92 billion in Q1 2025, representing approximately 80% of the company’s total earnings. The single-family conventional guaranty book of business stood at $3.6 trillion, with a serious delinquency rate of 0.56%.
The following single-family highlights show key metrics for this segment, which remains the core of Fannie Mae’s business:
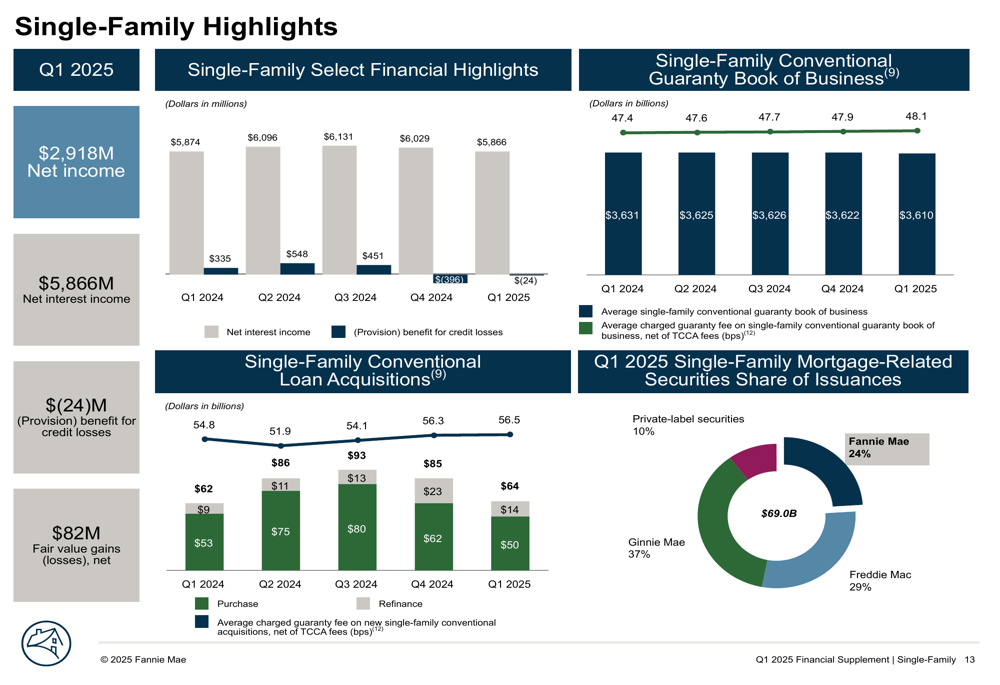
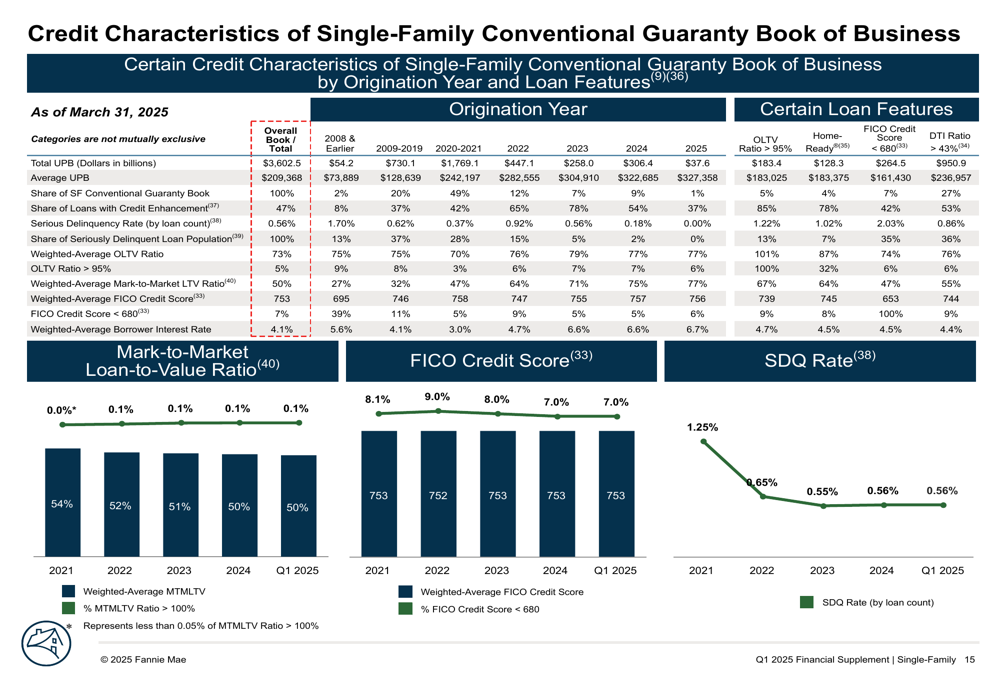
Credit quality in the single-family portfolio remained strong, with a weighted average FICO credit score of 753 and a mark-to-market loan-to-value ratio of 50%. The company continued to transfer credit risk on a significant portion of its single-family guaranty book, with 47% of loans having some form of credit enhancement.
The following slide illustrates the credit characteristics of Fannie Mae’s single-family conventional guaranty book of business:
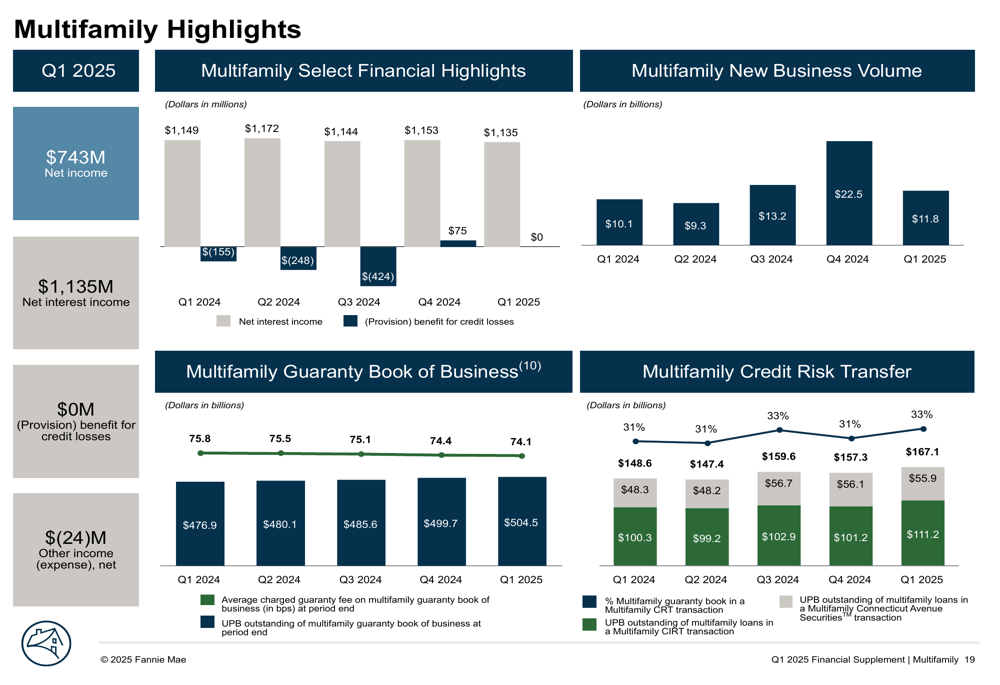
The multifamily business contributed $743 million in net income during Q1 2025. The multifamily guaranty book of business grew to $505 billion, up from $500 billion at year-end 2024. The company transferred credit risk on approximately 32% of its multifamily guaranty book.
As shown in the following multifamily highlights, this segment maintained stable performance despite challenges in the commercial real estate market:
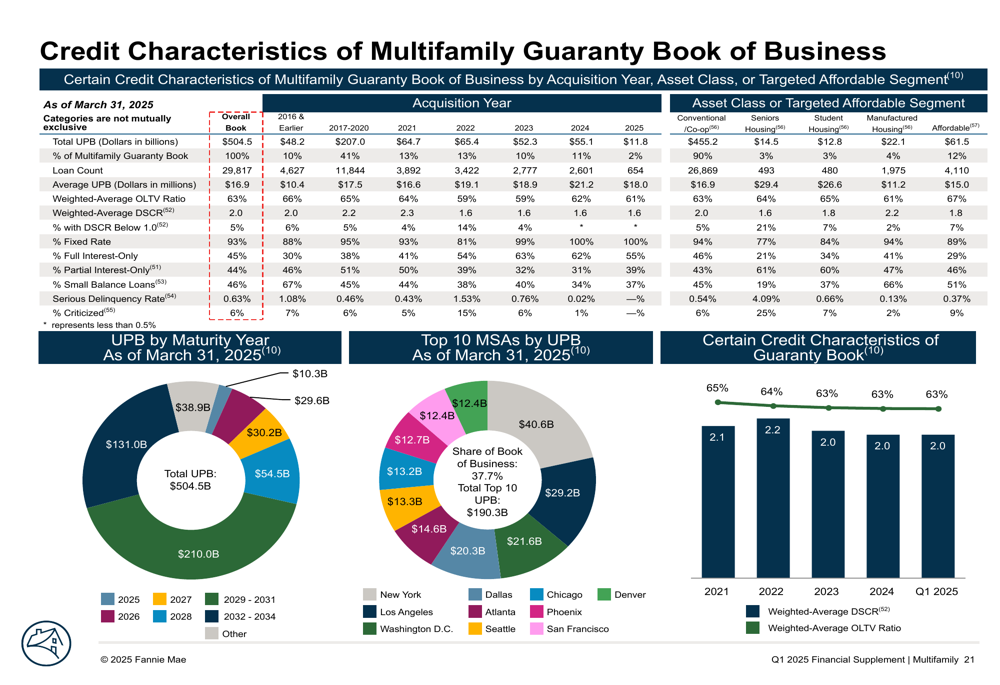
The credit characteristics of the multifamily guaranty book remained solid, with a weighted average original loan-to-value ratio of 63% and a weighted average debt service coverage ratio of 2.0:
Capital Position
Fannie Mae continued to strengthen its capital position, with net worth increasing to $98.31 billion as of March 31, 2025, up 19.9% from $82.01 billion a year earlier. The company’s net worth ratio improved to 2.3% from 1.9% in Q1 2024.
Despite this progress, Fannie Mae remains significantly undercapitalized compared to its regulatory requirements. The following chart illustrates the company’s net worth growth and progress toward reducing its regulatory capital deficit:
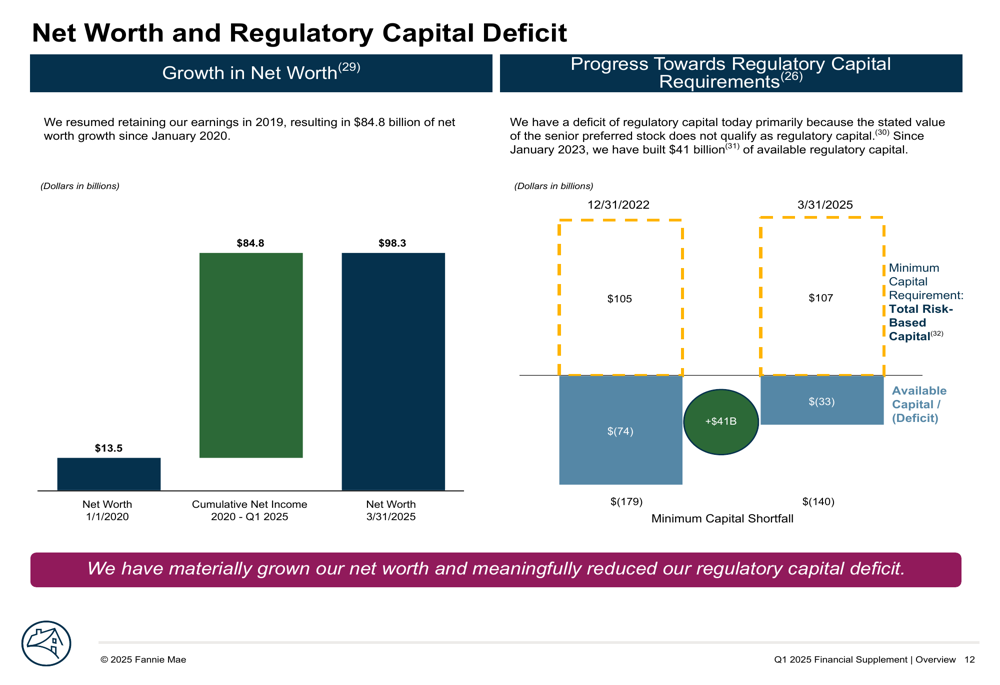
The company’s Common Equity Tier 1 (CET1) capital requirement stands at 10.5%, comparable to the 11.1% requirement for U.S. global systemically important banks (G-SIBs). Fannie Mae’s total risk-based regulatory capital ratio was 14%, slightly below the 14.6% average for U.S. G-SIBs.
Forward-Looking Statements
While Fannie Mae did not provide specific forward guidance in its presentation, the company’s financial results suggest a continued focus on building capital while managing credit risk in a housing market characterized by regional disparities.
The company’s ability to maintain stable net interest income despite market challenges indicates operational resilience, though increased expenses and lower fair value gains contributed to the year-over-year profit decline.
As Fannie Mae continues to operate under conservatorship, its progress in building capital and reducing its regulatory deficit remains a key focus for investors and policymakers. With a current stock price of $6.38, up 1.59% in the most recent trading session, market participants appear to be monitoring the company’s gradual improvement in capital position despite the quarterly earnings decline.
Full presentation:
This article was generated with the support of AI and reviewed by an editor. For more information see our T&C.