Bullish indicating open at $55-$60, IPO prices at $37

Introduction & Market Context
Federal Agricultural Mortgage Corporation (NYSE:AGM), commonly known as Farmer Mac, recently presented its Q1 2025 equity investor presentation, highlighting the company’s consistent financial performance and strategic growth initiatives. As a government-sponsored enterprise (GSE) with a market capitalization of $2 billion, Farmer Mac continues to focus on its mission of supporting low-cost access to capital for U.S. agriculture and rural infrastructure.
The presentation comes as Farmer Mac’s stock trades at $177.28 as of May 8, 2025, up 1.56% for the day, and within its 52-week range of $159.64 to $217.60. The company’s shares have shown resilience in a challenging interest rate environment, supported by its consistent dividend growth and expansion into higher-yielding segments.
Financial Performance Highlights
Farmer Mac reported strong financial metrics for Q1 2025, maintaining its track record of consistent growth. The company achieved an annualized Core Return on Common Equity of 17% and an efficiency ratio of 29%, demonstrating operational excellence while staying below its target of 30%.
As shown in the following chart of Farmer Mac’s historical financial performance, both Net Effective Spread and Core Earnings have grown steadily from 2020 through 2024, with a compound annual growth rate (CAGR) of 14% for both metrics:
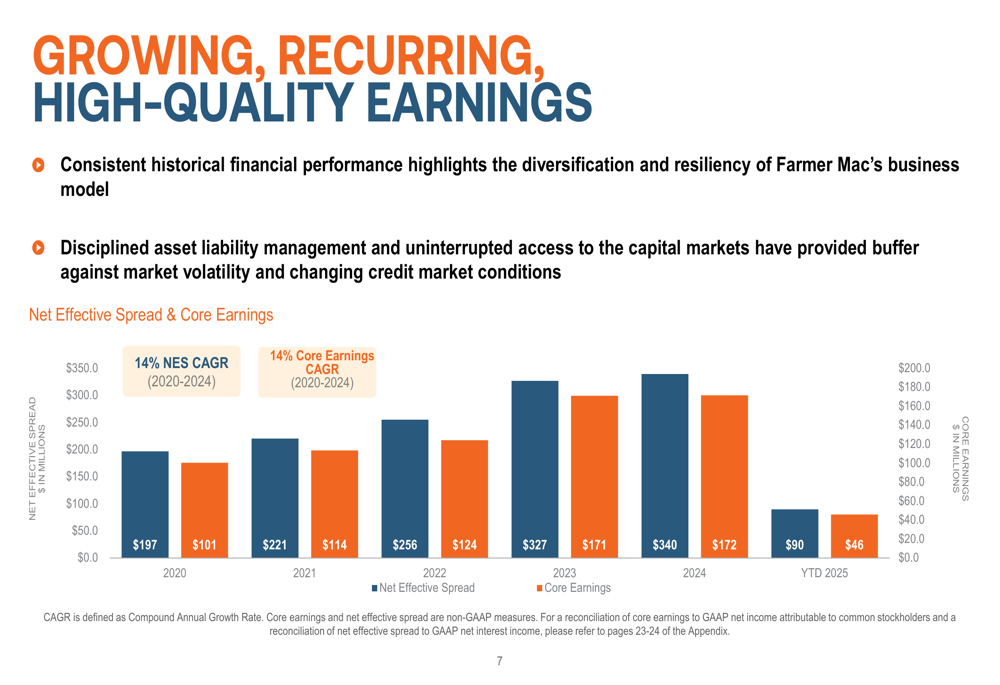
The company’s Q1 2025 financial results continue this positive trajectory, with Net Effective Spread reaching $90 million year-to-date and Core Earnings of $46 million. This performance builds on Farmer Mac’s impressive 10-year track record, which includes a revenue CAGR of 11.2% and a core EPS CAGR of 13%.
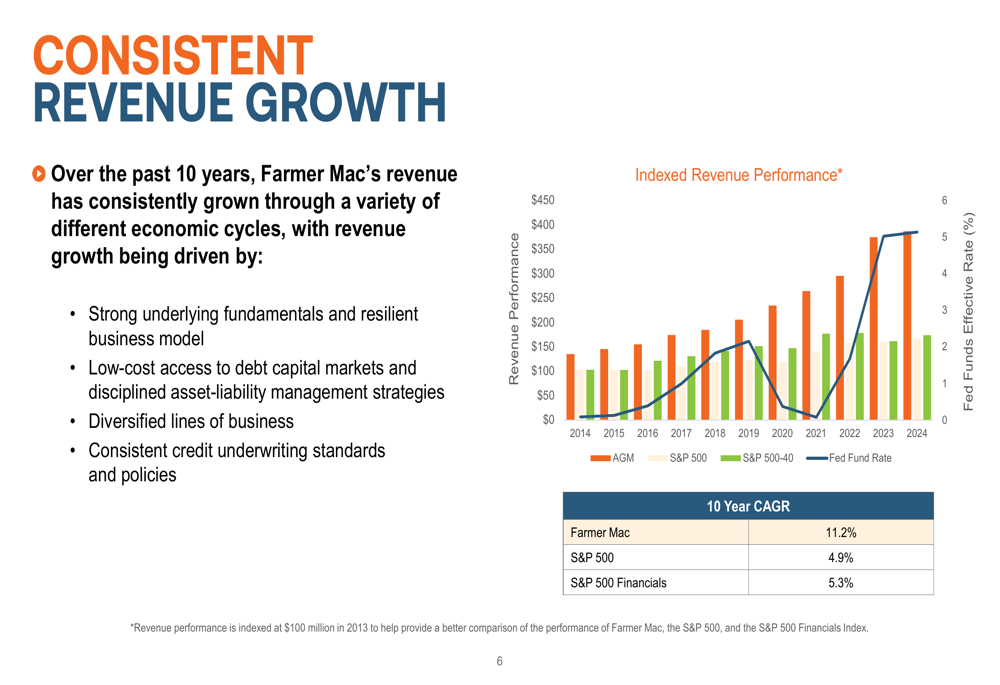
Farmer Mac’s revenue growth has consistently outperformed major market indices, as illustrated in this comparative chart:
Business Segment Analysis
Farmer Mac’s business spans multiple segments across agricultural finance and rural infrastructure. As of March 31, 2025, the company’s total business volume reached $29.8 billion, distributed across five key segments: Farm & Ranch ($18.1 billion), Corporate AgFinance ($1.9 billion), Power & Utilities ($7.2 billion), Renewable Energy ($1.6 billion), and Broadband Infrastructure ($1.0 billion).
The following breakdown illustrates the profitability metrics across these segments:
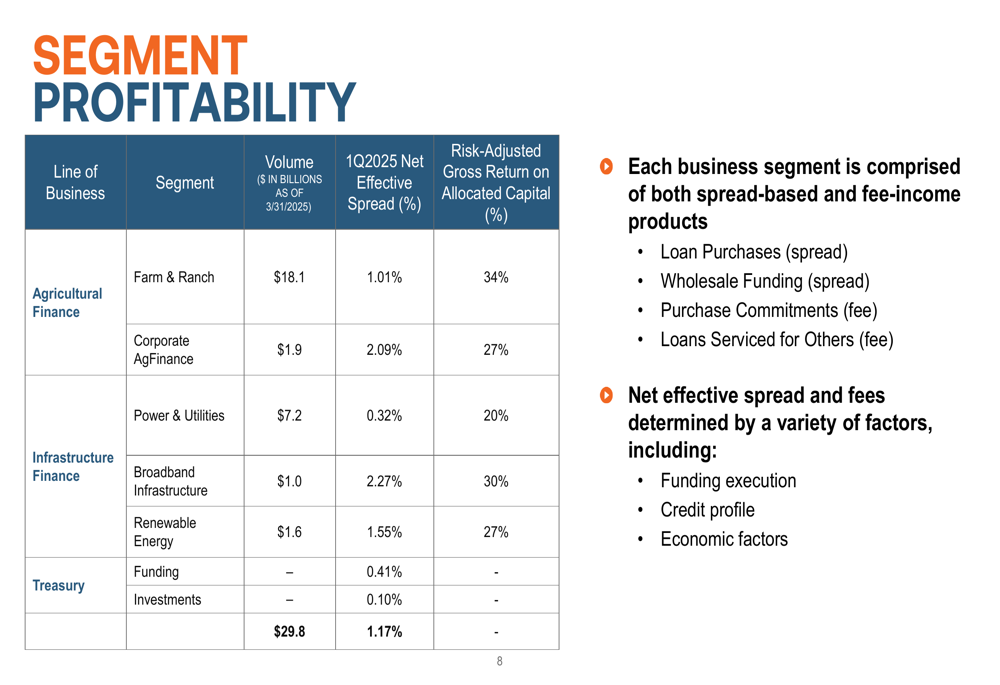
Notably, each business segment demonstrates strong risk-adjusted returns, with Risk-Adjusted Gross Return on Allocated Capital ranging from 20% in Power & Utilities to 34% in Farm & Ranch. The Corporate AgFinance, Renewable Energy, and Broadband Infrastructure segments show particularly attractive Net Effective Spread rates of 2.09%, 1.55%, and 2.27% respectively, highlighting the company’s strategic shift toward these higher-yielding areas.
Strategic Growth Initiatives
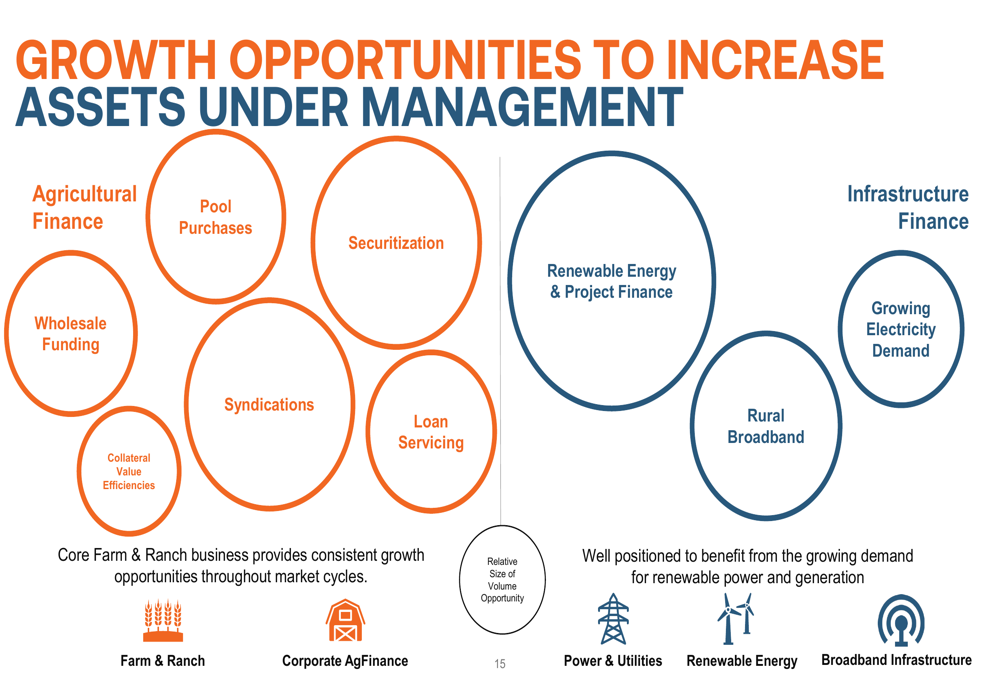
Farmer Mac is actively pursuing several strategic growth initiatives, with particular emphasis on expanding its renewable energy portfolio and enhancing its securitization capabilities. The company has identified specific opportunities to increase assets under management across both its Agricultural Finance and Infrastructure Finance segments.
The following chart outlines Farmer Mac’s growth opportunities across its business segments:
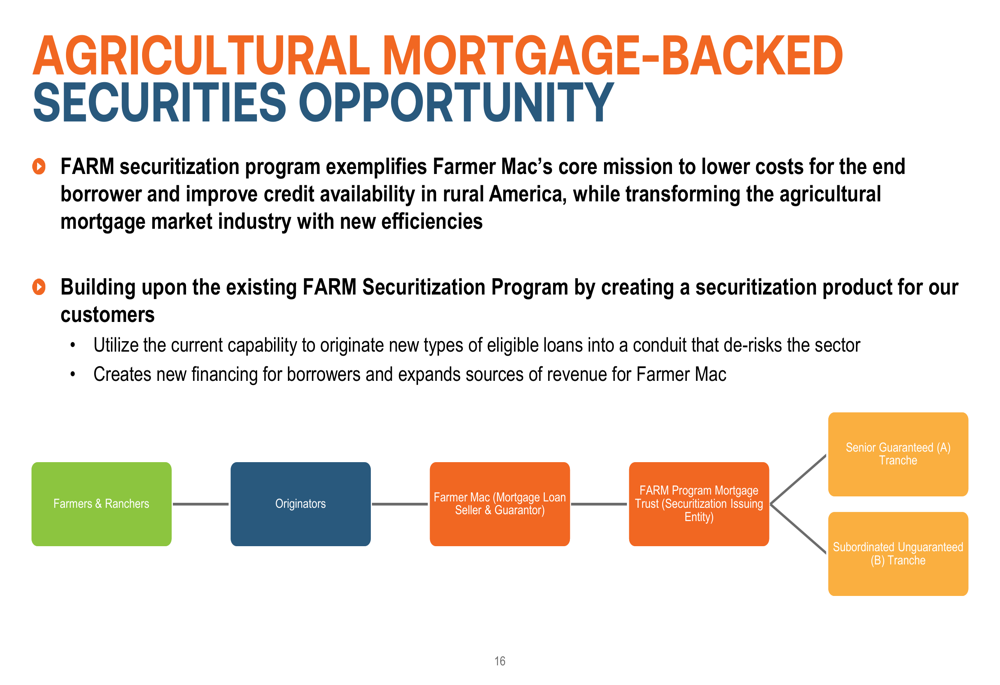
A key strategic initiative is the expansion of the FARM securitization program, which aims to transform the agricultural mortgage market by creating new efficiencies and revenue streams. This program allows Farmer Mac to achieve capital relief through the transfer of credit risk to capital markets while expanding financing options for borrowers.
The structure of this securitization opportunity is illustrated below:
This approach aligns with insights from Farmer Mac’s Q3 2024 earnings call, which highlighted the company’s expectation that its renewable energy loan portfolio could potentially triple in size during 2024, indicating continued momentum in this high-growth segment.
Capital Management and Shareholder Returns
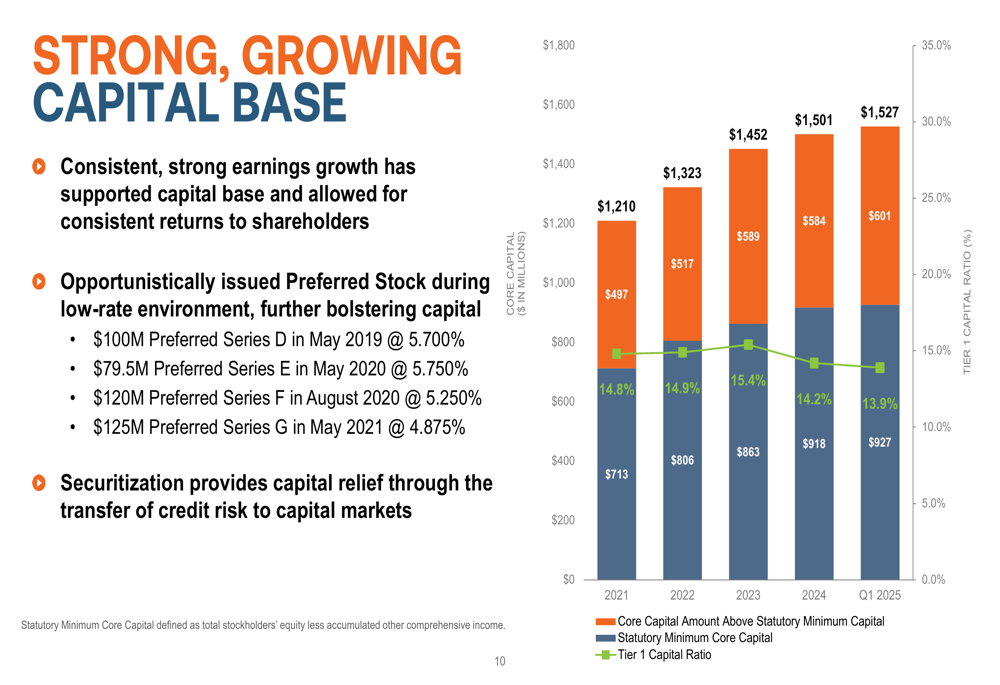
Farmer Mac maintains a strong capital position, with core capital exceeding the statutory minimum by $601 million as of Q1 2025. The company’s Tier 1 Capital Ratio stood at 13.9%, reflecting a slight decrease from 14.2% reported in Q3 2024 but still well above regulatory requirements.
The following chart illustrates Farmer Mac’s capital position over time:
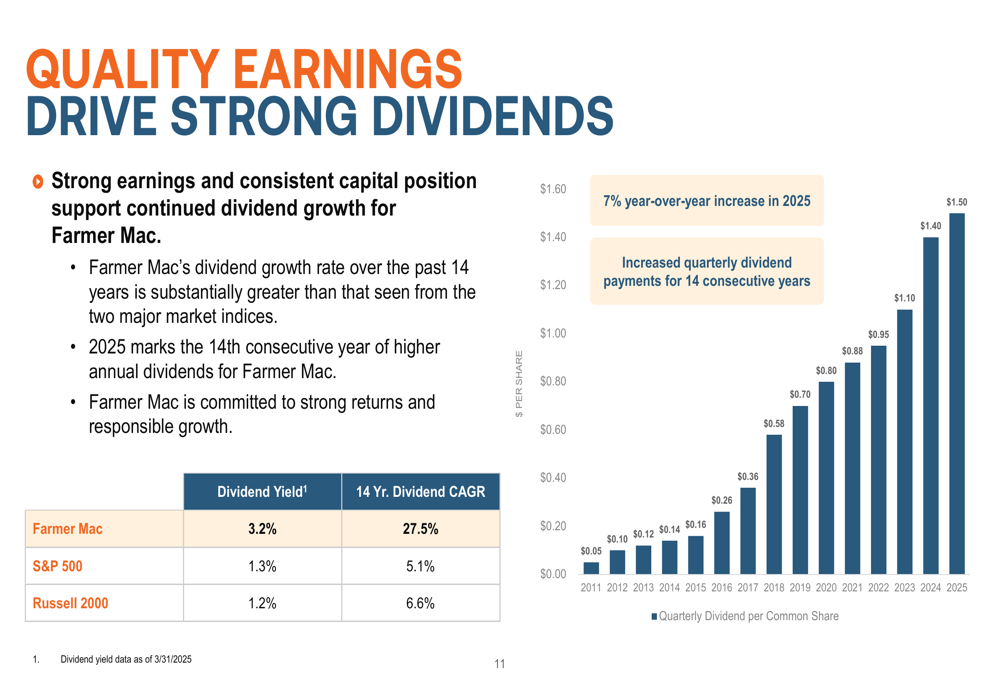
One of Farmer Mac’s most compelling attributes for investors is its consistent dividend growth. The company has increased its dividend for 14 consecutive years, with a remarkable 27.5% compound annual growth rate over the past 14 years. This dividend performance significantly outpaces major market indices and reflects the company’s commitment to delivering shareholder value.
The dividend growth trajectory is shown in the following chart:
Credit Quality and Risk Management
Farmer Mac’s credit performance continues to outshine its peers, with a historical charge-off rate of just 0.02%, compared to 0.87% for all commercial bank loans and leases. This superior credit performance stems from the company’s rigorous underwriting standards, which include a minimum total debt coverage ratio of 1.25x and loan-to-value ratios averaging 40-45% on purchased mortgages.
The company’s allowance for losses increased by $1.7 million to $27.0 million in Q1 2025, primarily due to volume growth in the Renewable Energy, Power & Utilities, and Farm & Ranch segments. This represents an increase from the $21.9 million reported in Q3 2024, suggesting a prudent approach to risk management as the company expands into new areas.
Forward-Looking Statements
Looking ahead, Farmer Mac is well-positioned to capitalize on several growth opportunities. The company’s competitive advantages—including its GSE status, disciplined asset-liability management, and lean operations—provide a solid foundation for continued expansion.
Key areas of focus include:
1. Expanding the renewable energy portfolio, building on momentum from 2024
2. Growing the agricultural mortgage-backed securities program to enhance capital efficiency
3. Leveraging technology to improve operational efficiency and customer experience
4. Maintaining disciplined underwriting standards while pursuing growth opportunities
While the company faces potential headwinds from interest rate volatility and agricultural market fluctuations, its diversified business model and strong capital position should provide resilience. The slight downward trend in the Tier 1 Capital Ratio (from 14.2% in Q3 2024 to 13.9% in Q1 2025) bears monitoring but remains well above regulatory requirements.
In summary, Farmer Mac’s Q1 2025 investor presentation portrays a financially sound organization with a clear strategic direction, focused on leveraging its unique position as a GSE to expand its footprint in agricultural and rural infrastructure financing while delivering consistent returns to shareholders.
Full presentation:
This article was generated with the support of AI and reviewed by an editor. For more information see our T&C.