Gold bars to be exempt from tariffs, White House clarifies

Introduction & Market Context
Farmers & Merchants Bancorp, Inc. (NASDAQ:FMAO), the holding company of F&M Bank, presented its fourth quarter 2024 investor presentation highlighting the company’s continued growth trajectory and strong financial position. The Ohio-based community bank, which has been serving communities since 1897, operates across Northwest Ohio, Northeast Indiana, and Southern Michigan with a focus on agricultural lending and community banking.
The presentation comes as regional banks continue to navigate a challenging interest rate environment while managing deposit competition and loan growth. FMAO’s stock closed at $25.25 on June 26, 2025, up 2.68% for the day, and trading within its 52-week range of $20.88 to $34.15.
Executive Summary
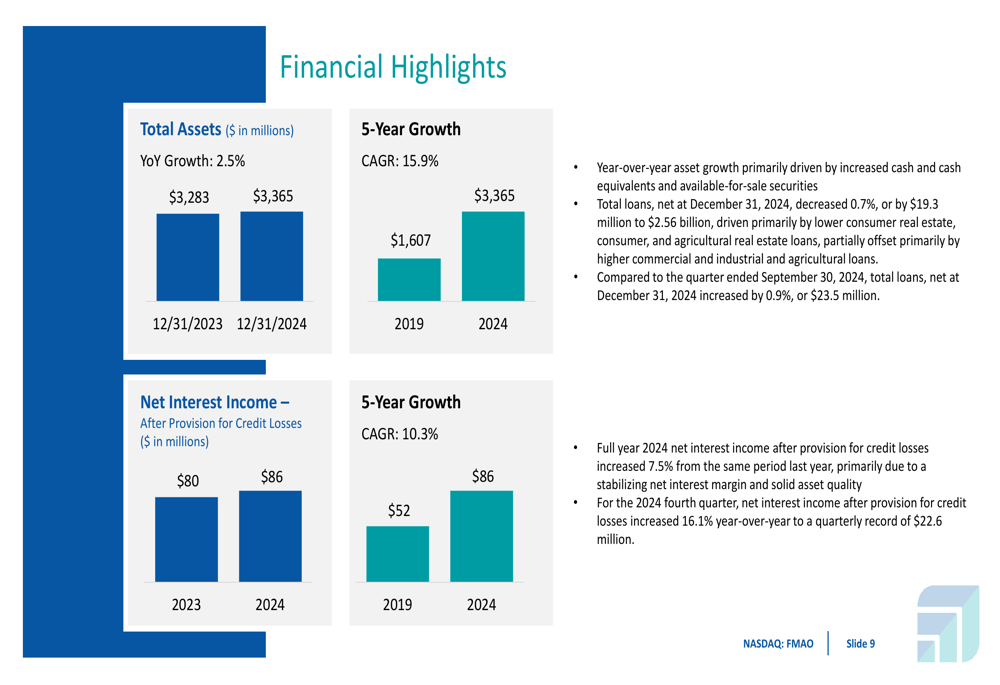
FMAO reported total assets of $3.365 billion as of December 31, 2024, representing a year-over-year increase of 2.5% and a five-year compound annual growth rate (CAGR) of 15.9%. The company has maintained a consistent growth strategy combining organic expansion with strategic acquisitions, having completed four successful bank acquisitions since 2019.
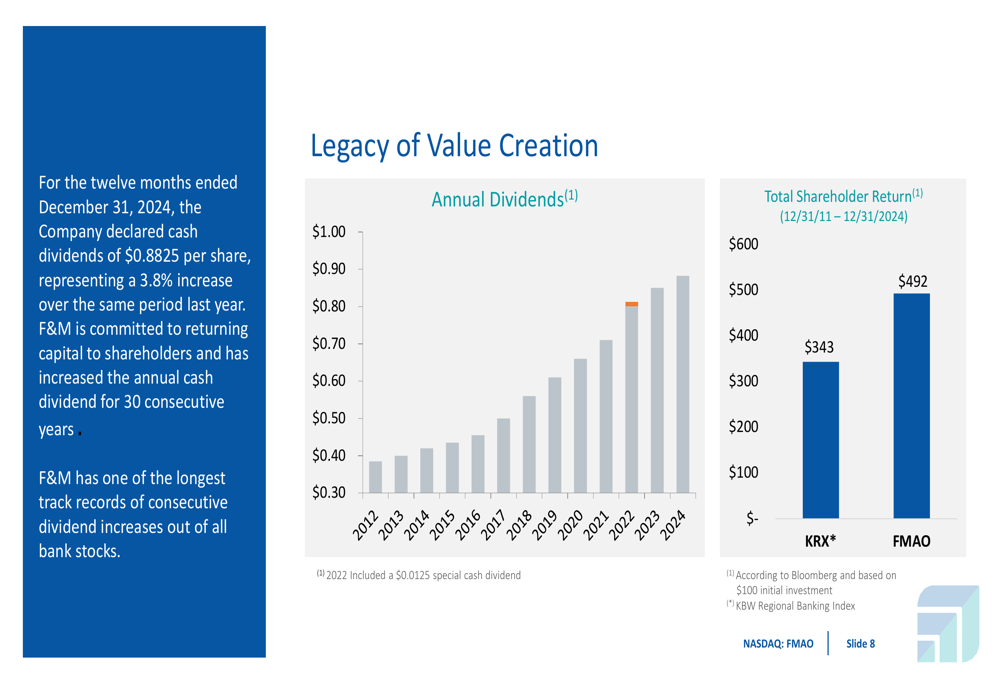
The bank’s financial performance is underpinned by strong deposit growth, with total deposits increasing 3.0% year-over-year to $2.69 billion. FMAO also highlighted its 30-year track record of increasing annual dividends, with cash dividends of $0.8825 per share declared for the twelve months ended December 31, 2024, representing a 3.8% increase over the previous year.
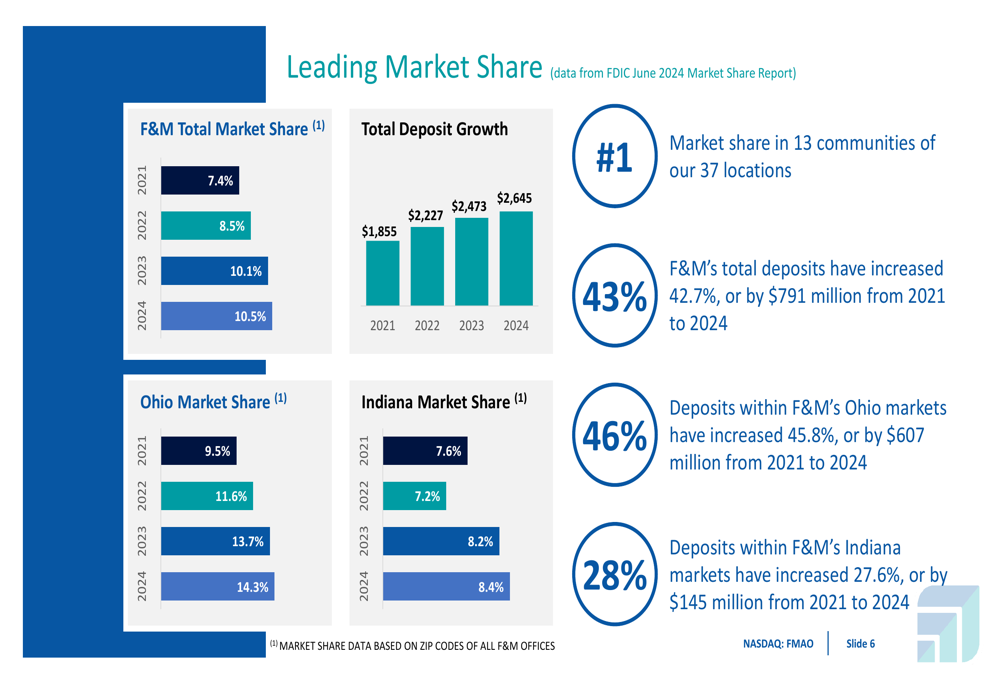
As shown in the following chart of total asset growth and market share gains:
Quarterly Performance Highlights
For the fourth quarter of 2024, FMAO reported record quarterly net interest income after provision for credit losses of $22.6 million, representing a 16.1% increase year-over-year. This growth was primarily attributed to a stabilizing net interest margin and solid asset quality.
Total (EPA:TTEF) loans, net at December 31, 2024, decreased slightly by 0.7% year-over-year to $2.56 billion, driven primarily by lower consumer real estate, consumer, and agricultural real estate loans. However, this was partially offset by higher commercial and industrial and agricultural loans. Compared to the previous quarter, total loans increased by 0.9% or $23.5 million.
The company’s full-year 2024 net interest income after provision for credit losses increased 7.5% from 2023, reaching $86 million. This represents a five-year CAGR of 10.3% from 2019.
The following chart illustrates the company’s financial highlights, including asset growth and net interest income:
Strategic Initiatives
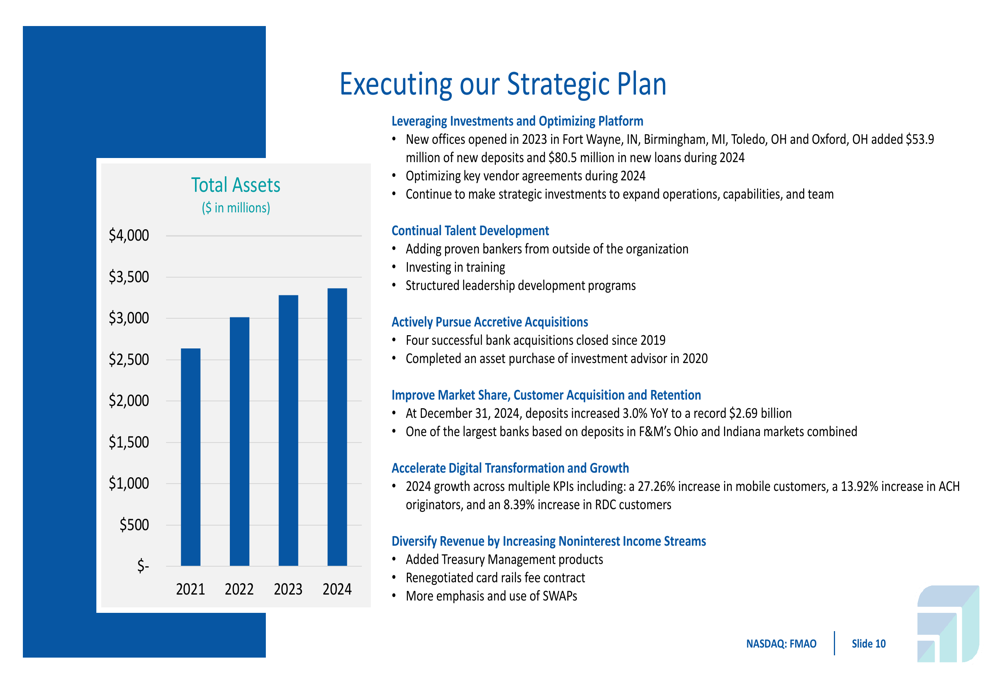
FMAO outlined several strategic initiatives aimed at driving future growth. The bank has been actively expanding its footprint, with four new offices opened in 2023 contributing $53.9 million in new deposits and $80.5 million in new loans during 2024. The company is also focusing on digital transformation, reporting significant growth in digital banking adoption metrics, including a 27.26% increase in mobile customers and a 13.92% increase in ACH originators.
The bank’s growth strategy emphasizes both organic expansion and strategic acquisitions, with a focus on increasing market share and improving its core funding strategy. FMAO reported leading market share positions in 13 of its 37 communities, with overall market share increasing from 7.4% in 2021 to 10.5% in 2024.
The company’s strategic plan execution is illustrated in the following chart:
Looking ahead to 2025, FMAO outlined four key priorities: controlled growth with a focus on low-cost deposits, enhanced profitability by leveraging prior investments, continued innovation to improve customer experience, and operational efficiency through process optimization and technology upgrades.
Financial Position and Asset Quality
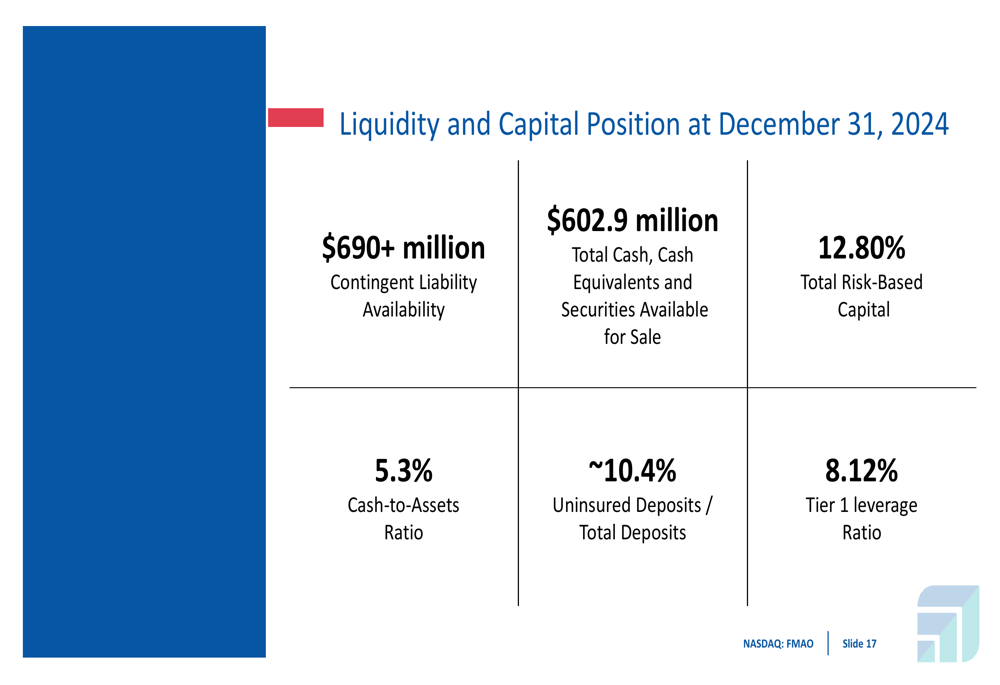
FMAO maintains a strong liquidity and capital position, with $602.9 million in total cash, cash equivalents, and securities available for sale as of December 31, 2024. The bank reported a cash-to-assets ratio of 5.3% and approximately 10.4% uninsured deposits as a percentage of total deposits. Capital ratios remain solid with a total risk-based capital ratio of 12.80% and a Tier 1 leverage ratio of 8.12%.
The following chart details the company’s liquidity and capital position:
Asset quality remains robust, with non-performing assets to total assets at just 0.09% and net charge-offs to loans at 0.01%. The allowance for credit losses stands at 1.08% of total loans, reflecting the bank’s conservative approach to risk management.
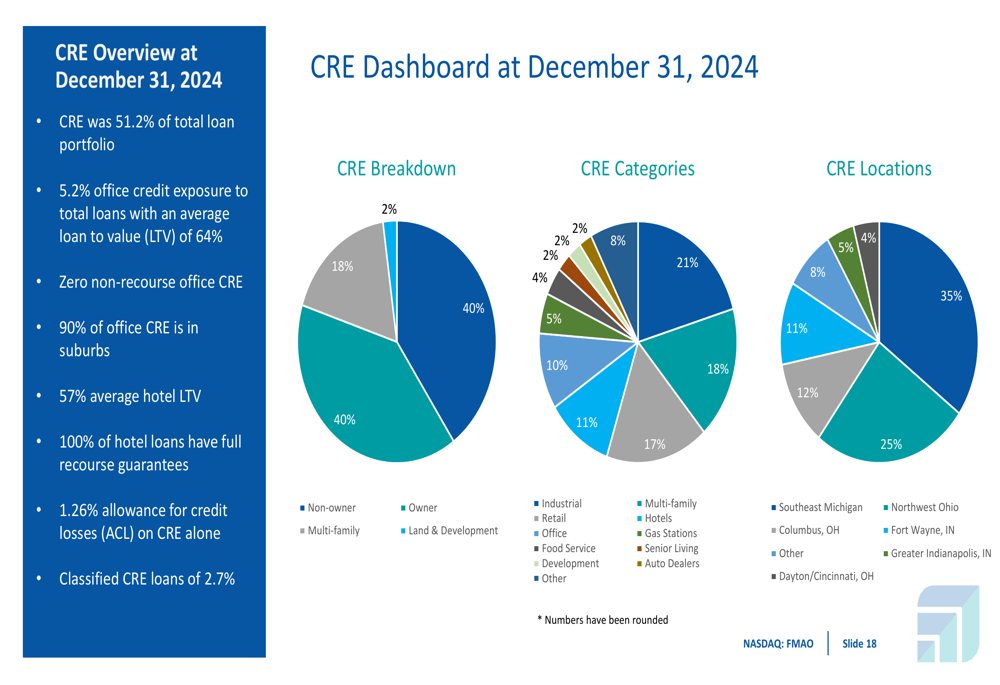
FMAO’s commercial real estate (CRE) portfolio, which represents 51.2% of the total loan portfolio, is well-diversified with conservative loan-to-value ratios. Office exposure is limited to 5.2% of total loans with an average LTV of 64%, and 90% of office CRE is located in suburbs. The hotel portfolio maintains an average LTV of 57% with 100% of loans having full recourse guarantees.
The breakdown of the CRE portfolio is illustrated in the following chart:
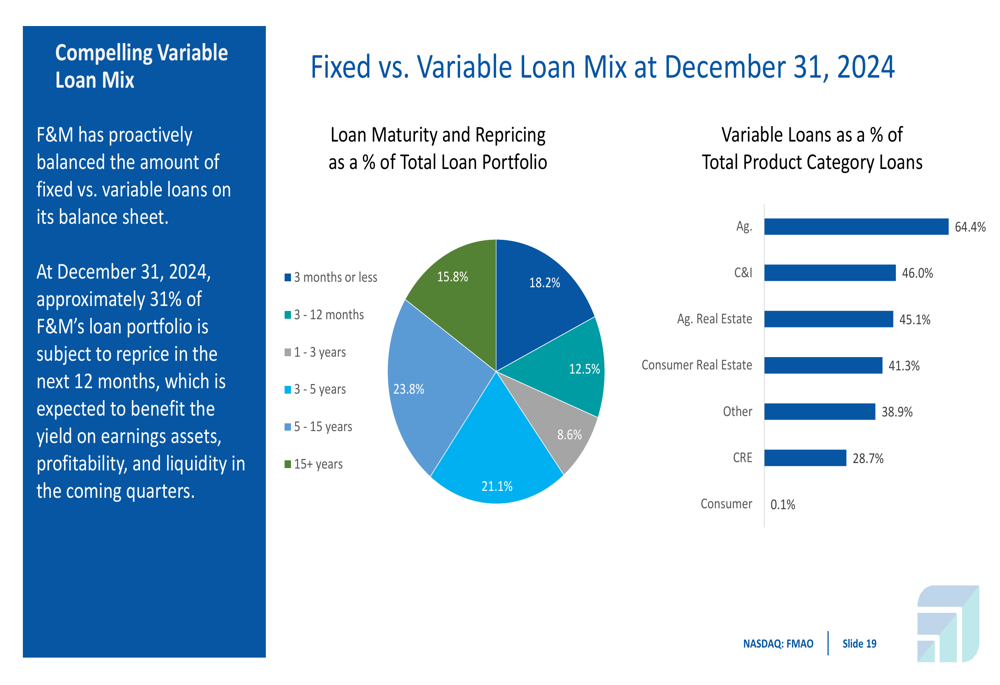
The bank has also strategically balanced its fixed versus variable rate loans, with approximately 31% of the loan portfolio subject to repricing within the next 12 months. This positioning helps the bank manage interest rate risk while potentially benefiting from higher rates on variable loans.
The following chart shows the company’s loan maturity and repricing schedule:
Forward-Looking Statements
FMAO’s agricultural lending remains a key differentiator and focus area, with total agricultural loans reaching $368 million as of December 31, 2024. The bank has been involved in agricultural lending since its founding in 1897, with experienced lenders averaging approximately 20 years in the business. The agricultural portfolio is characterized by low delinquencies (0.14% in Q4 2024) and conservative loan-to-value ratios.
The company’s shareholder value creation is supported by its 30-year history of increasing annual dividends. FMAO’s total shareholder return has outperformed the KBW Regional Banking Index (KRX) from December 31, 2011, to December 31, 2024, with FMAO returning $492 compared to KRX’s $343.
Looking forward, FMAO plans to continue its balanced approach to growth, focusing on deposit gathering, prudent loan growth, and operational efficiency. The bank aims to leverage its investments in new offices and digital capabilities while maintaining its strong asset quality and capital position.
With its established presence in agricultural markets, growing digital capabilities, and track record of consistent performance, Farmers & Merchants Bancorp appears well-positioned to navigate the evolving banking landscape while continuing to deliver value to shareholders.
Full presentation:
This article was generated with the support of AI and reviewed by an editor. For more information see our T&C.