Moody’s downgrades Senegal to Caa1 amid rising debt concerns

Introduction & Market Context
FGI Industries Ltd (NASDAQ:FGI), a global supplier of kitchen and bath products, presented its second quarter 2025 results on August 12, 2025, highlighting revenue growth amid ongoing profitability challenges. The company, which went public in January 2022, operates in a market environment characterized by tariff uncertainties that have clouded the demand outlook.
The presentation comes as FGI’s stock has experienced significant volatility, with shares dropping 13.62% in the most recent trading session to close at $3.89, though showing a slight recovery of 2.31% in after-hours trading. With a 52-week range of $2.28 to $5.50, the company continues to navigate challenging market conditions while implementing its strategic initiatives.
Quarterly Performance Highlights
FGI reported Q2 2025 revenue of $31.0 million, representing a 5.5% increase compared to the same period last year. However, profitability metrics showed continued pressure, with gross margin declining to 28.1%, down 240 basis points from the prior year quarter.
As shown in the following consolidated financial results:
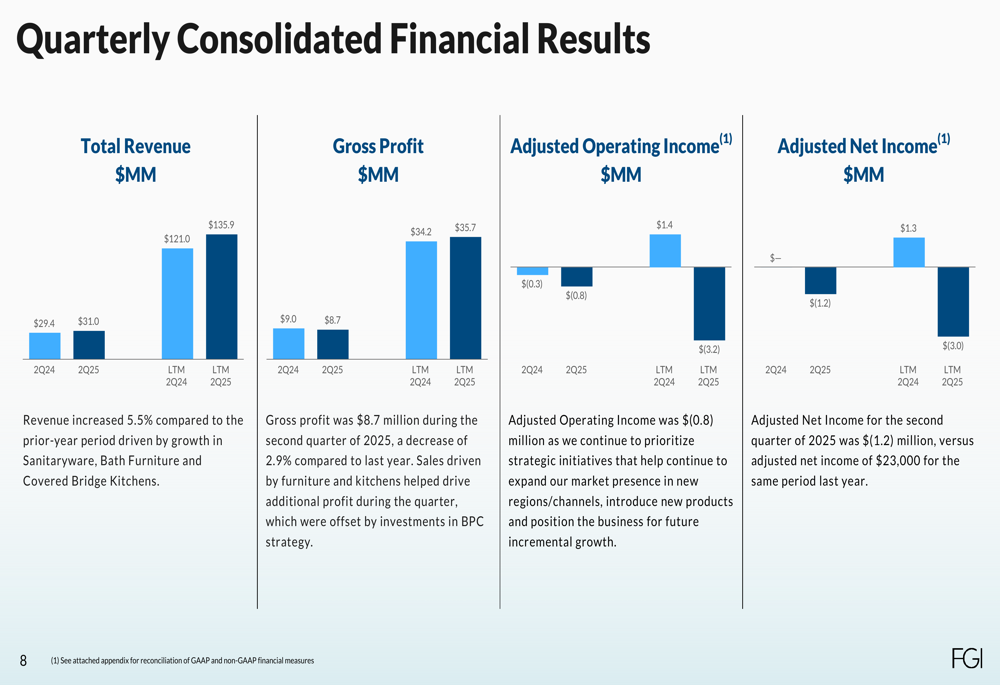
The company posted an adjusted operating loss of $0.8 million for the quarter, compared to a $0.3 million loss in Q2 2024. Similarly, adjusted net income deteriorated to a loss of $1.2 million, down from breakeven in the prior-year period. Despite these quarterly challenges, the trailing twelve-month results show some improvement in adjusted operating loss, narrowing from $3.2 million to $1.4 million year-over-year.
Segment Performance Analysis
FGI’s business portfolio demonstrated mixed performance across its various segments. The company maintains a diverse revenue mix with sanitaryware representing nearly 60% of total sales, followed by shower systems, bath furniture, and other products.
The quarterly business line results reveal varying growth trajectories across segments:
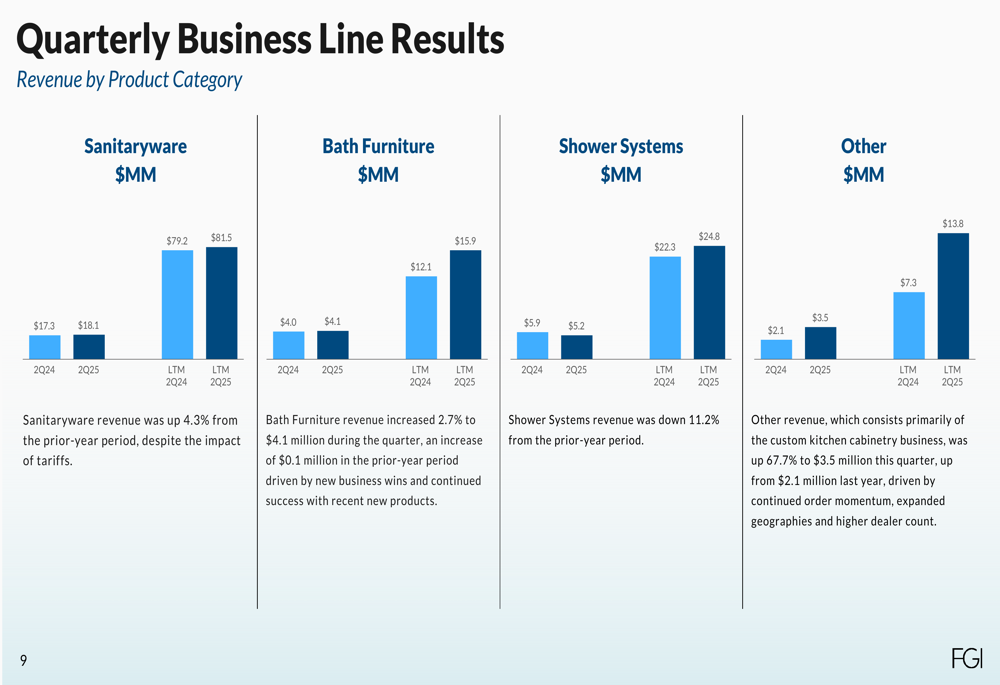
Sanitaryware, the company’s largest segment, grew 4.3% to $18.1 million in Q2 2025. Bath furniture revenue increased by a modest 2.7% to $4.1 million. The "Other" category, which primarily consists of custom kitchen cabinetry, showed the strongest growth at 67.7%, reaching $3.5 million. However, shower systems revenue declined by 11.2% to $5.2 million, partly attributed to tariff-related challenges affecting the JETCOAT® brand.
The company’s geographic diversification continues to be weighted toward North America, with the United States accounting for 61% of revenue and Canada contributing 26.4%. European markets represent 10.5% of sales, with the remainder coming from other global regions.
Balance Sheet and Liquidity Position
FGI’s financial position shows increasing pressure on the balance sheet, with rising inventory levels and net debt compared to previous years. The company reported total liquidity of $16.4 million at the end of Q2 2025, down from $22.6 million in Q2 2023.
The following chart illustrates the company’s balance sheet and liquidity trends:
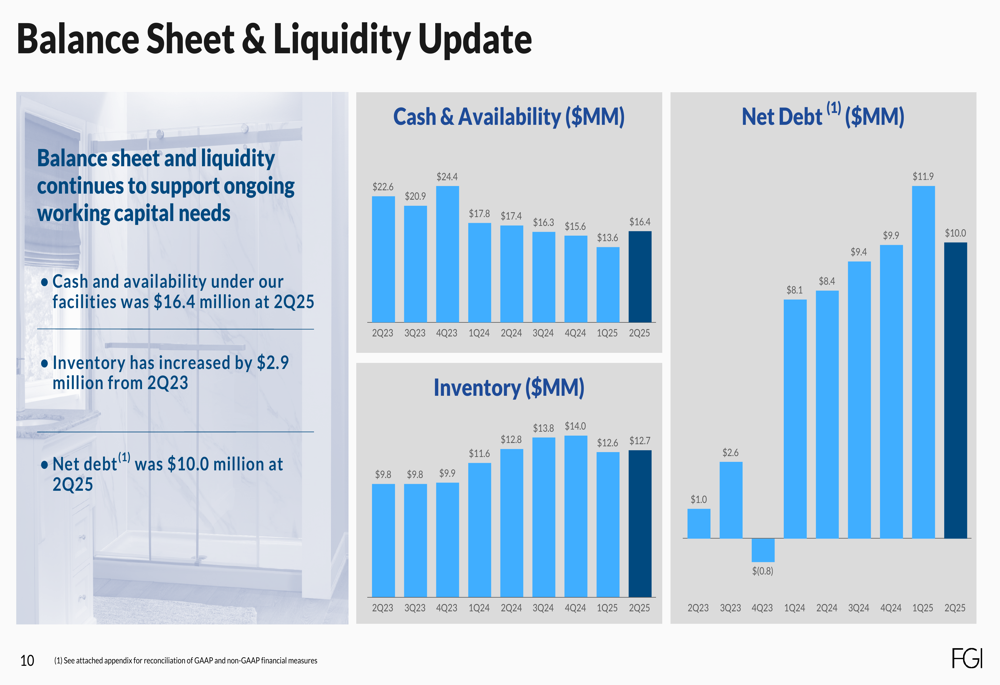
Net debt increased to $10.0 million in Q2 2025, compared to $2.6 million in Q2 2023, reflecting the company’s increased leverage. Inventory levels have also risen to $14.0 million, up from $9.8 million two years earlier, potentially indicating slower inventory turnover or strategic stocking decisions amid supply chain uncertainties.
Strategic Initiatives and Outlook
FGI continues to implement its "BPC" strategy focused on Brands, Products, and Channels to drive organic growth. The company highlighted several strategic developments in its presentation:
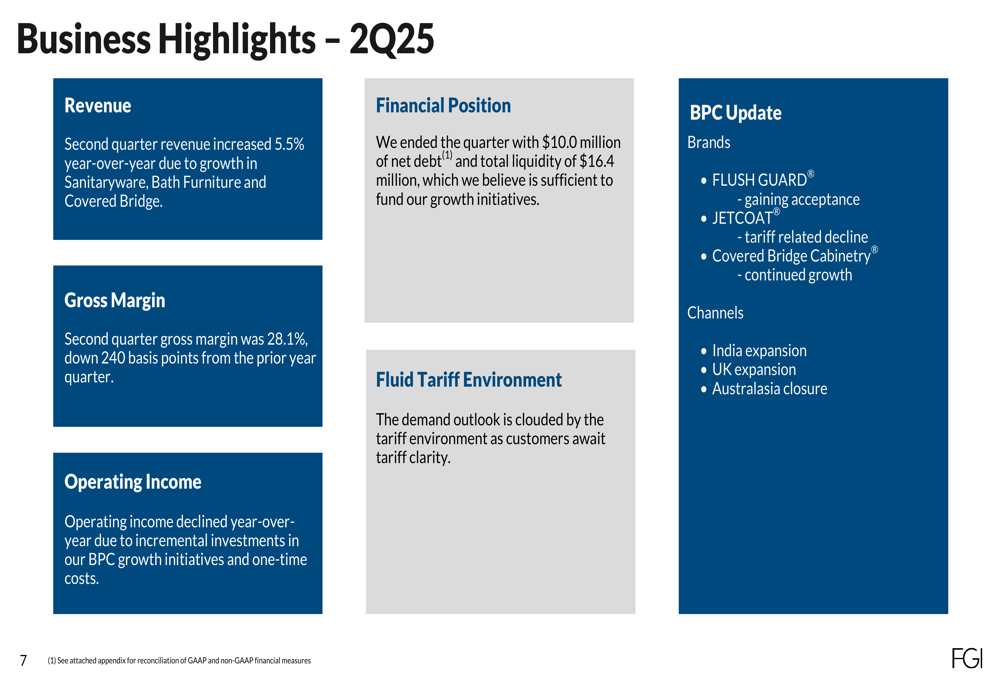
On the brand front, FLUSH GUARD® is gaining market acceptance while JETCOAT® experienced a tariff-related decline. The Covered Bridge Cabinetry® line continues to show growth momentum. Geographically, the company is expanding in India and the UK while closing operations in Australasia as part of its channel optimization efforts.
The company emphasizes its capital-efficient operating model and strong partner relationships as key competitive advantages in the current market environment. FGI’s investment thesis centers on being a trusted global supplier with strong organic growth potential and attractive margin improvement opportunities.
Forward-Looking Guidance
Looking ahead, FGI provided financial guidance for the full year 2025:
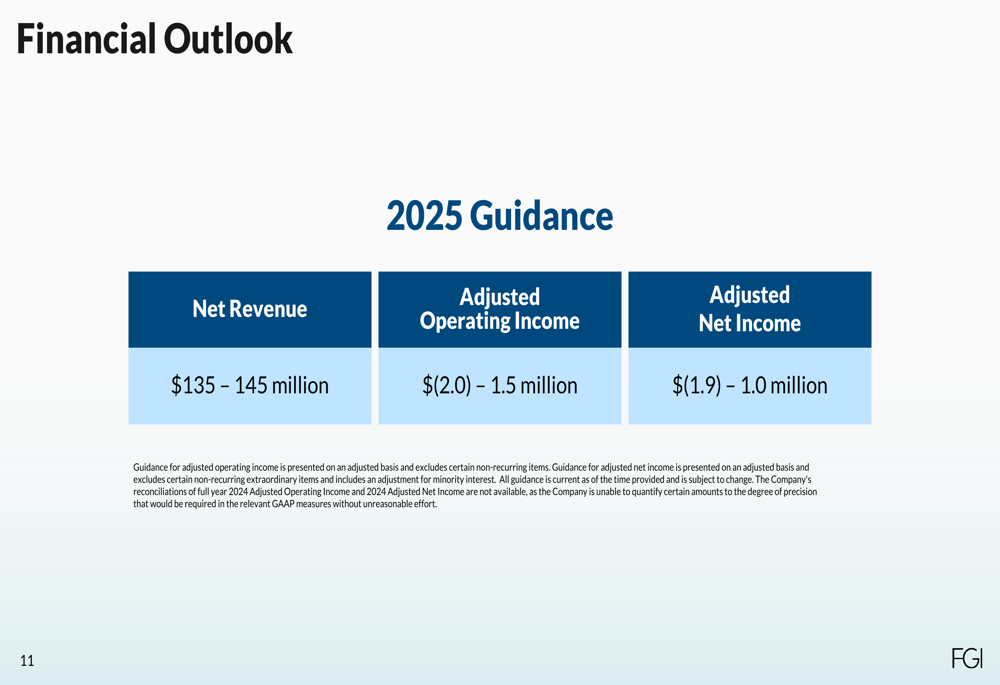
The company projects annual revenue between $135 million and $145 million, with adjusted operating income ranging from a $2.0 million loss to a $1.5 million gain. Adjusted net income is expected to fall between a $1.9 million loss and a $1.0 million profit.
These projections reflect management’s cautious outlook amid tariff uncertainties and challenging market conditions, while also acknowledging potential upside from the company’s strategic initiatives. The guidance suggests that while revenue growth continues, the path to consistent profitability remains challenging in the near term.
FGI’s management remains focused on driving shareholder value through strategic priorities, including organic growth initiatives, enhanced financial performance, and disciplined capital deployment. However, investors will likely continue to monitor the company’s progress toward sustainable profitability as it navigates the current market headwinds.
Full presentation:
This article was generated with the support of AI and reviewed by an editor. For more information see our T&C.