TSX runs higher on rate cut expectations

Introduction & Market Context
Fair Isaac Corporation (NYSE:FICO) released its third-quarter fiscal 2025 financial results on July 30, 2025, showcasing robust performance across key metrics. The company reported significant revenue growth, driven primarily by its Scores segment, while maintaining strong margins and improving free cash flow generation. This follows a second quarter where the company beat earnings expectations but slightly missed revenue forecasts, which had triggered a 4.82% stock decline in after-hours trading at that time.
The current presentation comes as FICO shares trade at $1,505.06, up 1.51% on the day of the announcement, but still well below the 52-week high of $2,402.52. The company’s market performance reflects ongoing investor scrutiny of its ability to sustain growth amid changing economic conditions.
Quarterly Performance Highlights
FICO delivered impressive financial results for Q3 2025, with total revenue reaching $536.4 million, representing a 20% year-over-year increase and an 8% sequential improvement from Q2. Non-GAAP diluted earnings per share rose to $8.57, up 37% year-over-year and 10% quarter-over-quarter, demonstrating the company’s continued ability to translate revenue growth into stronger bottom-line performance.
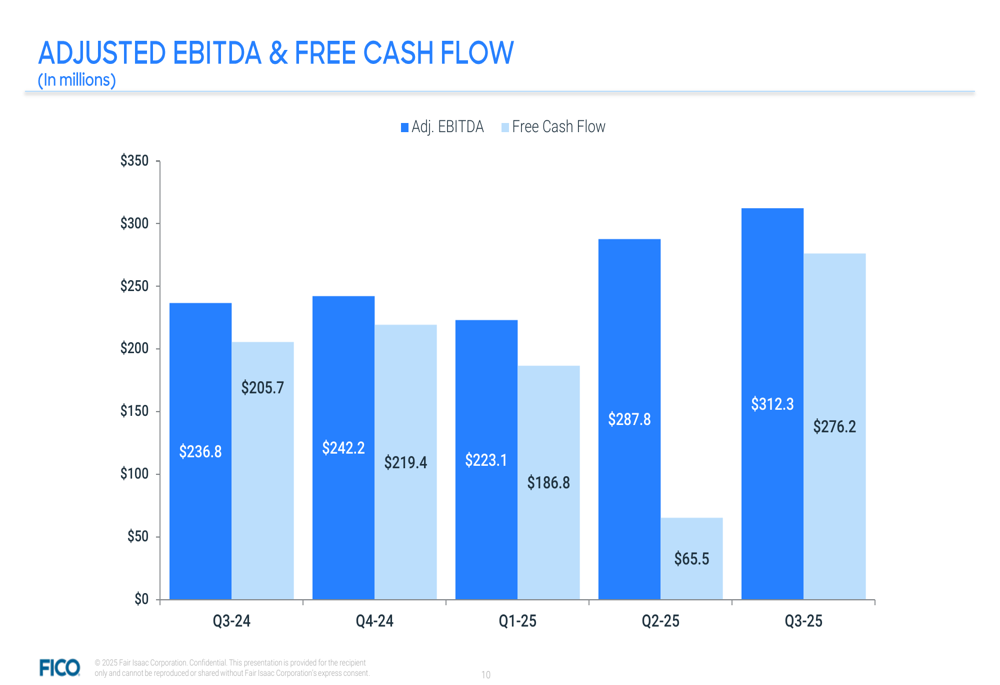
As shown in the following chart of quarterly operating results:
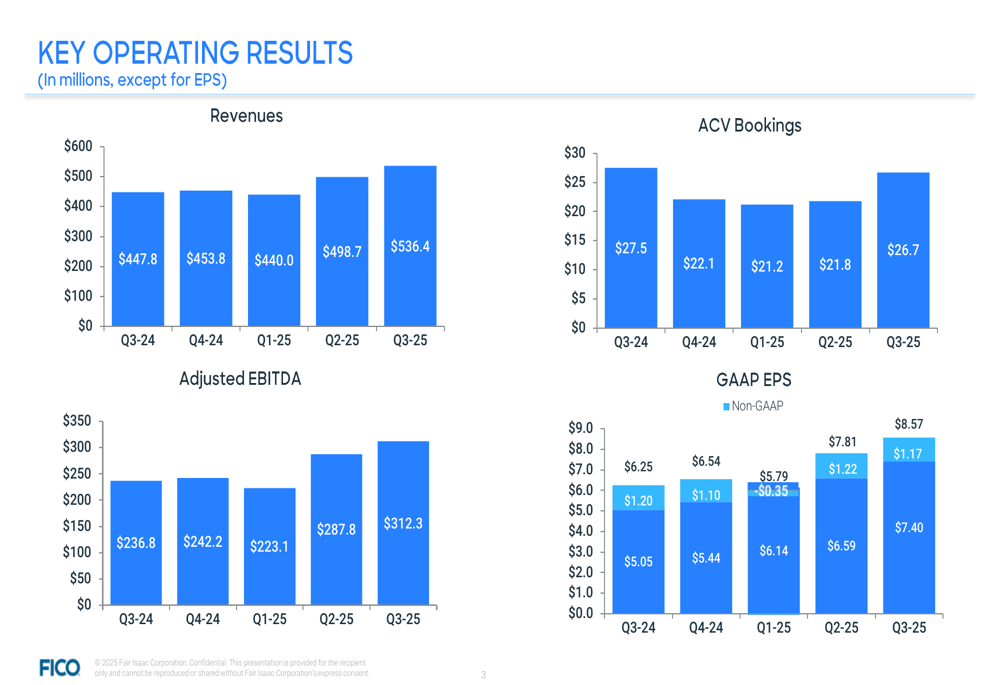
Adjusted EBITDA reached $312.3 million in Q3 2025, a 32% increase from the same period last year and a 9% improvement from the previous quarter. Perhaps most notably, free cash flow rebounded significantly to $276.2 million, a substantial recovery from Q2’s $65.5 million.
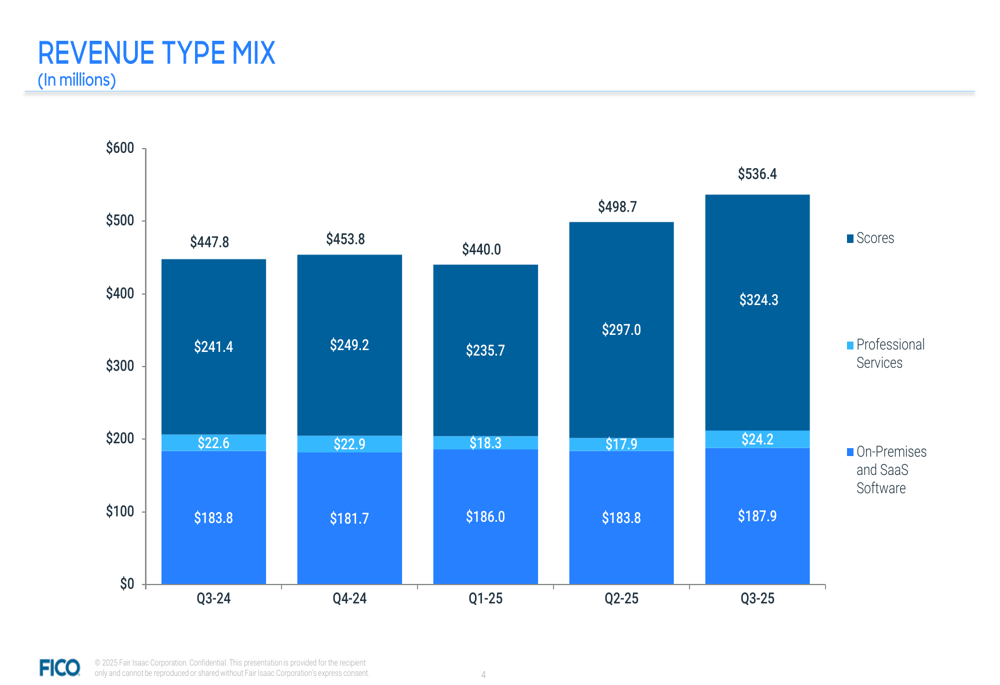
The company’s revenue mix continues to evolve, with the Scores segment now representing a larger portion of overall revenue:
Segment Analysis
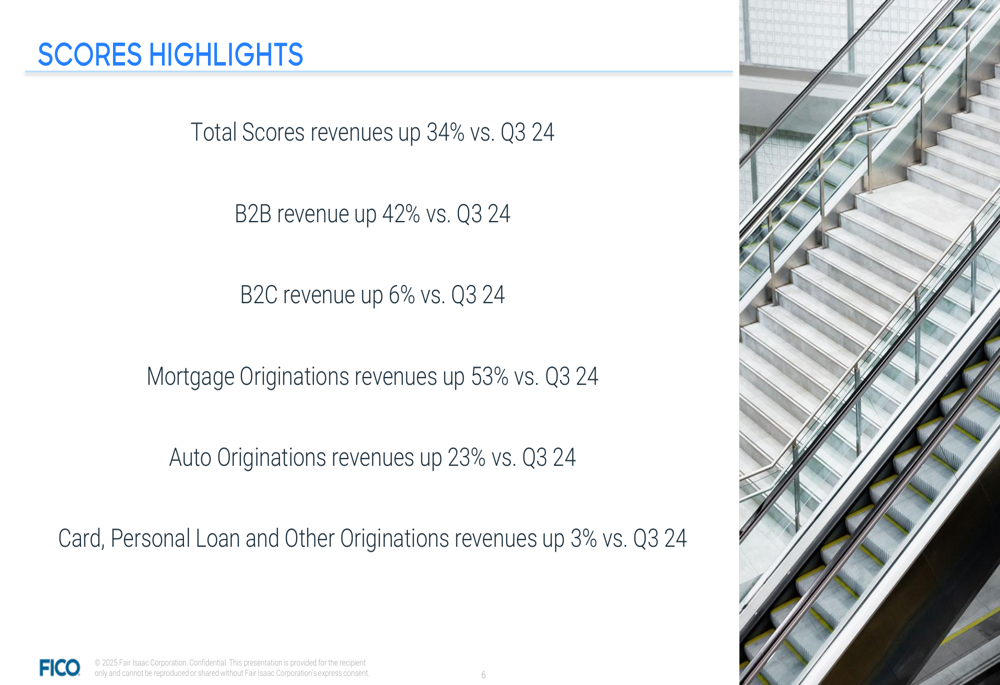
The Scores segment emerged as the primary growth driver, with revenue of $324.3 million, representing a remarkable 34% year-over-year increase and a 9% sequential improvement. This performance was fueled by particularly strong growth in mortgage originations, which increased 53% year-over-year, and auto originations, which grew 23% compared to the same period last year.
The following highlights illustrate the strength across various components of the Scores business:
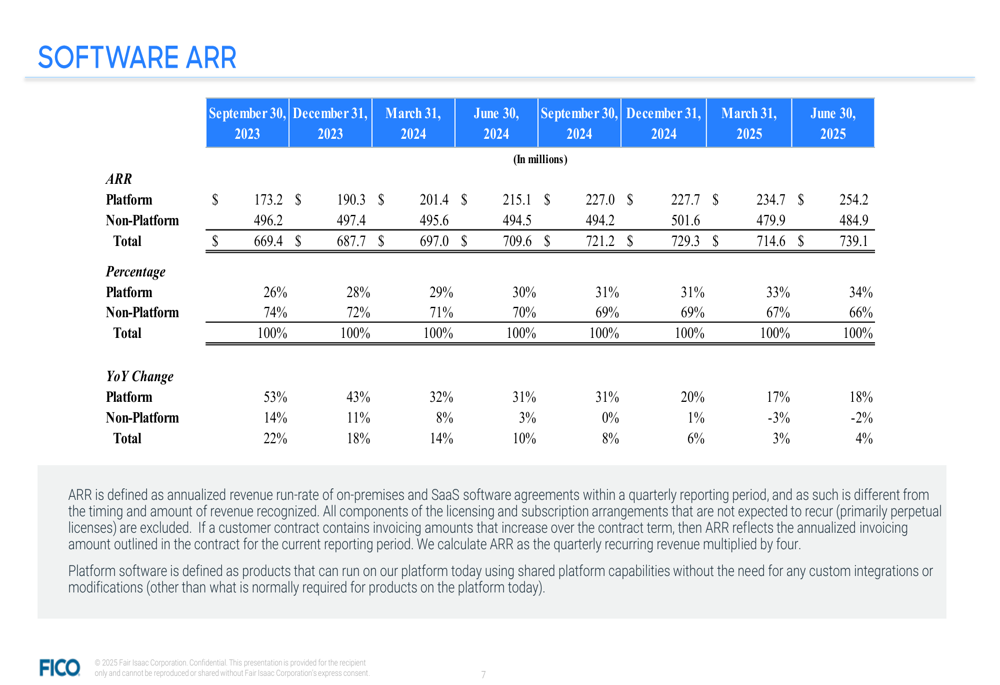
Meanwhile, the Software (ETR:SOWGn) segment showed more modest growth, with revenue of $212.1 million, up 3% year-over-year and 5% quarter-over-quarter. Software Annual Recurring Revenue (ARR) reached $739.1 million, a 4% increase from the previous year. The Platform portion of the software business demonstrated stronger momentum with a Dollar-Based Net Retention Rate (DBNRR) of 115%, compared to 97% for Non-Platform offerings.
The detailed breakdown of Software ARR shows the growing importance of platform solutions:
Software ACV (Annual Contract Value) Bookings for Q3 2025 came in at $26.7 million, showing a 22% sequential improvement from Q2 but a slight 3% decline year-over-year. This metric will be important to monitor as an indicator of future software revenue growth.
Margin and Profitability Trends
FICO maintained strong profitability metrics in Q3 2025, with Non-GAAP operating margin at 57%, representing a 5 percentage point improvement year-over-year, though slightly down from Q2’s 58%. Non-GAAP net margin held steady at 39%, up 4 percentage points from the same period last year.
The company’s expense structure remained well-controlled, as illustrated in the following breakdown:
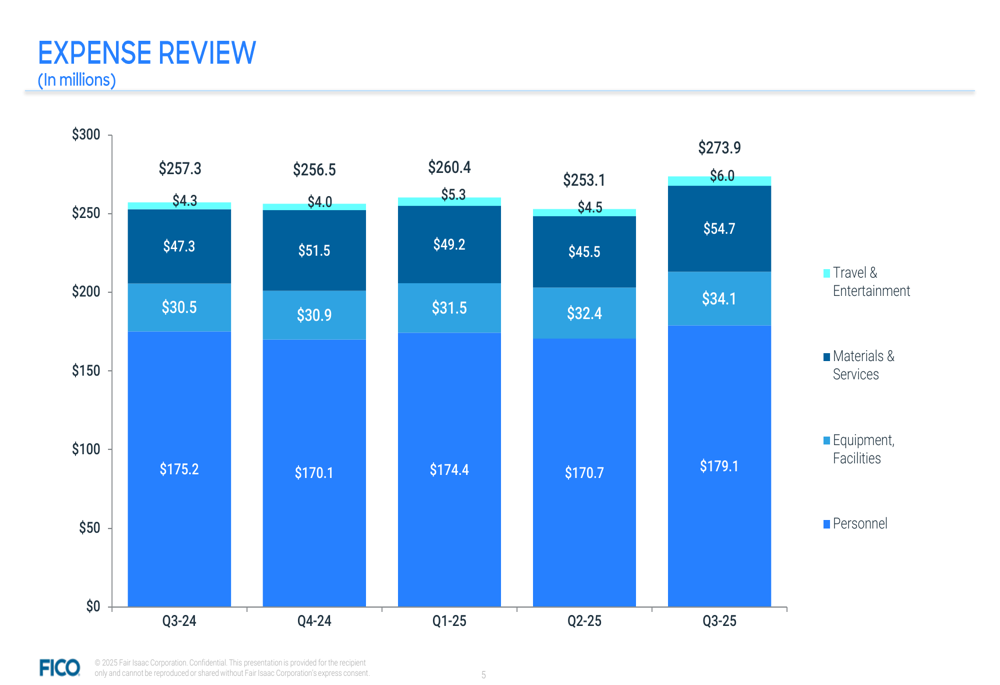
Total (EPA:TTEF) expenses for Q3 2025 reached $273.9 million, with personnel costs representing the largest component at $179.1 million. The relatively modest increase in expenses compared to revenue growth demonstrates the company’s operational leverage and efficiency.
The segment profitability breakdown provides further insight into the performance of each business unit:
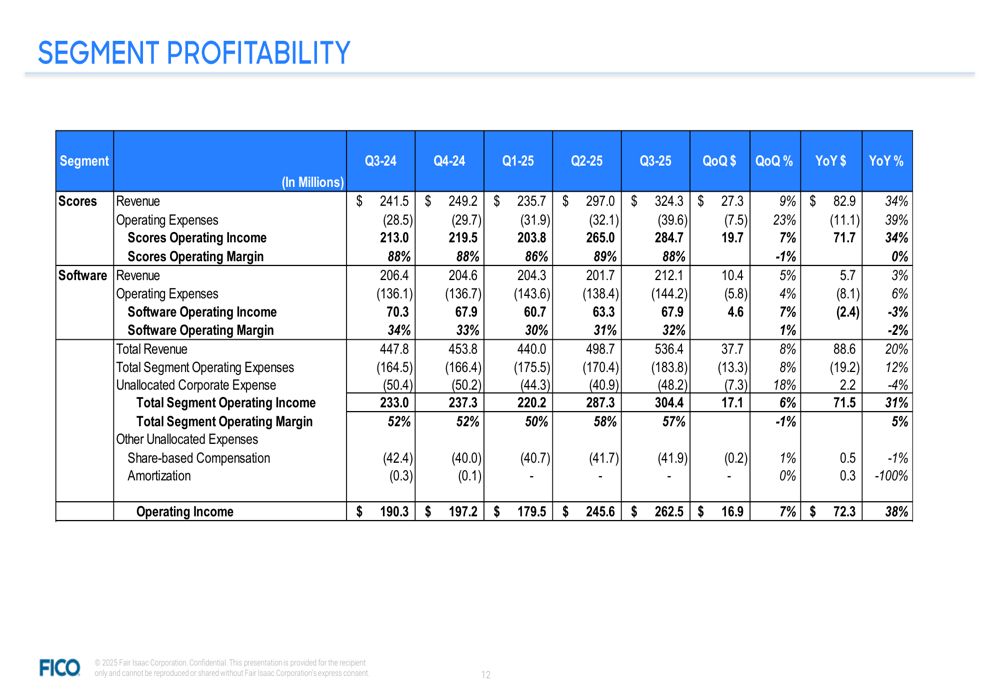
The Scores segment continues to be the profit powerhouse with an operating income of $284.7 million in Q3 2025, while the Software segment contributed $67.9 million. The total segment operating income of $304.4 million translated to a company-wide operating income of $262.5 million after corporate expenses.
Forward-Looking Statements
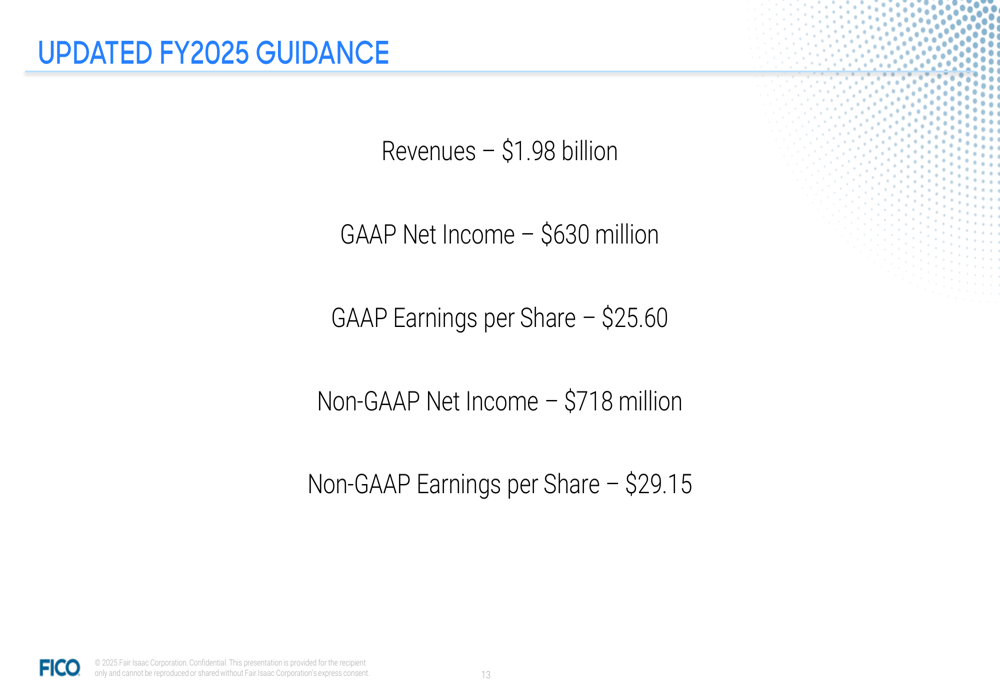
FICO maintained its fiscal year 2025 guidance, projecting total revenue of $1.98 billion and Non-GAAP earnings per share of $29.15. This consistency in guidance suggests management confidence in the company’s ability to sustain its current growth trajectory.
The company’s strong free cash flow generation, as shown in the chart below, provides additional financial flexibility for potential investments, debt reduction, or shareholder returns:
From a balance sheet perspective, FICO reported total assets of $1,862.0 million as of Q3 2025, representing a 9% increase year-over-year. The company’s leverage covenant stood at 2.47, while Days Sales Outstanding was 85 days, indicating relatively stable working capital management.
As FICO moves into the final quarter of fiscal 2025, investors will be closely watching whether the strong momentum in the Scores segment can be maintained, particularly in mortgage and auto originations, while also monitoring the pace of growth in the Software segment, which represents a strategic priority for long-term diversification and expansion.
Full presentation:
This article was generated with the support of AI and reviewed by an editor. For more information see our T&C.