Gold bars to be exempt from tariffs, White House clarifies

Introduction & Market Context
Fifth Third Bancorp (NASDAQ:FITB) released its second quarter 2025 earnings presentation on July 17, 2025, revealing its strongest pre-provision net revenue (PPNR) growth in two years. The bank reported adjusted earnings per share of $0.90, showing continued momentum from its first quarter performance. The stock reacted positively in premarket trading, up 1.05% to $43.50, building on the previous day’s close of $43.05.
The presentation highlighted Fifth Third’s success in generating positive operating leverage for the third consecutive quarter, while also improving credit quality metrics and maintaining strong capital and liquidity positions. These results come amid a gradually declining interest rate environment, with the bank’s guidance assuming a Federal funds rate of 3.75% by year-end 2025.
Quarterly Performance Highlights
Fifth Third reported adjusted earnings per share of $0.90 for the second quarter, with adjusted return on assets (ROA) of 1.22% and adjusted return on equity (ROE) of 13.0%. The bank’s adjusted pre-provision net revenue reached $1.002 billion, representing the highest growth rate in two years.
As shown in the following chart of key financial metrics, the bank demonstrated strong performance across multiple indicators:
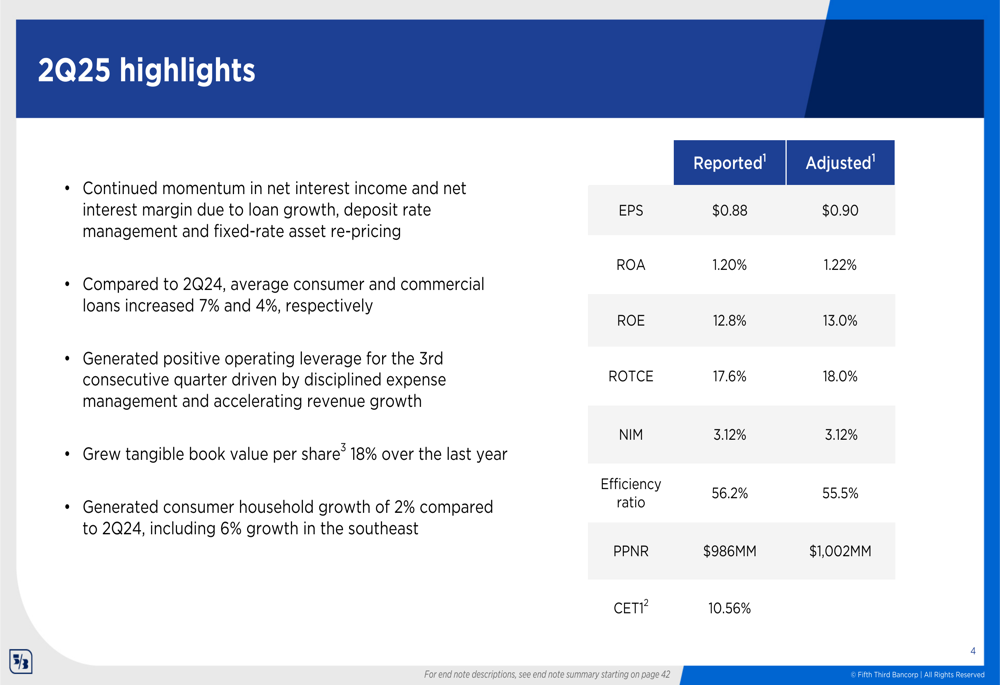
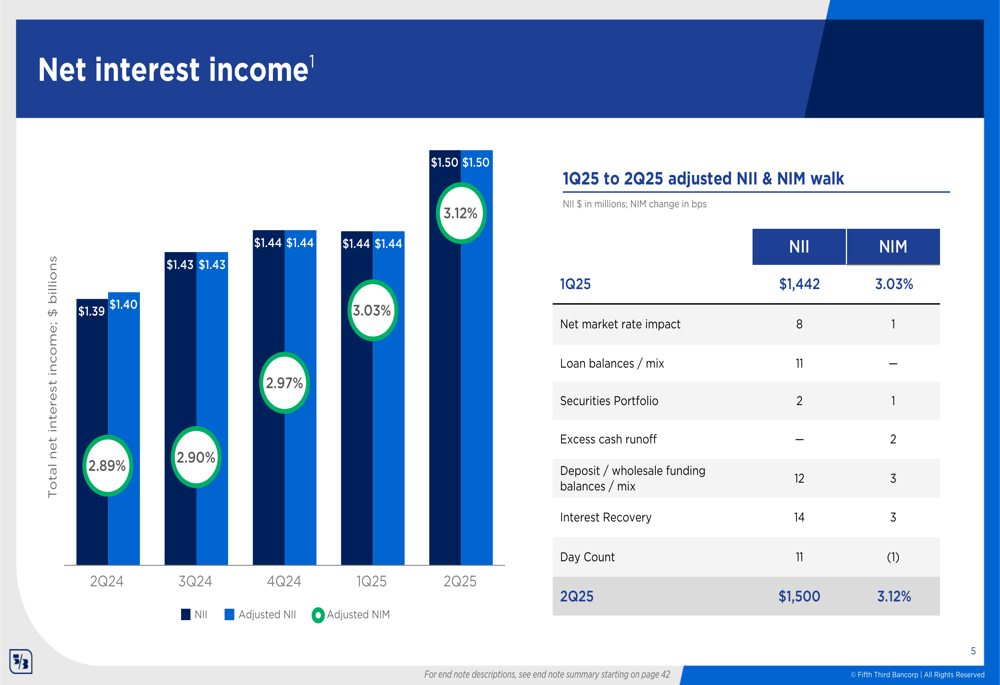
Net interest income (NII) showed notable improvement, reaching $1.50 billion in Q2, up from $1.44 billion in the previous quarter. The net interest margin (NIM) expanded to 3.12%, continuing an upward trend from 3.03% in Q1 2025 and 2.89% in Q2 2024.
The following chart illustrates this positive trajectory in NII and NIM:
The bank’s efficiency ratio improved to 55.5% on an adjusted basis, representing a 130 basis point improvement compared to Q2 2024. This improvement reflects the bank’s continued focus on expense discipline while investing in strategic growth initiatives.
Detailed Financial Analysis
Net Interest Income and Margin
Fifth Third’s net interest income growth was driven by several factors, including loan growth, deposit rate management, and fixed-rate asset re-pricing. The quarter-over-quarter increase of $58 million in NII was attributed to deposit and wholesale funding mix improvements ($12 million), loan balances and mix ($11 million), day count impact ($11 million), interest recovery ($14 million), and net market rate impact ($8 million).
The net interest margin expanded by 9 basis points sequentially, benefiting from deposit and funding mix (3 bps), excess cash runoff (2 bps), and interest recovery (3 bps), partially offset by day count impact (-1 bps).
Fee Income and Expense Management
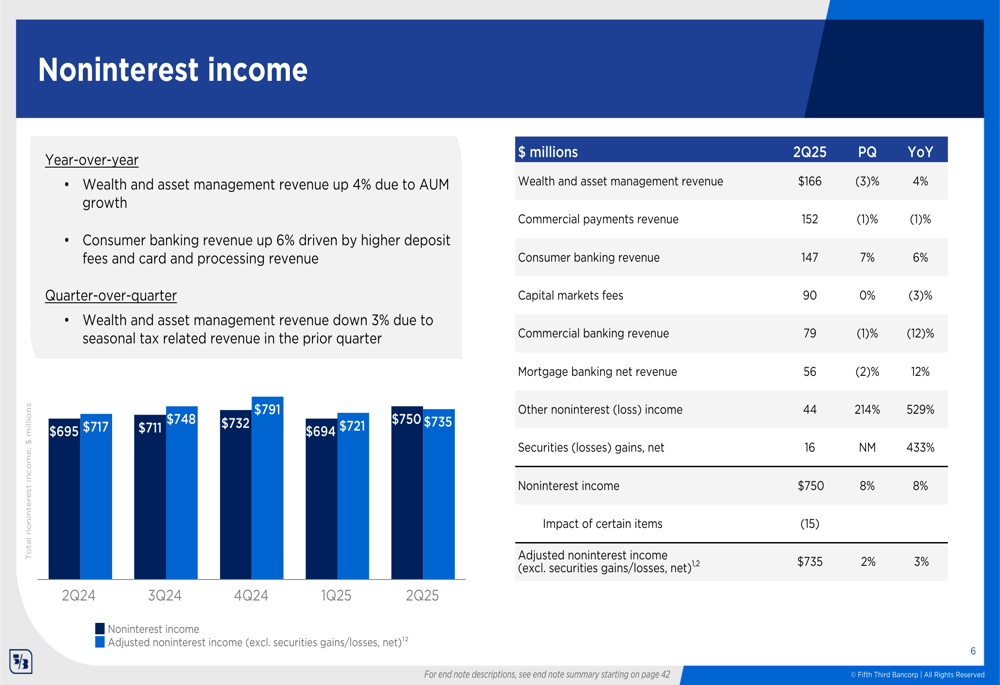
Noninterest income reached $750 million in Q2 2025, up 8% year-over-year. Excluding securities gains, adjusted noninterest income was $735 million, representing a 3% increase from Q2 2024. The bank’s fee income growth was primarily driven by wealth and asset management (up 4% YoY) and consumer banking revenue (up 6% YoY).
The following chart details the components of noninterest income:
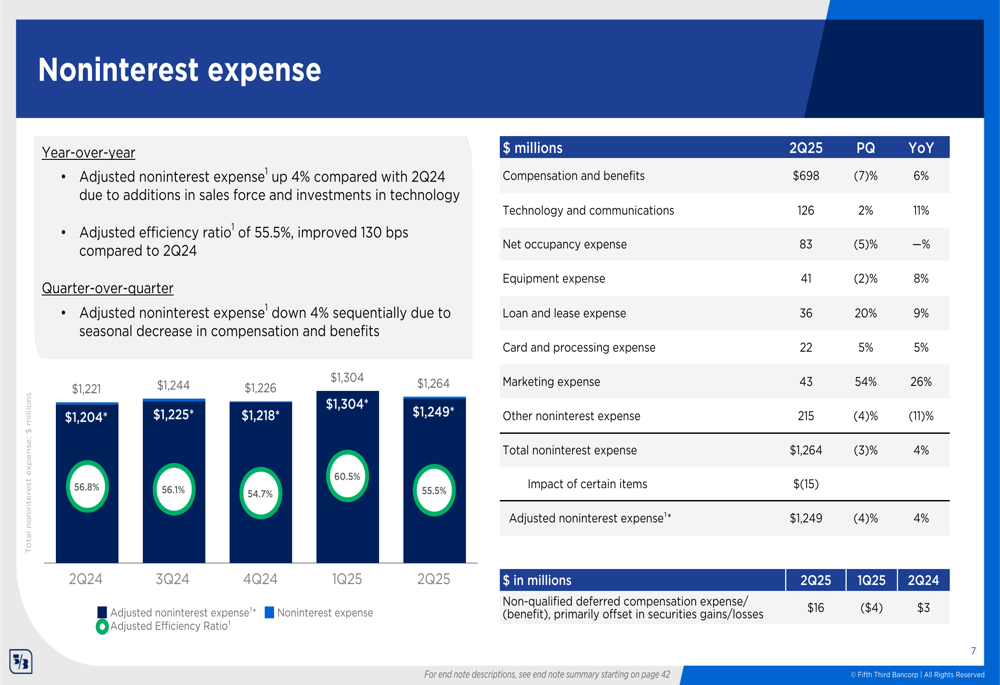
On the expense side, Fifth Third maintained disciplined cost management while continuing to invest in strategic growth initiatives. Adjusted noninterest expense was $1.249 billion, up 4% year-over-year but down 4% sequentially due to seasonal decreases in compensation and benefits.
The expense breakdown is illustrated in the following chart:
Loan and Deposit Trends
Fifth Third reported average loan and lease balances of $123.1 billion, with commercial loans at $75.4 billion and consumer loans at $47.7 billion. Average consumer loans increased 7% year-over-year, while commercial loans grew by 4%.
The following chart shows the loan portfolio composition and trends:
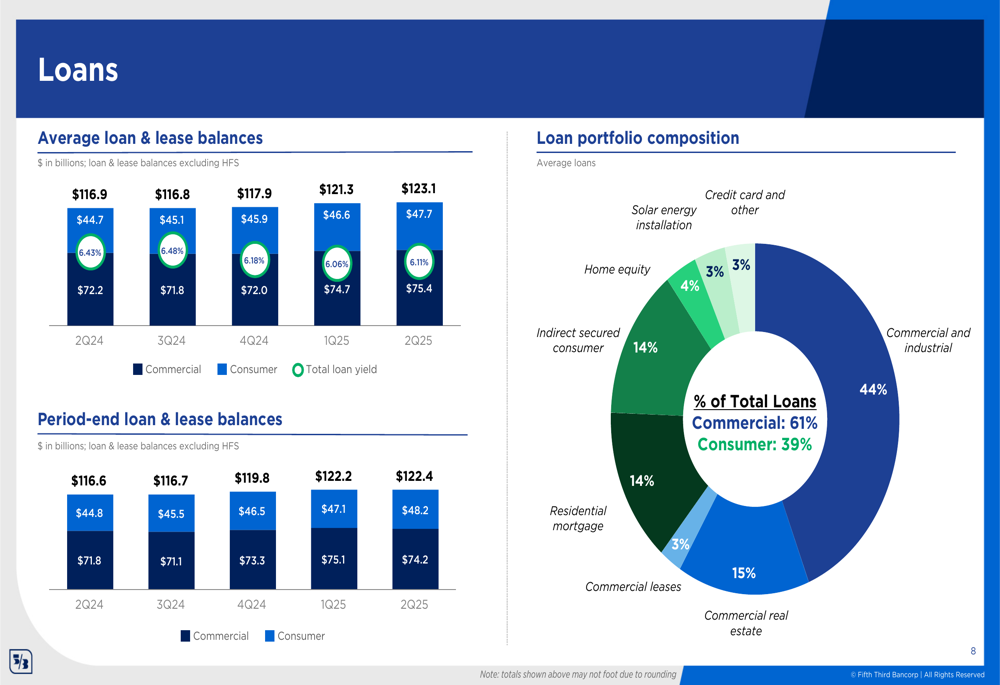
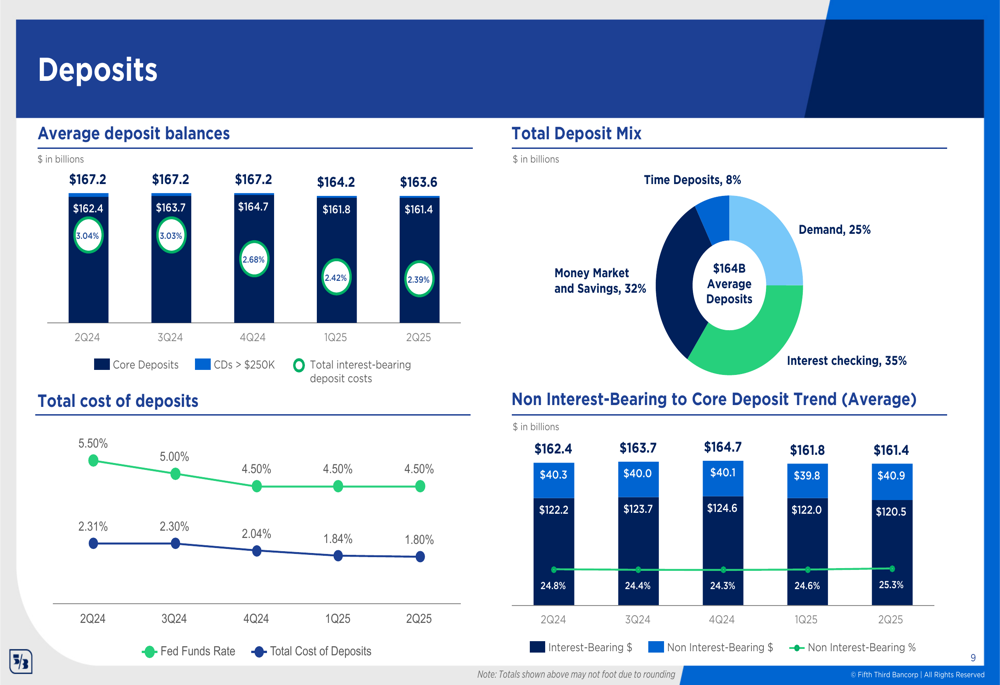
On the deposit side, average balances totaled $163.6 billion, with a favorable shift in mix as non-interest-bearing deposits increased to 25.3% of total deposits, up from 24.6% in Q1 2025. The cost of deposits declined to 1.80%, down from 1.84% in the previous quarter and significantly lower than the 2.31% reported in Q2 2024.
The deposit trends and composition are illustrated here:
Credit Quality Improvement
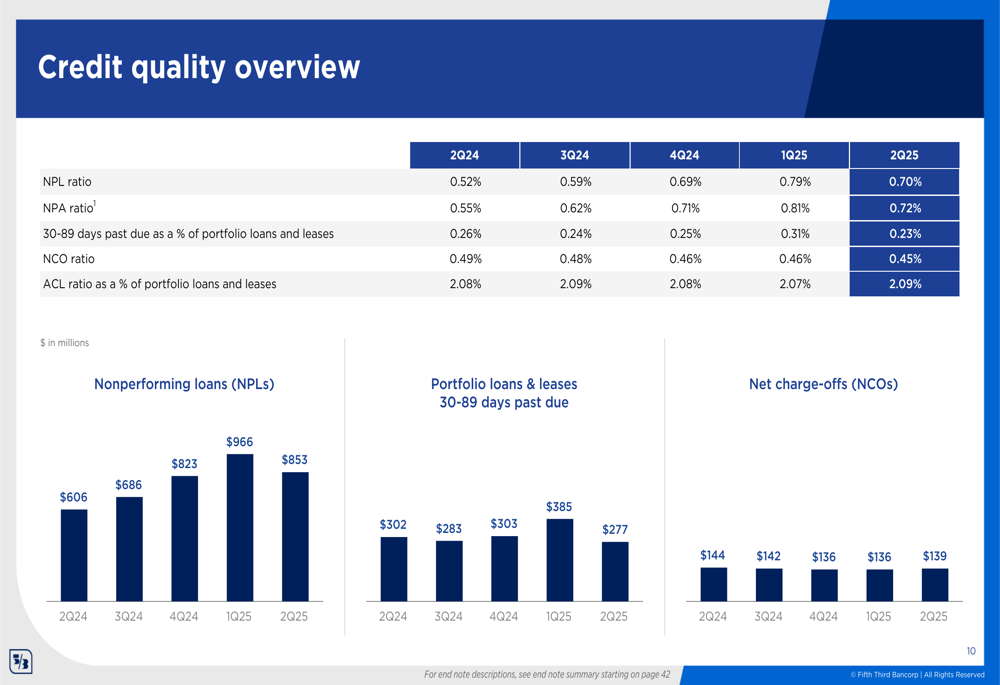
Fifth Third reported strengthening credit quality metrics in Q2 2025, with nonperforming assets (NPAs) down 11% sequentially, led by an 18% decline in commercial NPAs. The nonperforming loan ratio improved to 0.70% from 0.79% in the previous quarter, while the net charge-off ratio remained stable at 0.45%.
The following chart provides a comprehensive overview of credit quality metrics:
Strategic Initiatives
Fifth Third continues to invest in digital banking capabilities, reporting growth in active digital users to 3.17 million in Q2 2025, up from 3.14 million in Q1 2025 and 3.07 million in Q2 2024. The bank highlighted its #1 ranking for banking mobile app user satisfaction among regional banks, with an average app store rating of 4.8 stars compared to the peer average of 4.6 stars.
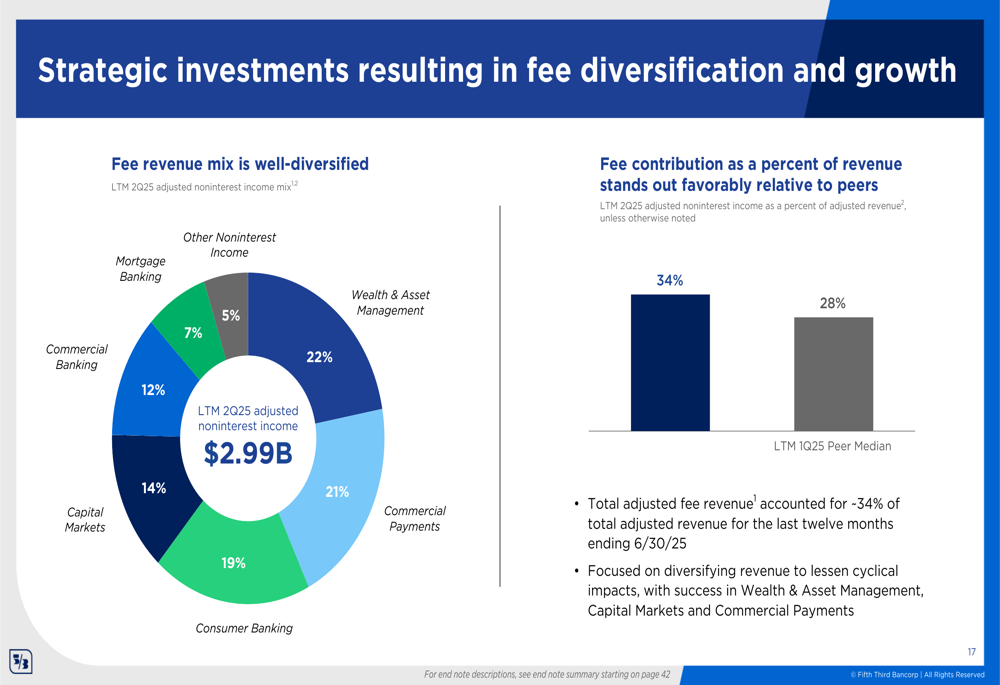
The bank’s fee revenue diversification strategy has positioned it favorably compared to peers, with fee income contributing 34% of total adjusted revenue for the twelve months ending June 30, 2025, compared to the peer median of 28%. This diversification helps mitigate cyclical impacts and provides stability to the bank’s revenue streams.
As illustrated in the following chart, Fifth Third’s fee revenue is well-diversified across multiple business lines:
Forward-Looking Statements
For the full year 2025, Fifth Third expects average loans and leases to increase approximately 5% compared to 2024. Net interest income is projected to grow 5.5-6.5%, assuming a Federal funds rate of 3.75% by year-end. Noninterest income (excluding securities gains/losses) is expected to increase 1-2%, while noninterest expense is projected to rise 2-2.5%.
For the third quarter of 2025, the bank anticipates average loans and leases to be stable to up 1% compared to Q2. Net interest income is expected to increase approximately 1%, while noninterest income is projected to grow 1-4%. Noninterest expense is anticipated to increase by approximately 1%.
The bank’s strong capital position, with a Common Equity Tier 1 (CET1) ratio of 10.56% as of June 30, 2025, provides flexibility for continued investment in strategic growth initiatives while returning capital to shareholders. Fifth Third also maintains robust liquidity with $106 billion in available liquidity sources and a loan-to-core deposit ratio of 76%.
In conclusion, Fifth Third’s Q2 2025 results demonstrate the bank’s ability to generate strong financial performance through disciplined execution of its strategic priorities, even as the interest rate environment begins to normalize. The combination of accelerating net interest income growth, improved efficiency, and strengthening credit quality positions the bank well for continued success in the second half of 2025.
Full presentation:
This article was generated with the support of AI and reviewed by an editor. For more information see our T&C.