Bullish indicating open at $55-$60, IPO prices at $37

First Industrial Realty Trust (NYSE:FR) released its second quarter 2025 supplemental information, revealing continued strong performance with same-store NOI growth of 8.7% while maintaining a solid occupancy rate of 94.2%. The industrial REIT’s presentation highlighted its diversified portfolio across key logistics markets and substantial development pipeline to support future growth.
Quarterly Performance Highlights
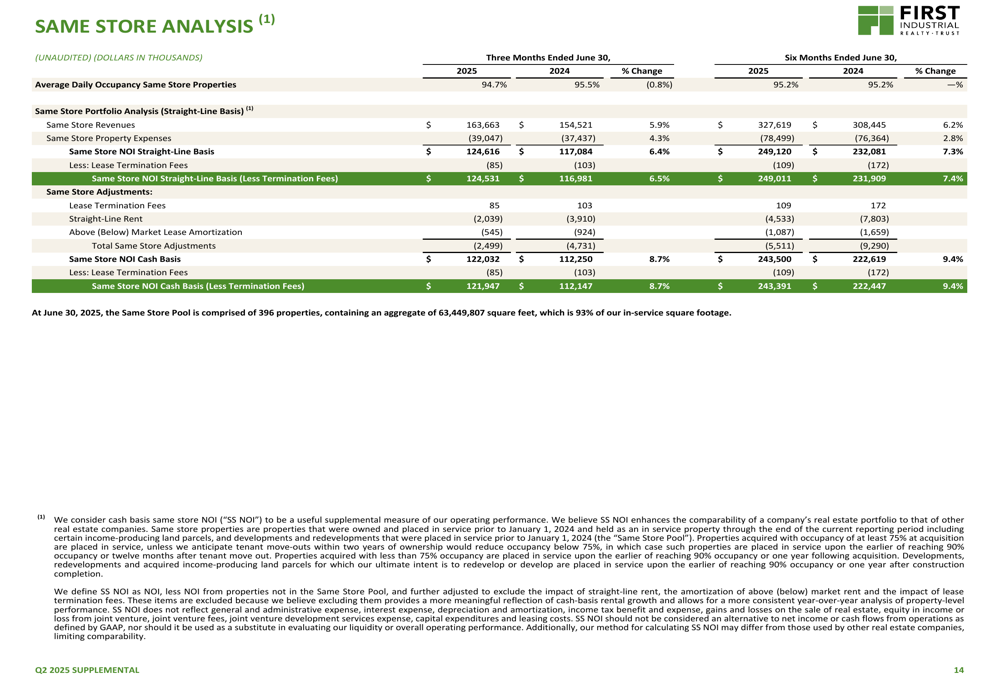
First Industrial reported net income of $56.9 million for the three months ended June 30, 2025. The company’s same-store NOI on a cash basis increased by 8.7% year-over-year for Q2 2025, slightly moderating from the 10.1% growth reported in Q1 but still demonstrating robust performance. For the first half of 2025, same-store NOI growth reached 9.4%.
The REIT maintained a healthy tenant retention rate of 71.0% by square footage during the quarter, in line with its annual target range of 70-75% mentioned in the previous quarter’s earnings call.
As shown in the following chart of same-store NOI growth and key portfolio metrics:
Portfolio and Leasing Activity
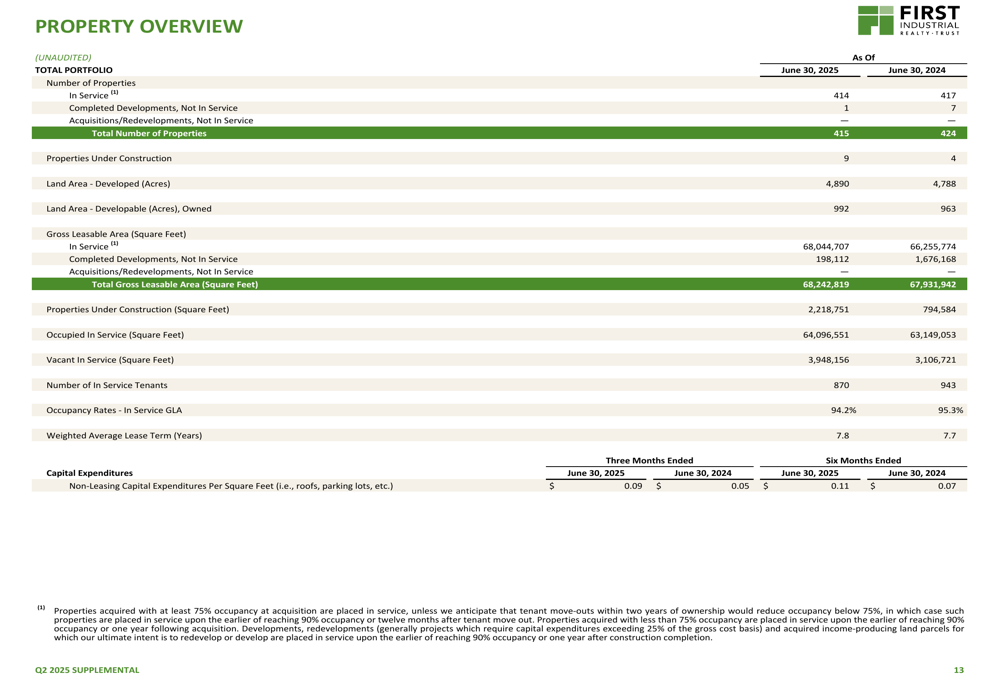
As of June 30, 2025, First Industrial’s portfolio consisted of 414 properties in service with a gross leasable area of 68.2 million square feet. The portfolio maintained a solid occupancy rate of 94.2%, though this represents a decline from the 95.3% reported at the end of Q1 2025. However, this level remains within the company’s projected year-end occupancy range of 95.0-96.0%.
The company’s weighted average lease term stood at 7.8 years, providing good visibility into future cash flows. During Q2 2025, First Industrial executed 45 leases covering 2.5 million square feet with an average term of 6.2 years.
The following image provides a comprehensive overview of the company’s property portfolio:
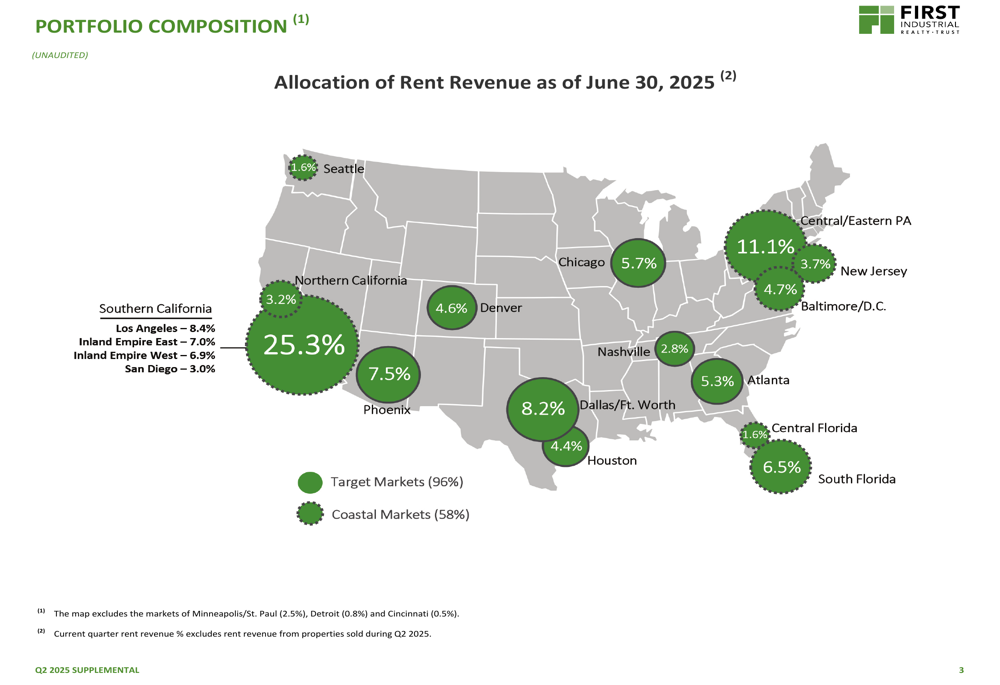
First Industrial maintains a geographically diversified portfolio, with Southern California representing its largest market at 25.3% of rent revenue. Other significant markets include Central/Eastern Pennsylvania (11.1%), Dallas/Fort Worth (8.2%), and Phoenix (7.5%). Coastal markets account for 58% of the company’s rent revenue.
The geographic distribution of rent revenue is illustrated in this map:
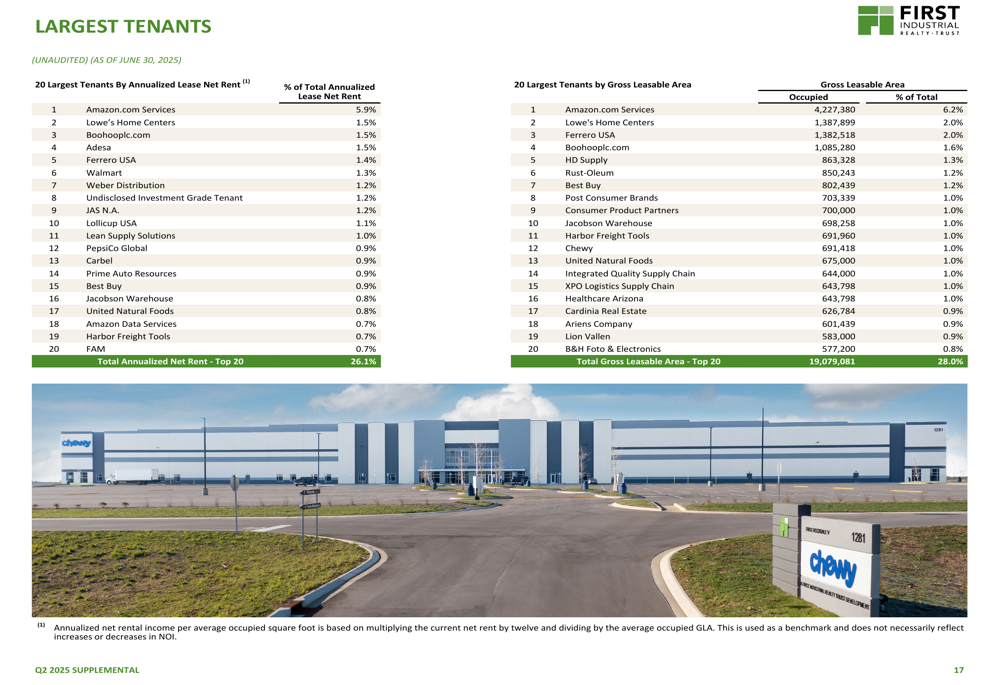
The company’s tenant base is well-diversified, with Amazon.com (NASDAQ:AMZN) Services as its largest tenant representing 5.9% of annualized lease net rent and 6.2% of gross leasable area. This diversification helps mitigate tenant concentration risk.
The following chart details First Industrial’s largest tenants:
Development Pipeline and Growth Strategy
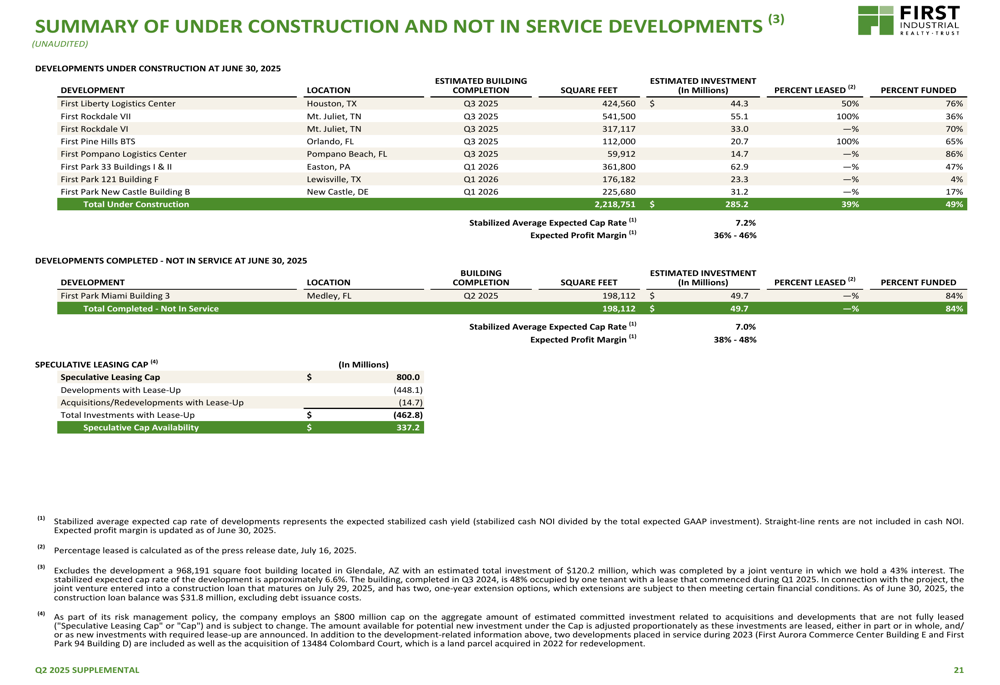
First Industrial continues to execute its development strategy with 9 properties under construction as of Q2 2025. Notable projects include First Liberty Logistics Center in Houston, which is 424,560 square feet, 50% leased, and 76% funded with an estimated investment of $44.3 million.
The company’s development pipeline is detailed in the following chart:
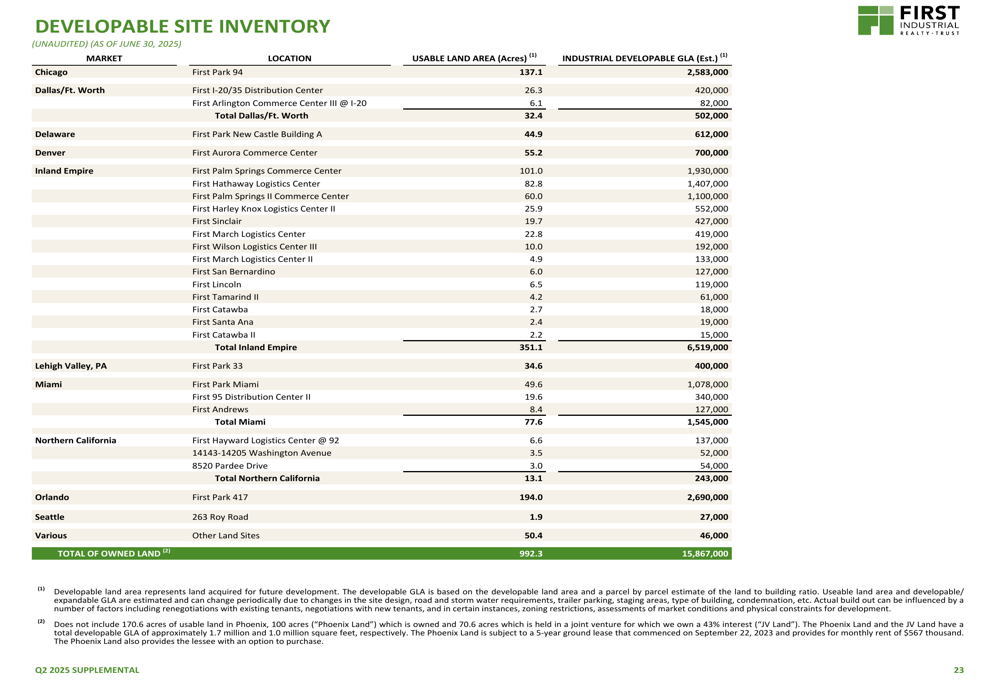
A key strength of First Industrial’s growth strategy is its substantial land bank, which positions the company for future development opportunities. As of June 30, 2025, the company owned 992.3 acres of developable land with potential for approximately 15.9 million square feet of industrial space. The largest land holdings are in the Inland Empire (351.1 acres), Orlando (194.0 acres), and Chicago (137.1 acres).
The company’s developable site inventory is illustrated here:
First Industrial’s acquisition activity was modest in Q2 2025, with no new property acquisitions during the quarter. This contrasts with Q1 2025, when the company acquired Camelback 303 Buildings A & B in Phoenix for $120 million, totaling 796,196 square feet with an expected cap rate of 6.4%.
Financial Position and Outlook
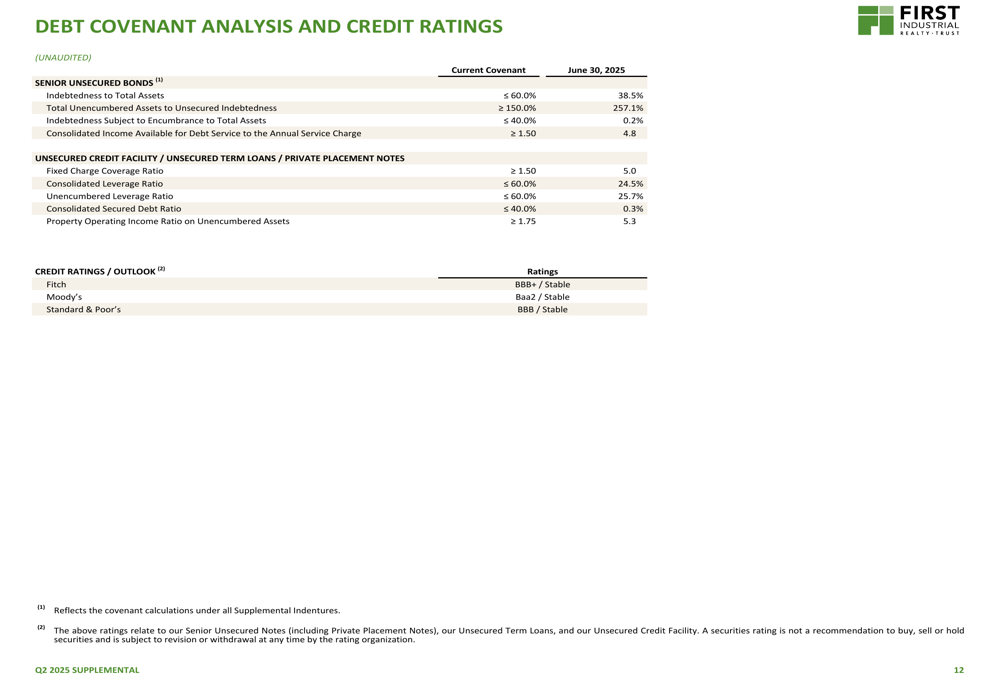
First Industrial maintains a strong financial position with a total weighted average interest rate of 4.10% as of June 30, 2025. The company’s net debt to adjusted EBITDA ratio stands at 4.7x, indicating a manageable leverage profile. Credit ratings remain stable with Fitch (BBB+/Stable), Moody’s (Baa2/Stable), and Standard & Poor’s (BBB/Stable).
The company’s debt covenant compliance and credit ratings are summarized in the following table:
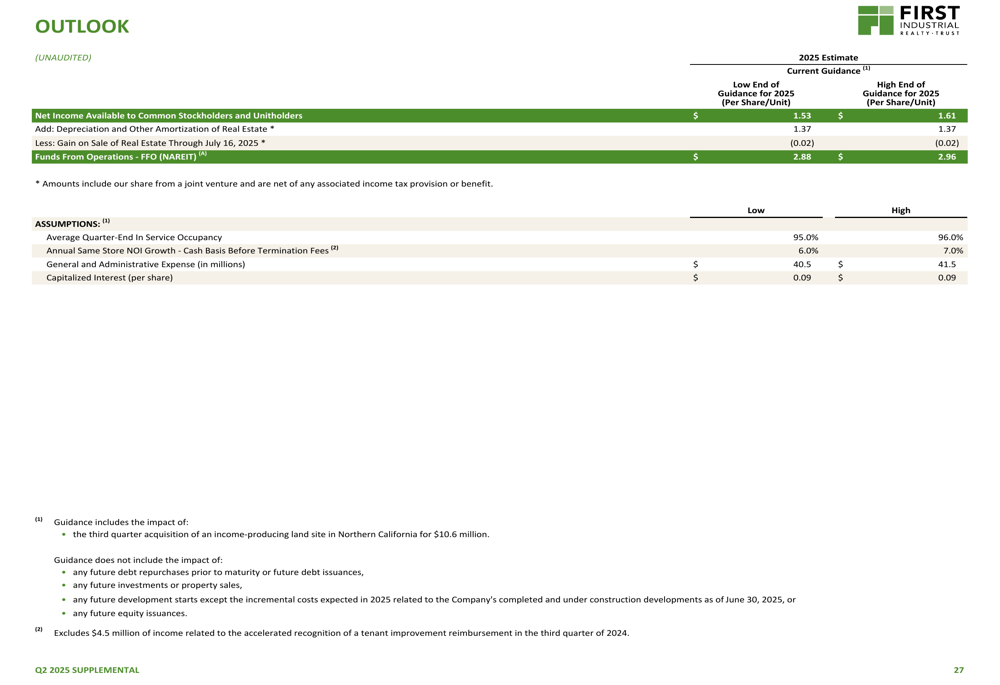
For 2025, First Industrial projects net income available to common stockholders and unitholders of $1.53-$1.61 per share/unit and funds from operations (FFO) of $2.88-$2.96 per share/unit. The company expects average year-end occupancy of 95.0-96.0% and annual same-store NOI growth of 6.0-7.0%.
The company’s full-year guidance is detailed in this outlook:
First Industrial’s stock closed at $49.31 on July 16, 2025, up 0.53% for the day. The stock has traded between $40.31 and $58.17 over the past 52 weeks, according to the latest market data.
With its strong same-store NOI growth, substantial development pipeline, and significant land bank for future growth, First Industrial appears well-positioned to capitalize on continued demand for industrial real estate despite a slight moderation in occupancy rates.
Full presentation:
This article was generated with the support of AI and reviewed by an editor. For more information see our T&C.