Goldman Sachs expects Nvidia ’beat and raise,’ lifts price target to $240

Introduction & Market Context
Flex Ltd (NASDAQ:FLEX) released its Q1 FY26 earnings presentation on July 24, 2025, revealing strong financial performance with significant margin expansion and earnings growth. Despite reporting robust results, Flex’s stock fell 6.58% in premarket trading to $50.26, suggesting investors may have been expecting even stronger guidance or were concerned about specific segments.
The global manufacturing solutions provider highlighted its continued operational efficiency improvements and strong position in the growing data center market, while achieving its adjusted operating margin target a full year ahead of schedule.
Quarterly Performance Highlights
Flex reported Q1 FY26 revenue of $6.6 billion, with adjusted operating income reaching $395 million. The company achieved an adjusted operating margin of 6.0%, representing a substantial 120 basis point improvement year-over-year. Adjusted net income came in at $274 million, with adjusted earnings per share of $0.72, marking a 40% increase compared to the same period last year.
As shown in the following executive summary slide, Flex achieved record Q1 performance in both adjusted operating margin and adjusted EPS:
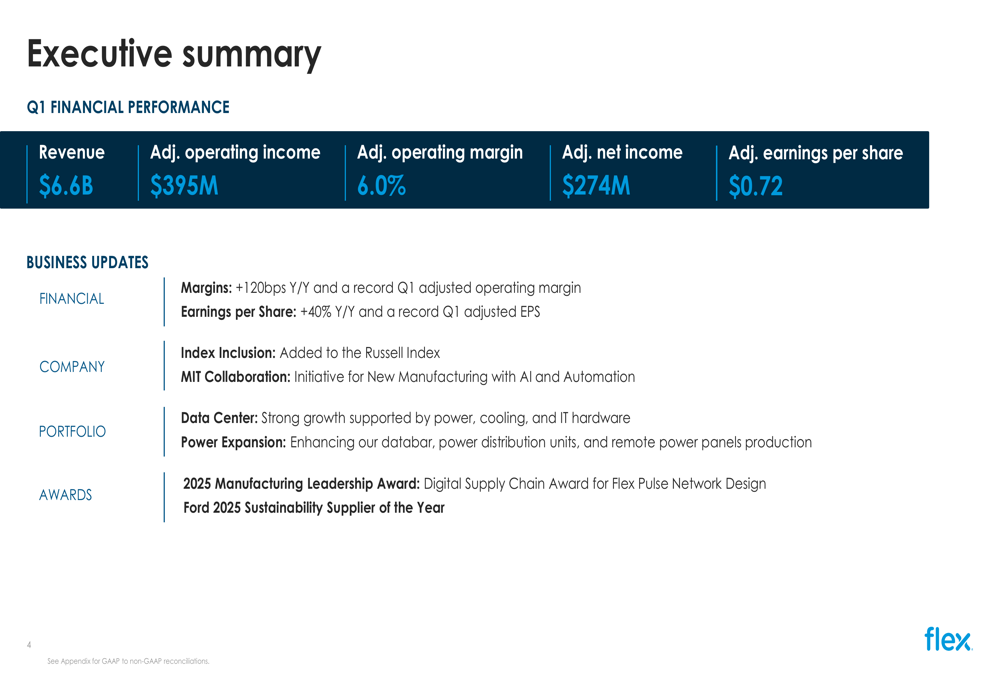
The company’s strong execution in a dynamic environment was further validated by its inclusion in the Russell Index and recognition through the 2025 Manufacturing Leadership and Ford Sustainability Supplier awards. Flex also highlighted its collaboration with MIT as a strategic initiative to drive innovation.
Segment Performance
Flex’s business is divided into two main segments: Reliability Solutions (Industrial, Automotive, and Health Solutions) and Agility Solutions (CEC, Lifestyle, and Consumer Devices). The Agility segment significantly outperformed Reliability in Q1, as illustrated in the following breakdown:
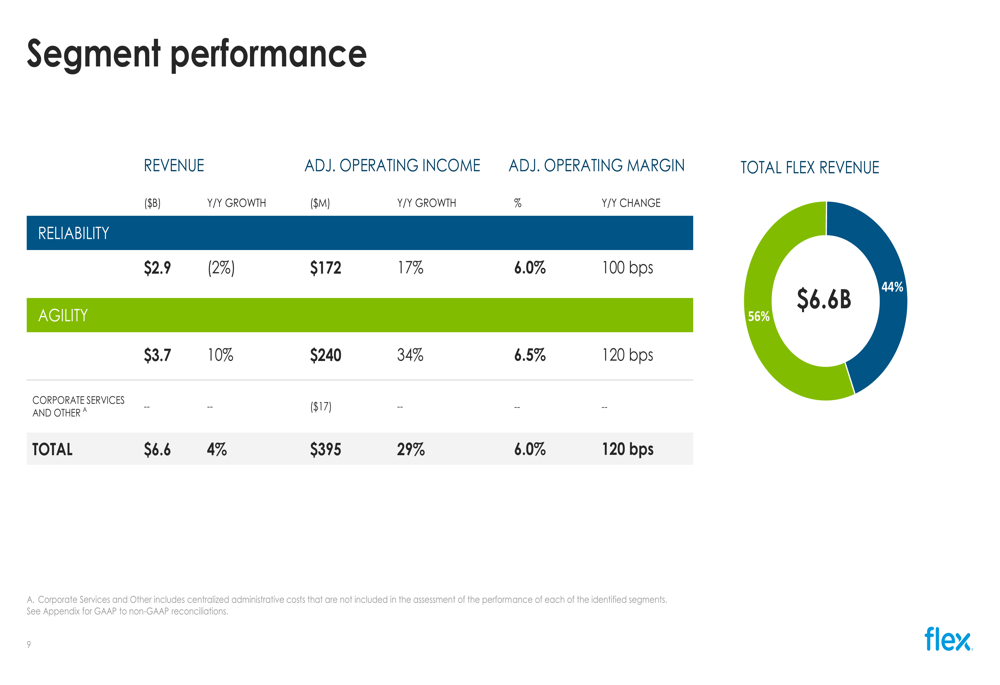
The Agility Solutions segment, representing 56% of total revenue, grew 10% year-over-year to $3.7 billion, with adjusted operating income increasing 34% to $240 million. This segment achieved an impressive 6.5% adjusted operating margin, up 120 basis points from the previous year.
In contrast, the Reliability Solutions segment, accounting for 44% of revenue, experienced a 2% year-over-year decline to $2.9 billion. However, its adjusted operating income still grew 17% to $172 million, with margins expanding 100 basis points to 6.0%.
Strategic Initiatives
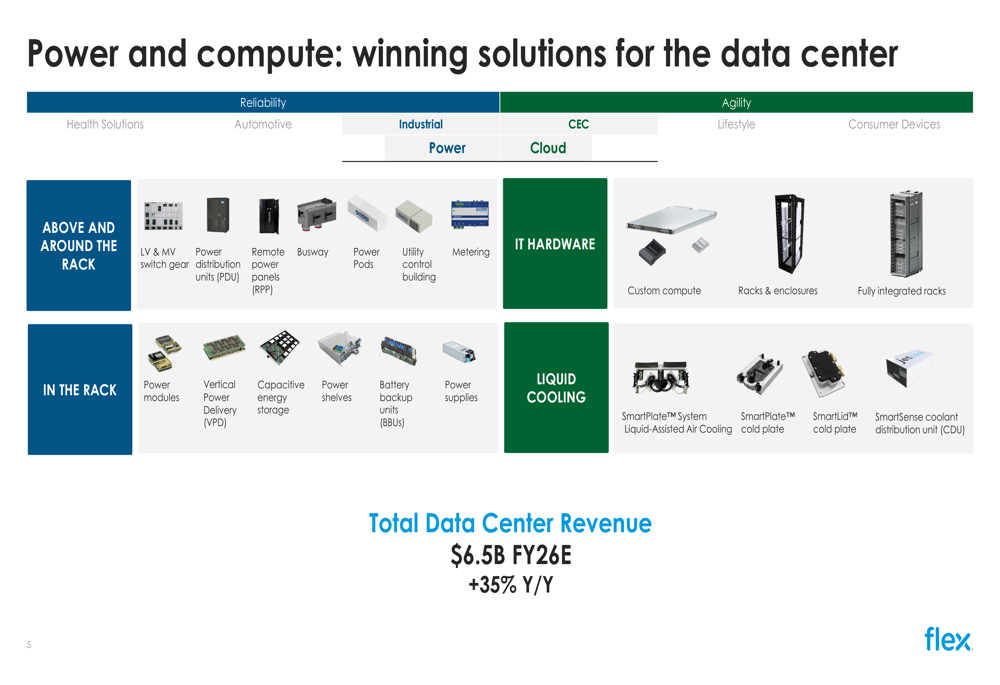
A key growth driver for Flex continues to be its expanding presence in the data center market, where the company expects FY26 revenue of $6.5 billion, representing 35% year-over-year growth. Flex emphasized its comprehensive portfolio of solutions spanning power, compute, and cooling technologies.
The following slide illustrates Flex’s extensive data center offerings:
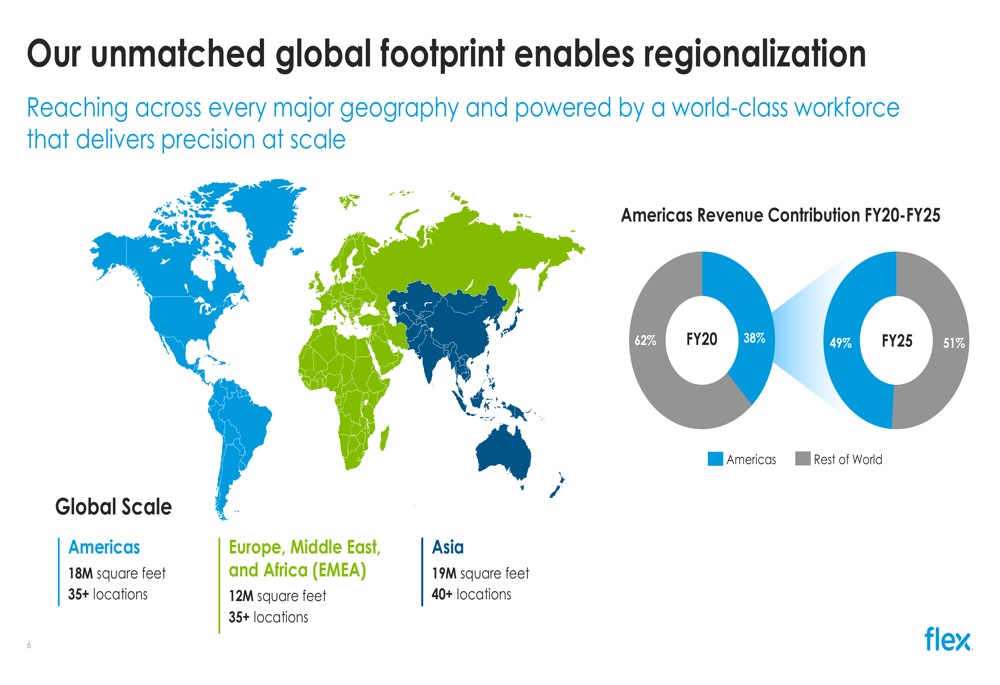
Flex’s global footprint remains a strategic advantage, with the company operating across the Americas (18M square feet, 35+ locations), Europe, Middle East, and Africa (12M square feet, 35+ locations), and Asia (19M square feet, 40+ locations). This extensive network enables Flex to serve customers regionally, an increasingly important capability given ongoing supply chain challenges and geopolitical tensions.
The company’s regionalization strategy is visualized in this global footprint slide:
Detailed Financial Analysis
Flex’s financial performance showed strength across multiple metrics. The company’s Q1 FY26 results demonstrated significant improvement compared to Q1 FY25, as detailed in the following financial comparison:
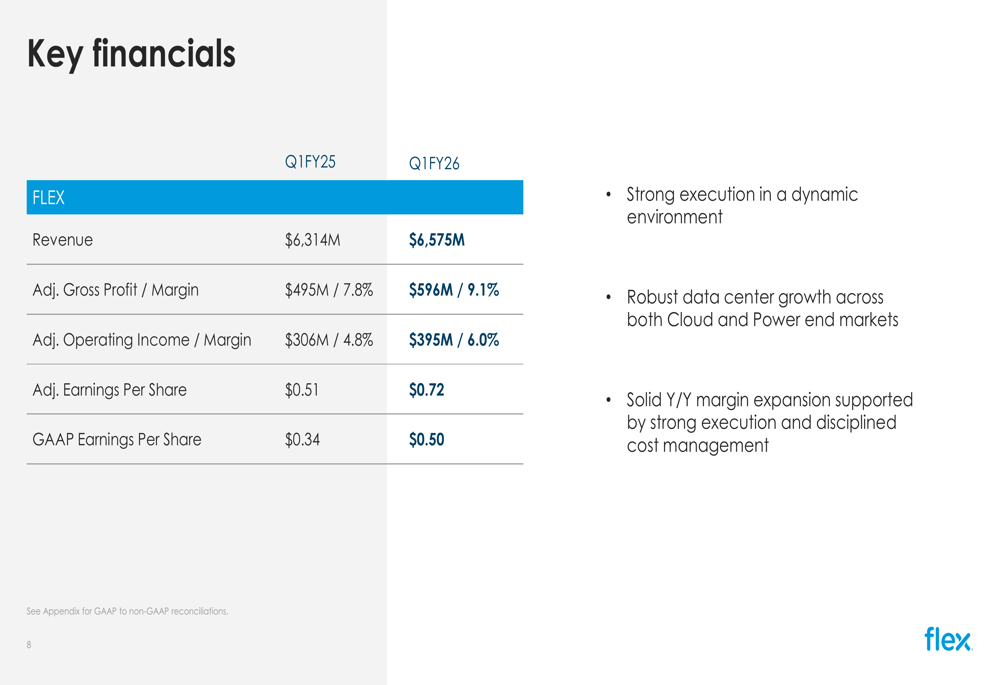
Adjusted gross profit increased to $596 million (9.1% margin) from $495 million (7.8% margin) a year earlier. Adjusted operating income rose to $395 million (6.0% margin) from $306 million (4.8% margin).
The company generated $399 million in operating cash flow and $268 million in adjusted free cash flow during the quarter, while returning capital to shareholders through $247 million in share repurchases.
Forward-Looking Statements
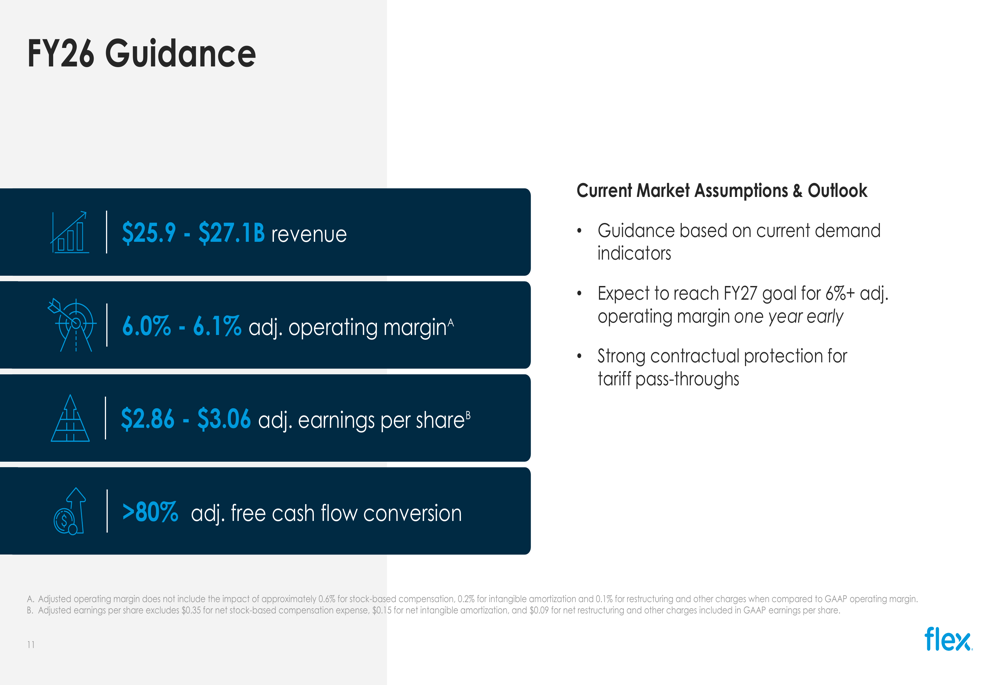
For the full fiscal year 2026, Flex provided guidance of $25.9-$27.1 billion in revenue, with adjusted operating margin expected to be 6.0%-6.1% and adjusted EPS projected at $2.86-$3.06. The company also expects greater than 80% adjusted free cash flow conversion.
The FY26 guidance is presented in the following slide:
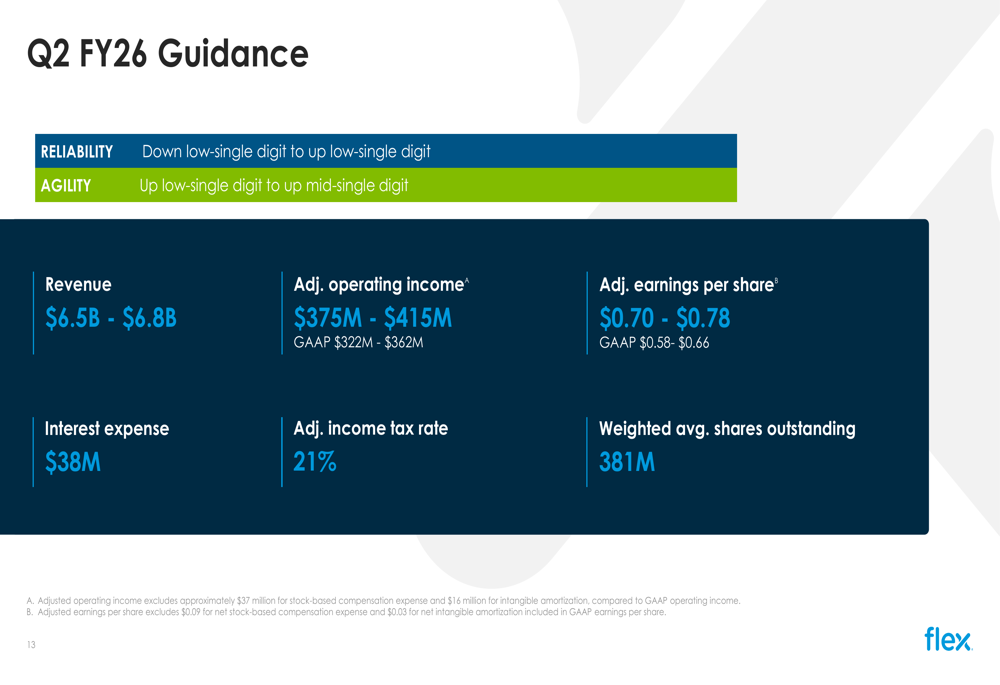
For Q2 FY26, Flex expects revenue of $6.5-$6.8 billion, adjusted operating income of $375-$415 million, and adjusted EPS of $0.70-$0.78.
Notably, Flex highlighted that it expects to reach its FY27 goal of 6%+ adjusted operating margin one year early, demonstrating the company’s operational efficiency improvements. Management also emphasized strong contractual protection for tariff pass-throughs, addressing potential investor concerns about trade tensions.
The stock’s negative premarket reaction despite strong results suggests investors may be focusing on the relatively modest revenue growth outlook or specific segment challenges. While Flex continues to execute well on margins and profitability, the market appears to have expected more aggressive growth targets, particularly given the company’s strong position in the rapidly expanding data center market.
Full presentation:
This article was generated with the support of AI and reviewed by an editor. For more information see our T&C.