How are energy investors positioned?

Flushing Financial Corporation (NASDAQ:FFIC) presented its first quarter 2025 earnings results on April 30, showing signs of recovery following a difficult fourth quarter. The company highlighted net interest margin expansion, improved deposit growth, and continued conservative credit quality management as key achievements during the period.
Introduction & Market Context
Flushing Financial’s Q1 2025 presentation comes after a challenging Q4 2024, when the company reported a GAAP loss per share of $1.61 and core earnings per share of $0.14, missing analyst forecasts. The stock has been under pressure, trading at $12.45 as of April 29, 2025, well below its 52-week high of $18.59.
The first quarter showed some encouraging signs of improvement, with the company focusing on expanding its net interest margin and maintaining strong liquidity and capital positions while navigating a shifting operating environment.
Quarterly Performance Highlights
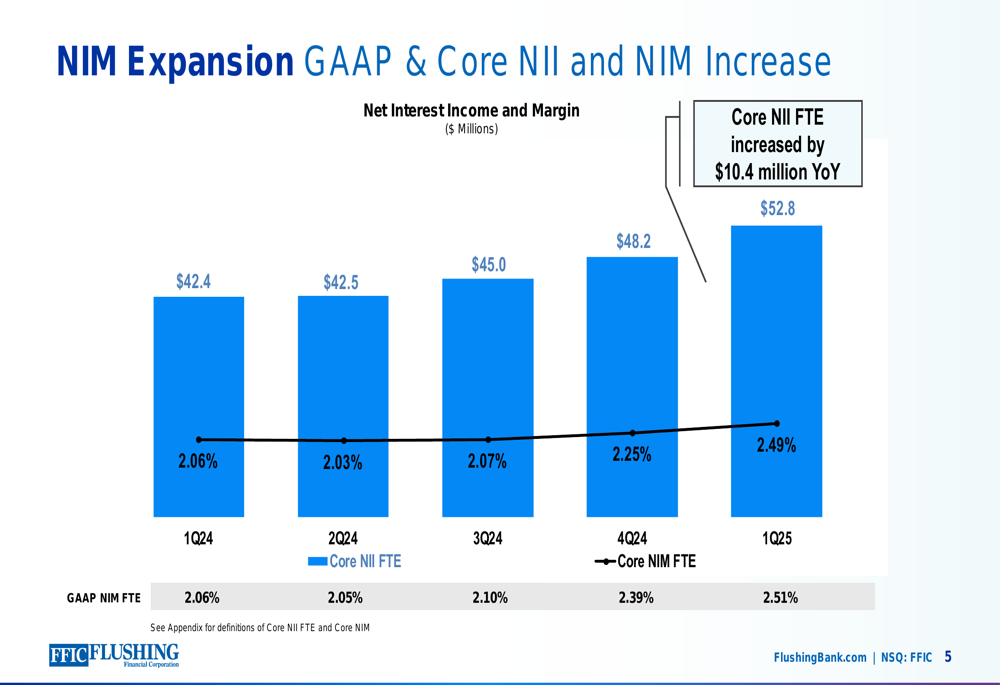
Flushing Financial reported significant improvement in its net interest margin (NIM), with GAAP NIM increasing 12 basis points quarter-over-quarter to 2.51% and core NIM expanding 24 basis points to 2.49%. This expansion follows the trend started in Q4 2024 and represents a key metric in the company’s recovery strategy.
As shown in the following chart of quarterly net interest income and margin growth:
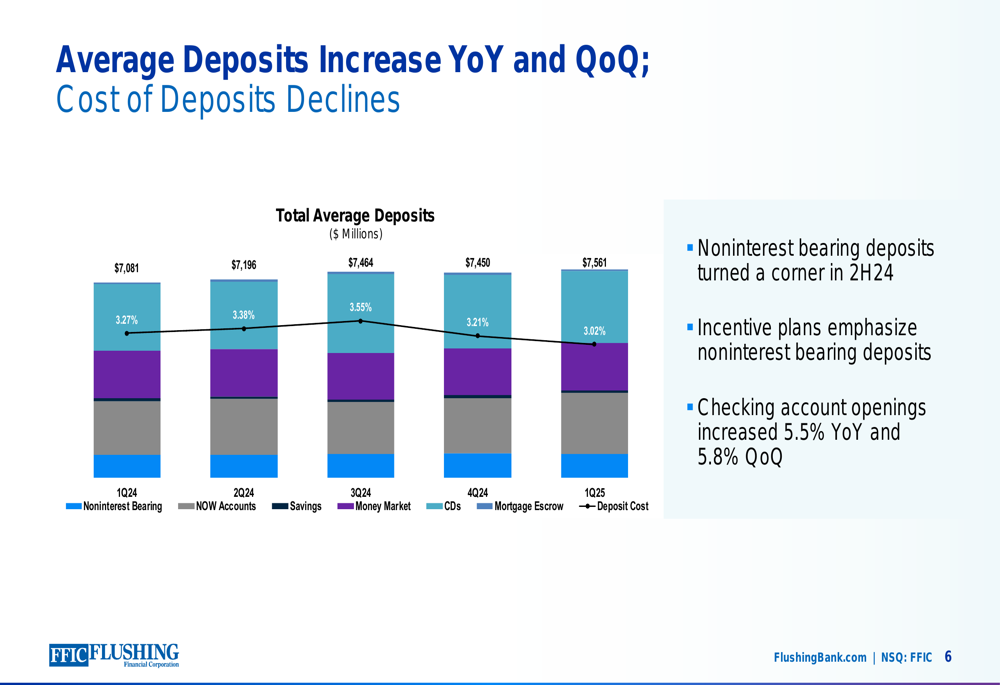
The company’s deposit strategy also showed positive results, with average total deposits increasing 6.8% year-over-year and 1.5% quarter-over-quarter to $7.6 billion. This growth helped improve the loan-to-deposit ratio to 87.2% in Q1 2025, compared to 94.0% a year ago and 93.9% in the prior quarter.
The following chart illustrates this deposit growth trend:
However, the quarter was not without challenges. The company recorded a non-cash goodwill impairment of $17.6 million or $0.51 per share, though this had no impact on regulatory capital. The tangible common equity ratio remained stable quarter-over-quarter at 7.79%.
Credit Quality & Risk Management
Flushing Financial maintained its conservative approach to credit risk, though some metrics showed slight deterioration. Non-performing assets to total assets increased to 71 basis points in Q1 2025 compared to 53 basis points a year ago and 57 basis points in the previous quarter. Net charge-offs totaled 18 basis points for the past twelve months.
The company emphasized its historically strong credit quality, with the following breakdown of allowance for credit losses by loan segment:
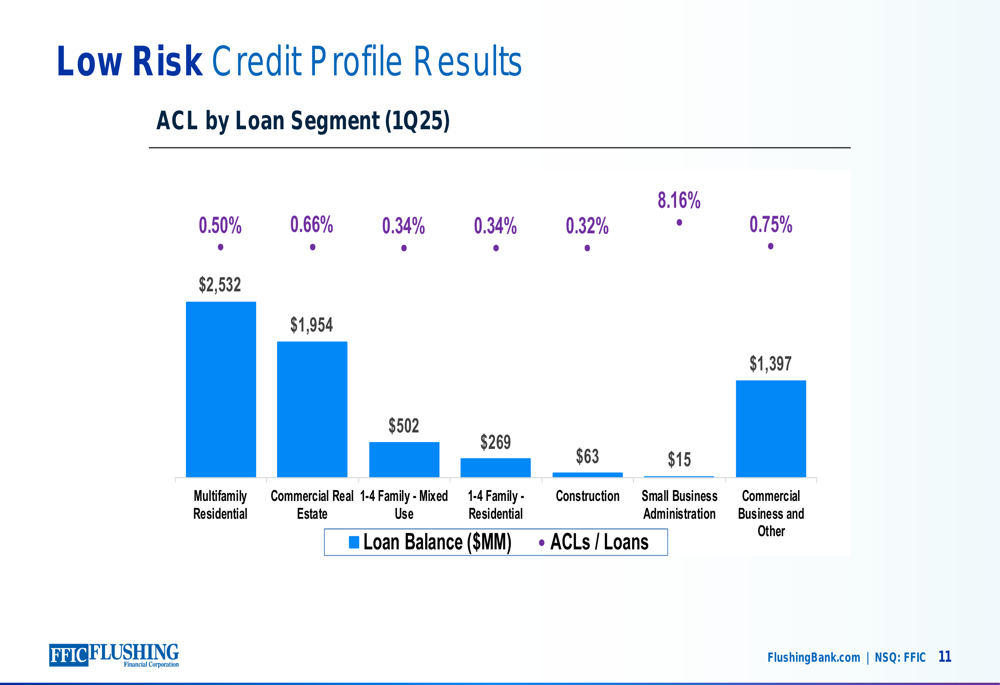
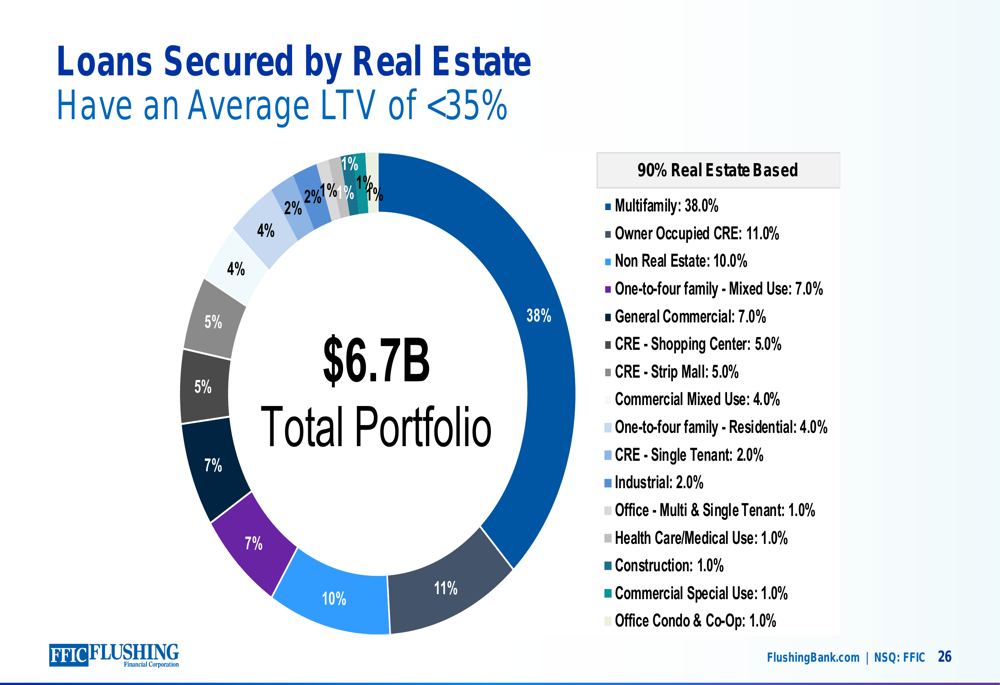
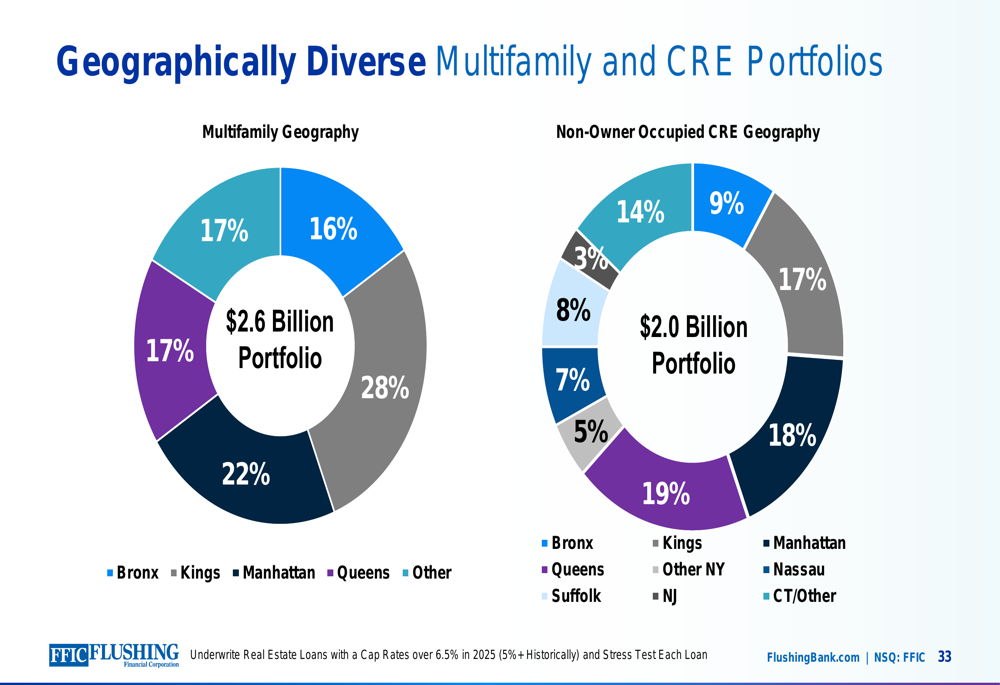
Approximately 90% of the loan portfolio is collateralized by real estate with an average loan-to-value ratio of less than 35%, providing significant protection against potential losses. The multifamily and investor commercial real estate portfolios maintain strong debt coverage ratios of approximately 1.82x.
The company’s loan portfolio remains well-diversified across property types, as illustrated in this breakdown:
Strategic Initiatives
Flushing Financial continues to focus on the Asian banking market as a key growth area. The company reported $737.8 million in loans and $1.3 billion in deposits from Asian communities, representing approximately 3% market share of a $40 billion market opportunity.
The company’s geographic diversification strategy is illustrated in the following chart showing the distribution of multifamily and commercial real estate portfolios:
Digital banking adoption continues to increase, with a 7% year-over-year growth in monthly mobile deposit active users as of March 2025 and a 15% increase in digital banking enrollment. The company processed approximately 15,100 Zelle transactions, totaling about $5.5 million in March 2025.
Forward-Looking Statements
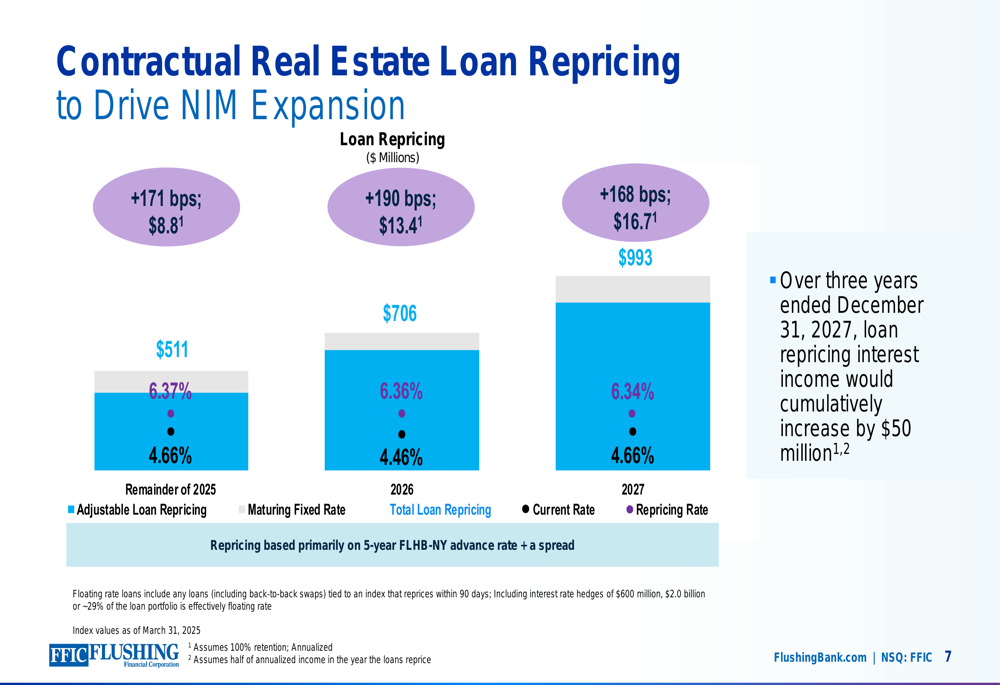
A significant opportunity for future profitability lies in the contractual repricing of real estate loans, which are expected to reprice approximately 175 basis points higher through 2027. This repricing schedule is detailed in the following chart:
Additionally, $602 million of retail CDs at a weighted average rate of 4.16% are set to mature in the second quarter of 2025, providing an opportunity to reduce funding costs. March 2025 CD retention rates were 3.94%.
For the remainder of 2025, Flushing Financial expects:
- Stable total assets with loan growth dependent on market conditions
- Core noninterest expense to increase 5-8% from the 2024 base of $159.6 million
- Effective tax rate of 25-28%
- Continued focus on improving return on average equity over time
Key Takeaways
The presentation emphasized three main areas of focus: improving profitability, maintaining credit discipline, and preserving strong liquidity and capital. These priorities are summarized in the following overview:
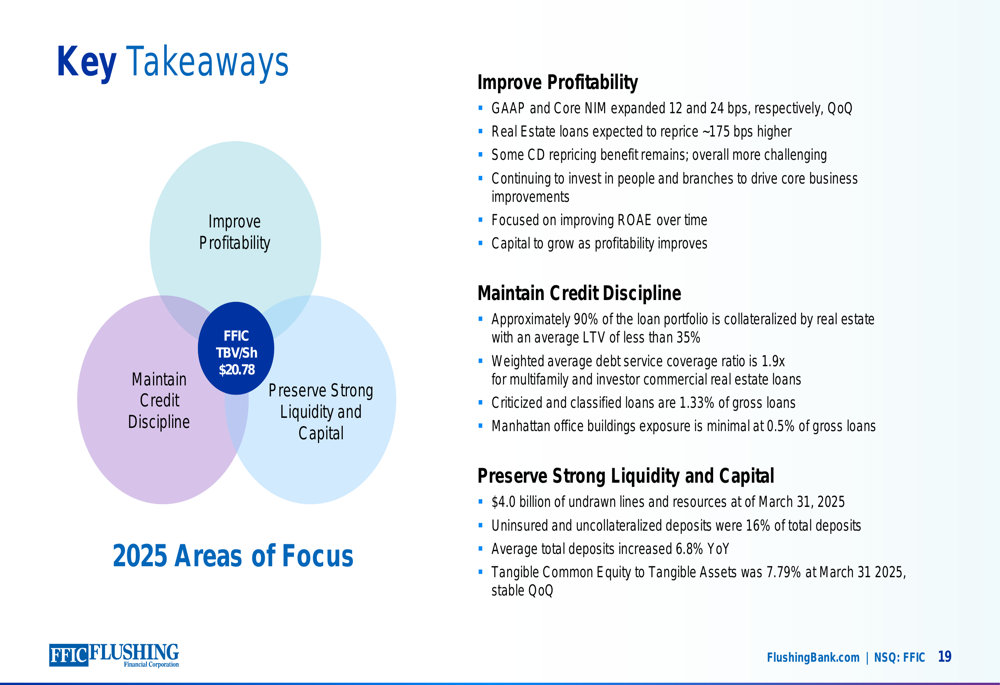
Despite the challenges faced in Q4 2024 and the non-cash goodwill impairment in Q1 2025, Flushing Financial appears to be making progress on its recovery path through NIM expansion, deposit growth, and strategic focus on its core markets. The company’s conservative credit approach and significant loan repricing opportunities provide potential catalysts for improved performance in coming quarters, though investors will likely remain cautious until a more consistent trend of improvement emerges.
Full presentation:
This article was generated with the support of AI and reviewed by an editor. For more information see our T&C.