Bets on October rate-cut overblown as Fed a ’reluctant dove,’ Macquarie warns

Introduction & Market Context
FrontView REIT Inc. (NYSE:FVR), an internally-managed net-lease REIT focused on high-visibility frontage properties, released its Q2 2025 investor presentation on August 14, 2025. The company’s shares jumped 7.72% in premarket trading to $13.26, following a closing price of $12.31 on August 13. Despite this positive reaction, FVR stock has declined 34.2% over the past six months, trading well below analyst price targets of $15-$20.
The presentation comes as FrontView, which completed its IPO in October 2024, continues to establish its market position with a differentiated strategy focused on properties with premium visibility along highly-trafficked roads.
Quarterly Performance Highlights
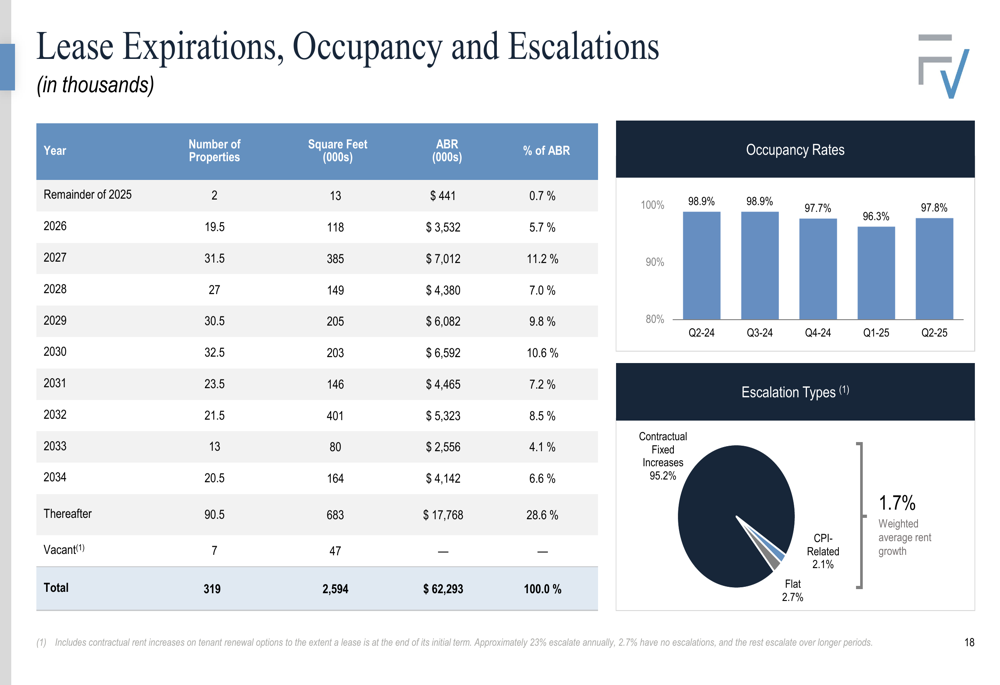
FrontView reported mixed Q2 2025 results, with improved operational metrics but a wider net loss. The company achieved AFFO per share of $0.32, up from $0.30 in Q1 2025, while occupancy improved to 97.8% from 96% in the previous quarter. However, net loss per share worsened to $(0.16) from $(0.06) in Q1.
As shown in the following comprehensive overview of key Q2 metrics:
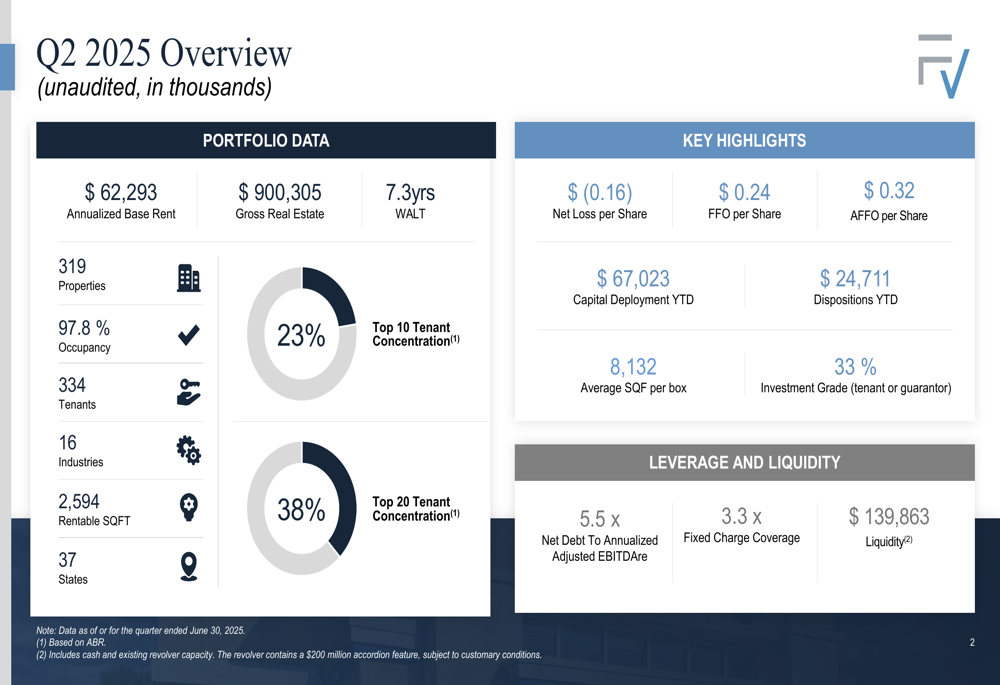
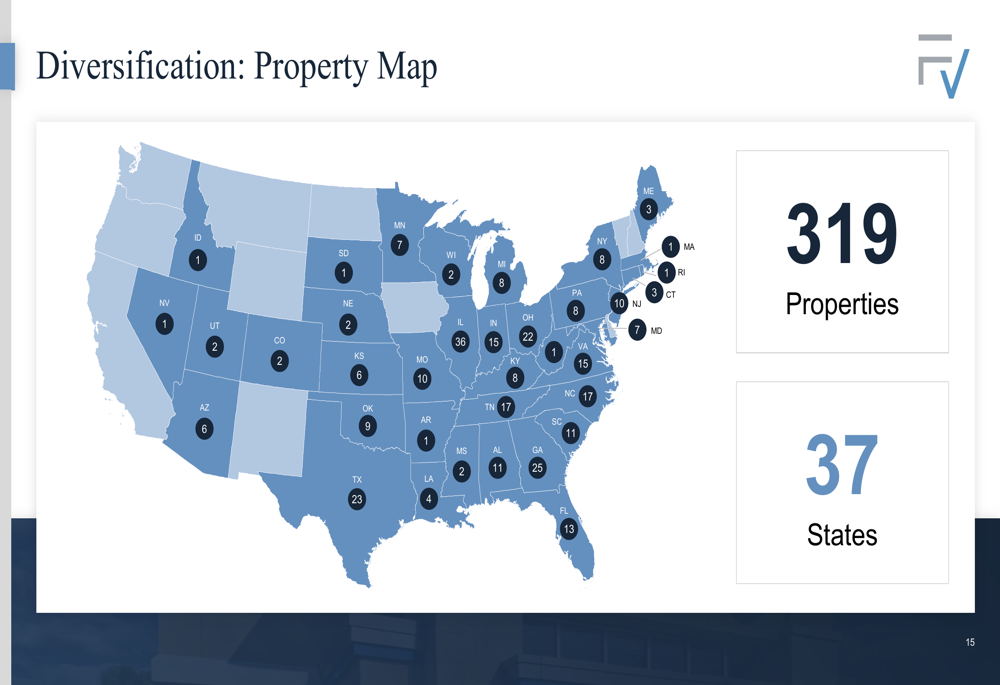
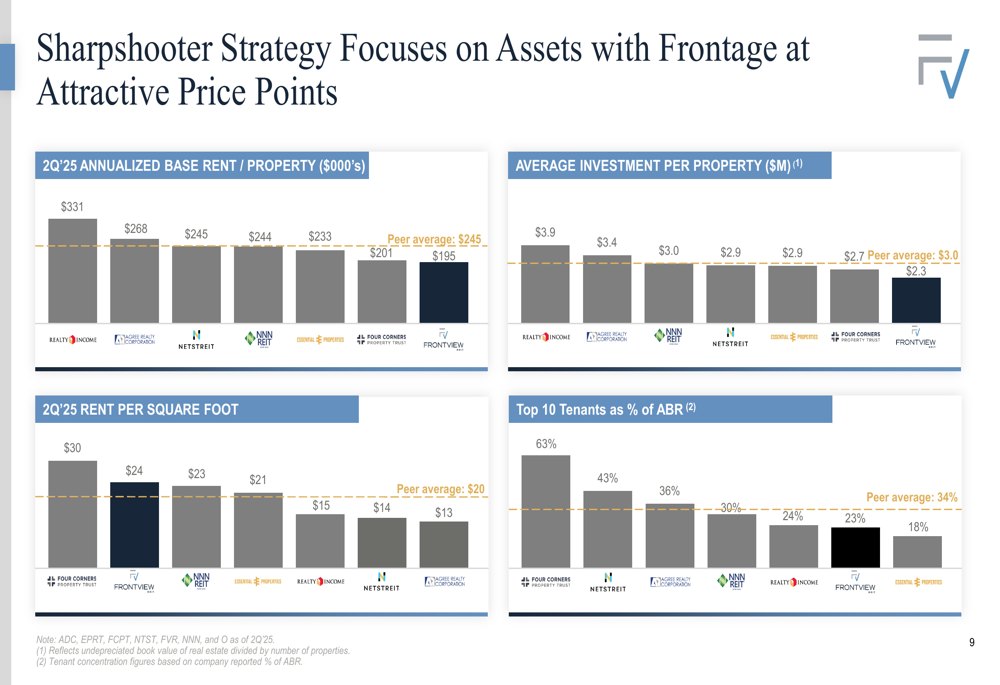
The REIT’s portfolio as of Q2 2025 comprised 319 properties across 37 states, with a diverse tenant base of 334 tenants across 16 industries. The weighted average lease term (WALT) stands at 7.3 years, with top 10 tenant concentration at just 23% of annualized base rent (ABR), significantly better than the peer average of 34%.
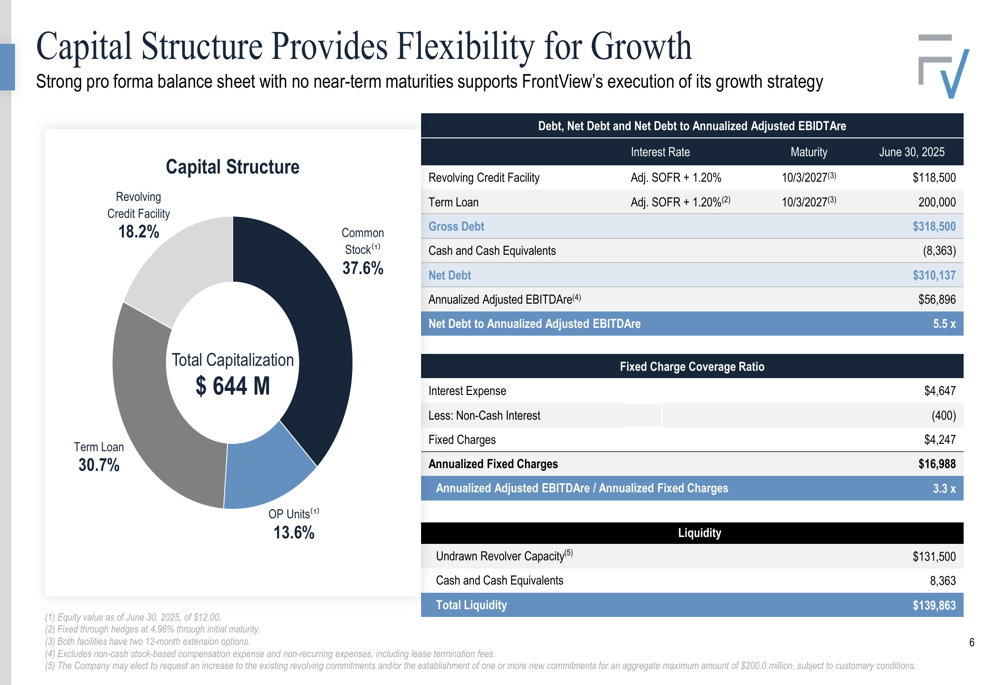
FrontView’s leverage metrics showed improvement, with net debt to annualized adjusted EBITDAre at 5.5x, down from 5.7x in Q1, while maintaining a strong fixed charge coverage ratio of 3.3x. The company reported substantial liquidity of $139.9 million, including cash and existing revolver capacity.
Strategic Positioning
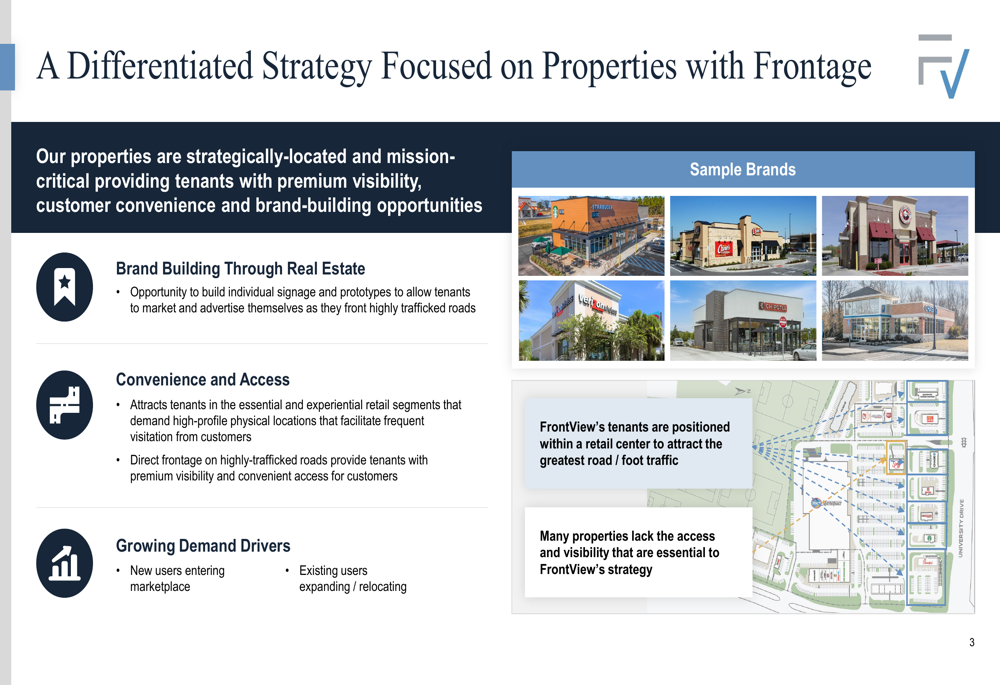
FrontView’s differentiated strategy focuses on acquiring properties with frontage along highly-trafficked roads, providing tenants with premium visibility and brand-building opportunities. This approach targets properties that serve as strategic marketing assets for tenants.
The following illustration highlights the company’s frontage-focused strategy:
The company’s evolution from a private REIT to its NYSE listing in October 2024 has been marked by consistent portfolio growth, reaching approximately $900 million in gross real estate assets by Q2 2025. Recent milestones include simplifying its capital structure and fixing a $200 million term loan at an all-in rate of 4.96%.
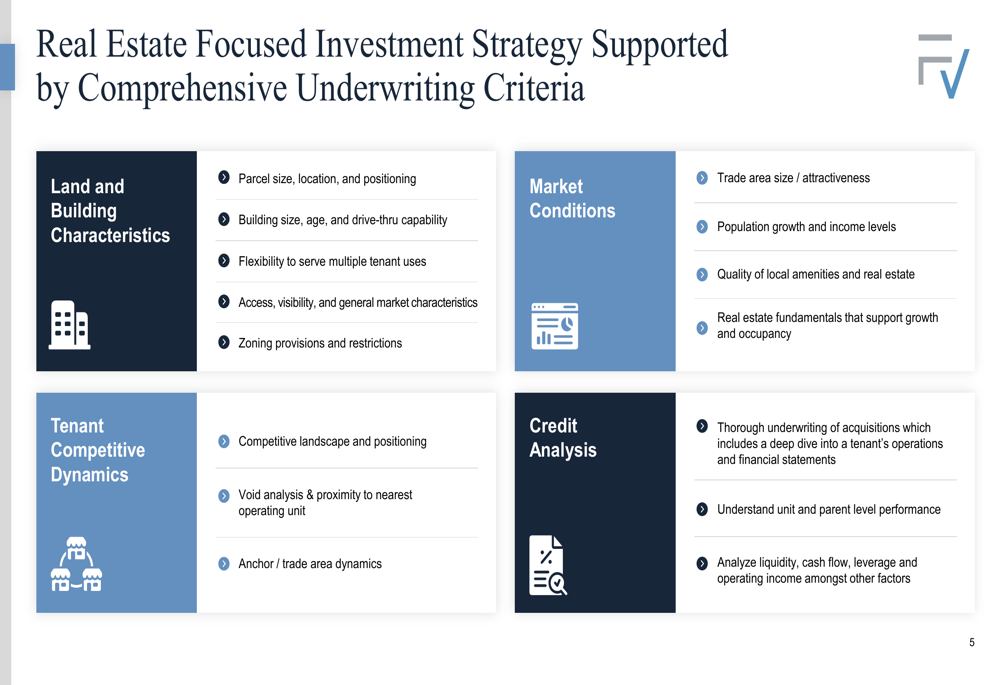
FrontView’s investment strategy is supported by comprehensive underwriting criteria covering land characteristics, market conditions, tenant dynamics, and credit analysis:
Portfolio Analysis
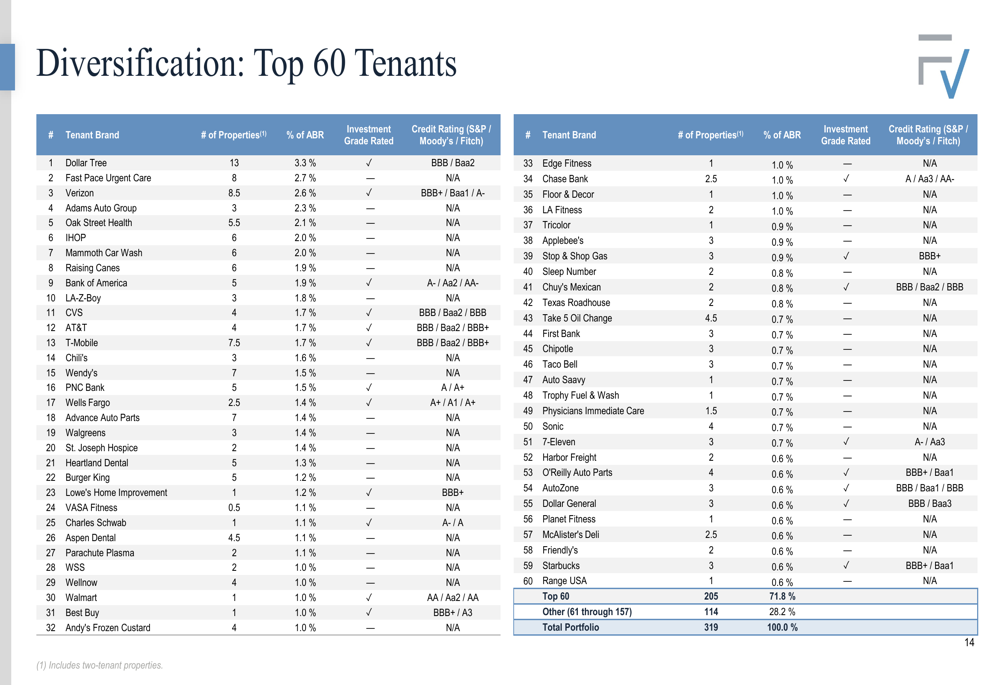
The REIT’s portfolio demonstrates strong diversification across tenants, industries, and geography. Dollar Tree represents the largest tenant at just 3.3% of ABR, with no single tenant accounting for more than 4% of the portfolio.
The following detailed breakdown shows FrontView’s top tenants:
Geographically, the portfolio spans 37 states, with Illinois representing the largest concentration at 13.9% of ABR:
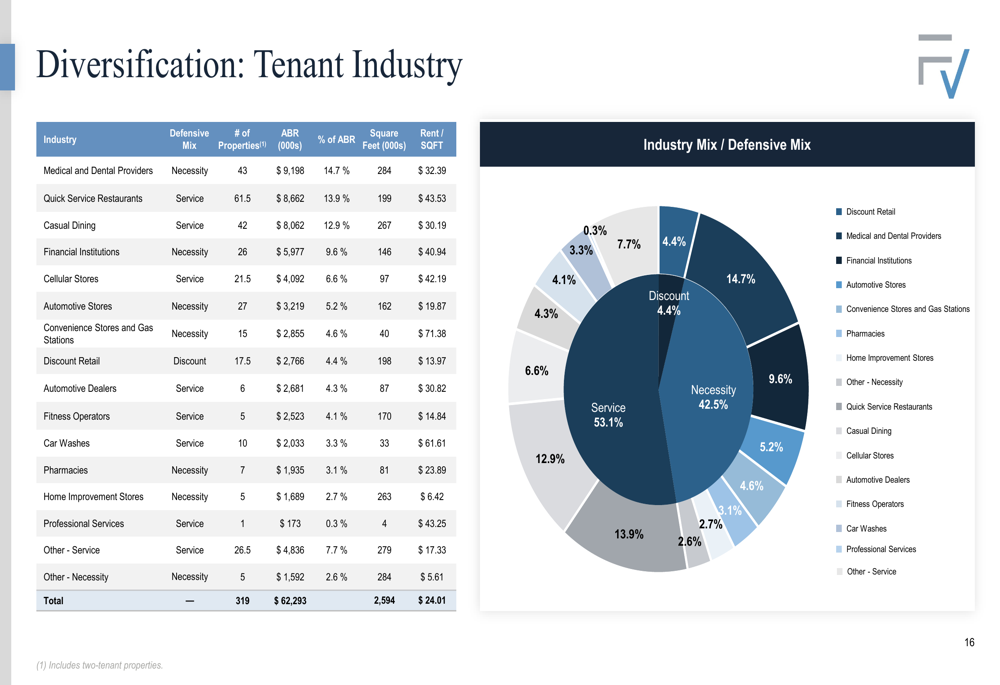
Industry diversification is another strength, with medical and dental providers (14.7%), quick service restaurants (13.9%), and casual dining (12.9%) representing the largest segments:
The portfolio benefits from strong lease structures, with 95.2% featuring contractual fixed increases. The staggered lease expiration schedule provides stability, with no single year representing more than 12% of ABR expiring:
Capital Allocation & Growth Strategy
FrontView’s capital structure supports its growth strategy, with no near-term debt maturities and a balanced approach to leverage:
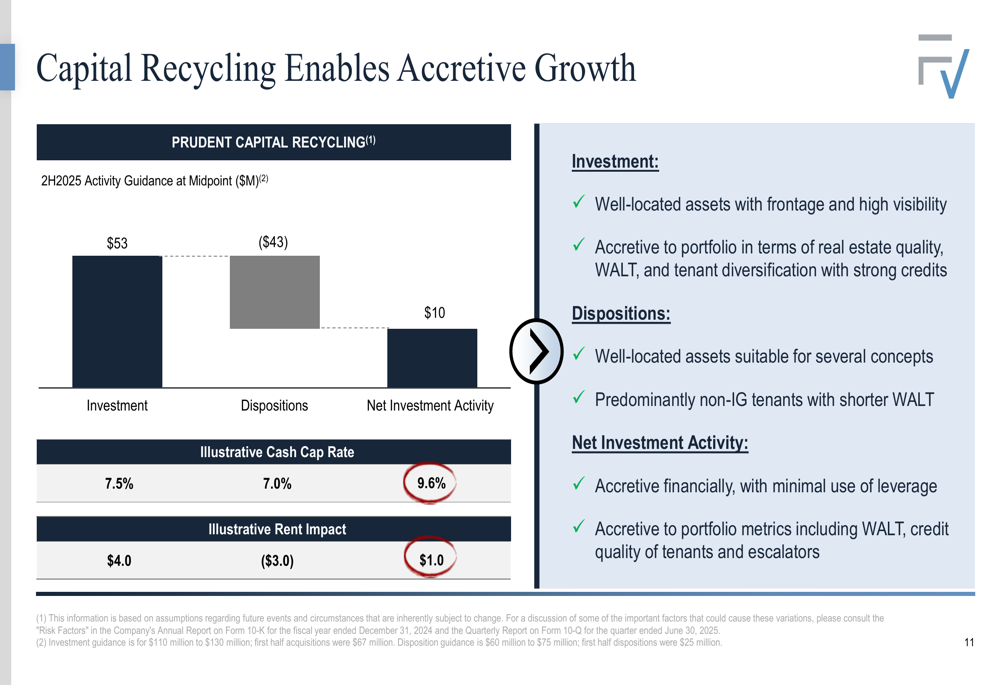
The company is implementing a strategic capital recycling program for the second half of 2025, with planned investments of $53 million at a 7.5% cap rate and dispositions of $43 million at a 7.0% cap rate. This approach is expected to be accretive to both financial results and portfolio metrics:
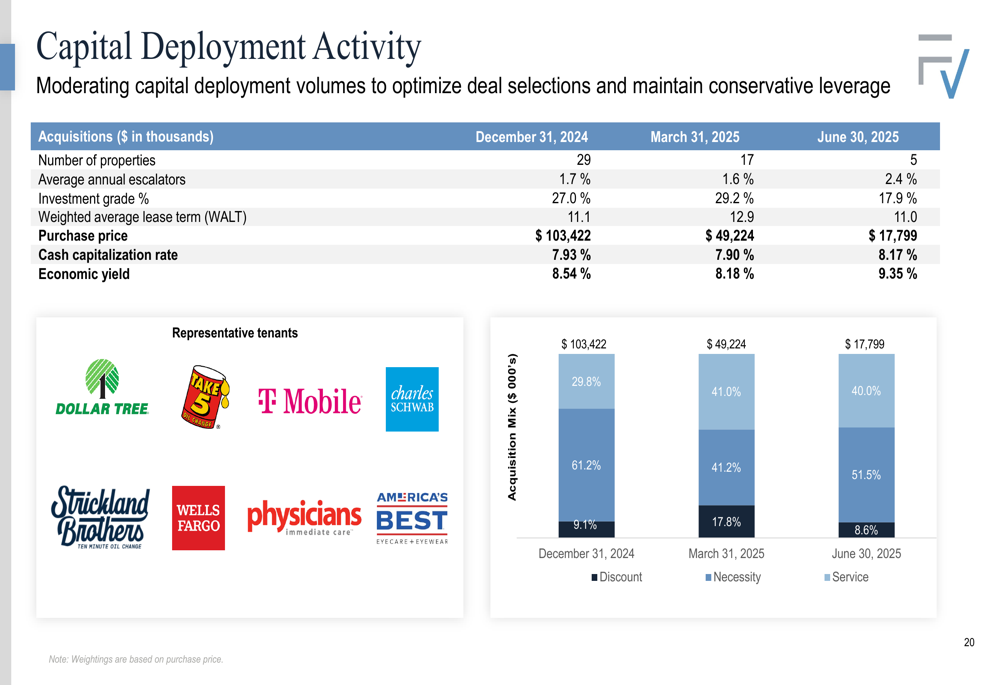
Recent acquisition activity has focused on well-located assets with strong tenant quality. As of June 30, 2025, acquisitions were completed at an attractive cash capitalization rate of 8.17% and economic yield of 9.35%:
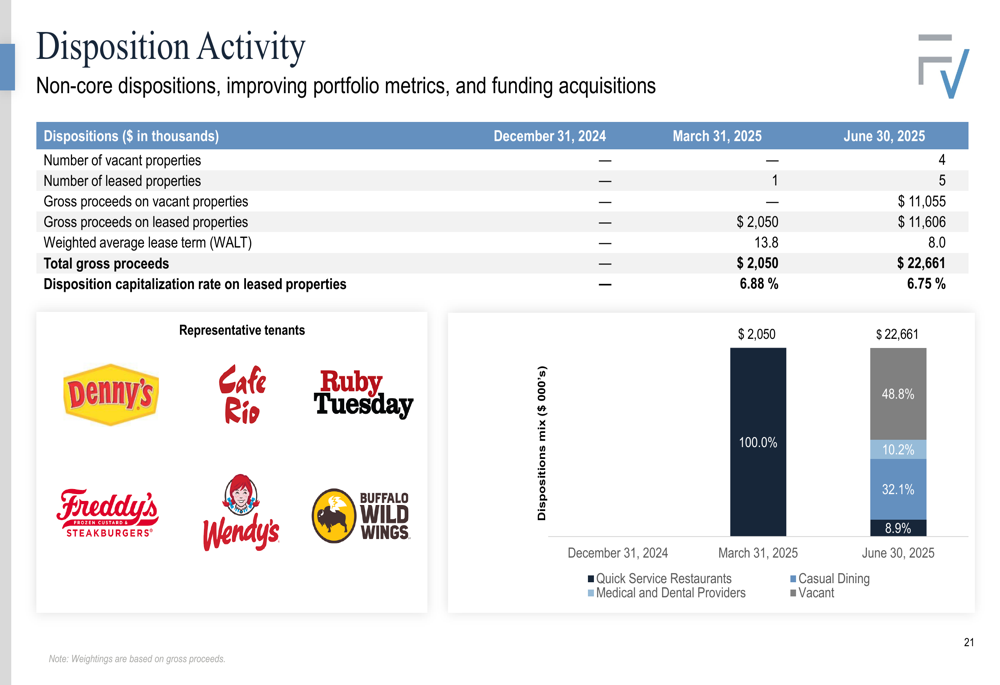
Simultaneously, the company has been divesting non-core assets, with disposition activity accelerating in Q2. These dispositions, completed at a capitalization rate of 6.75%, are improving overall portfolio metrics while providing capital for new acquisitions:
Valuation & Outlook
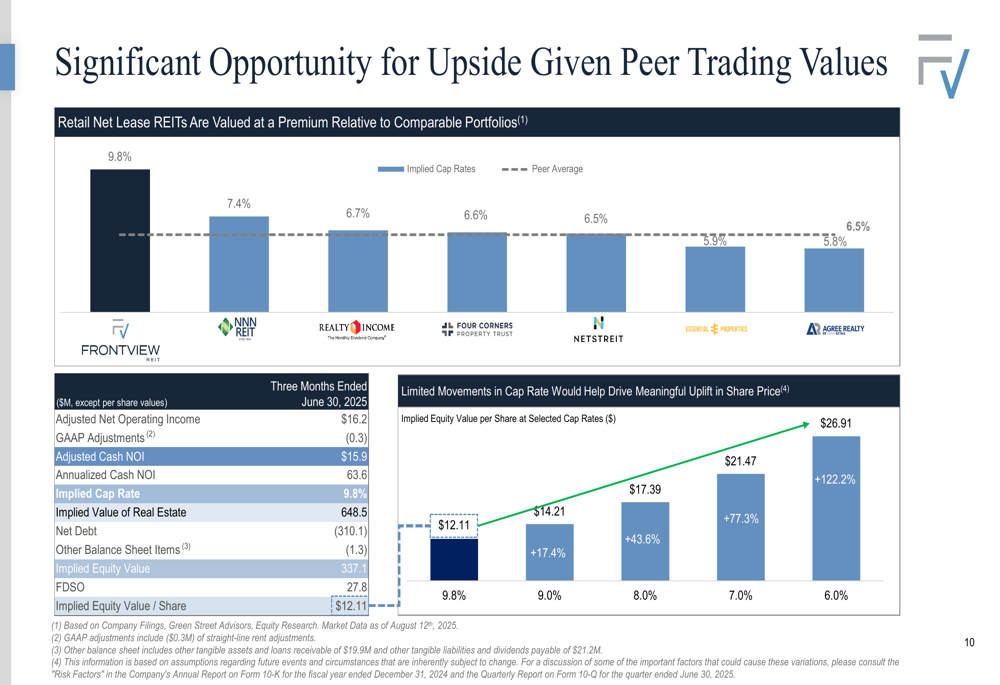
FrontView appears undervalued compared to peers, with its implied cap rate of 9.8% significantly higher than the peer average. The company’s valuation metrics show potential upside:
The valuation gap suggests significant potential appreciation if FrontView trades closer to peer valuations:
The company’s active asset management approach, combined with its strategic capital recycling program, positions it well for future growth. Management’s focus on properties with frontage provides a differentiated investment thesis in the net lease REIT sector.
FrontView’s improved Q2 metrics, including higher AFFO per share and occupancy rates, demonstrate operational progress despite the wider net loss. As the company continues to execute its strategy and optimize its portfolio through capital recycling, it may close the valuation gap with peers, potentially providing significant upside for investors from current price levels.
Full presentation:
This article was generated with the support of AI and reviewed by an editor. For more information see our T&C.