Index falls as earnings results weigh; pound above $1.33, Bodycote soars
Introduction & Market Context
General Motors (NYSE:GM) presented its Q2 2025 earnings results on July 22, 2025, highlighting market share gains and strong EV growth despite significant tariff headwinds. The company’s shares were down 3.21% in pre-market trading despite maintaining its full-year guidance, suggesting investor concerns about declining profitability metrics and ongoing tariff impacts.
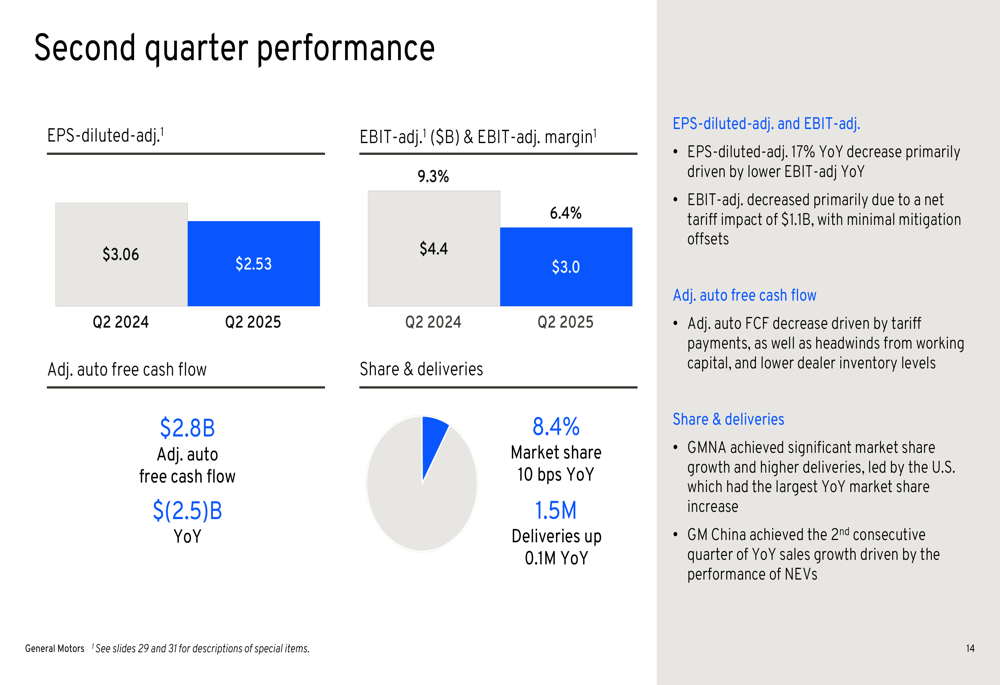
GM reported Q2 EBIT-adjusted of $3.0 billion, down from $4.4 billion in the same period last year, with EPS-diluted-adjusted of $2.53 compared to $3.06 in Q2 2024. The company attributed much of the decline to a $1.1 billion net tariff impact in the quarter.
Quarterly Performance Highlights
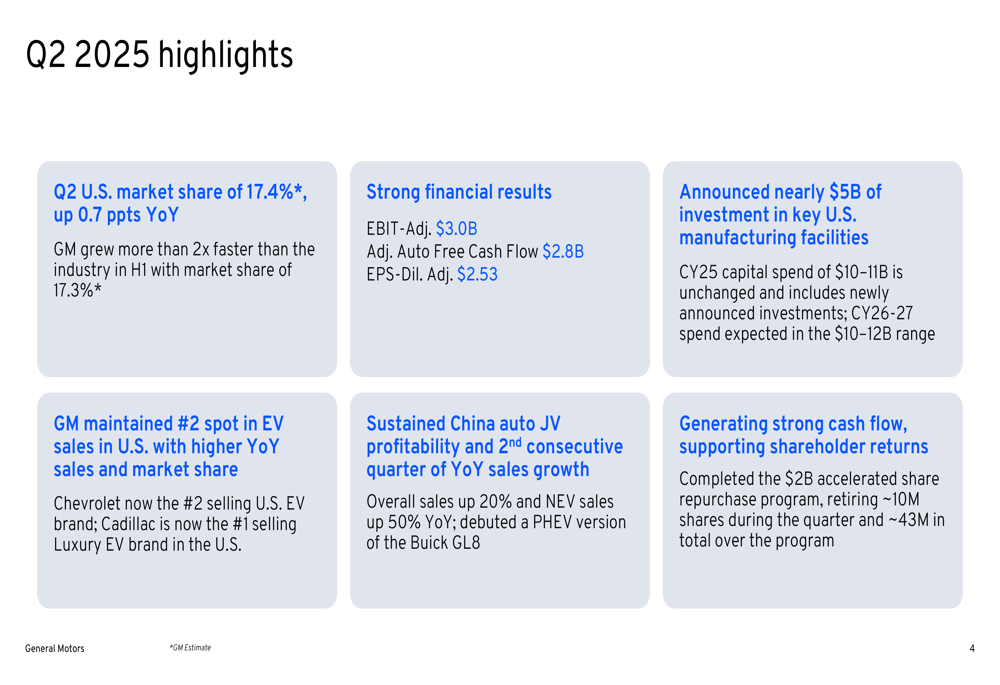
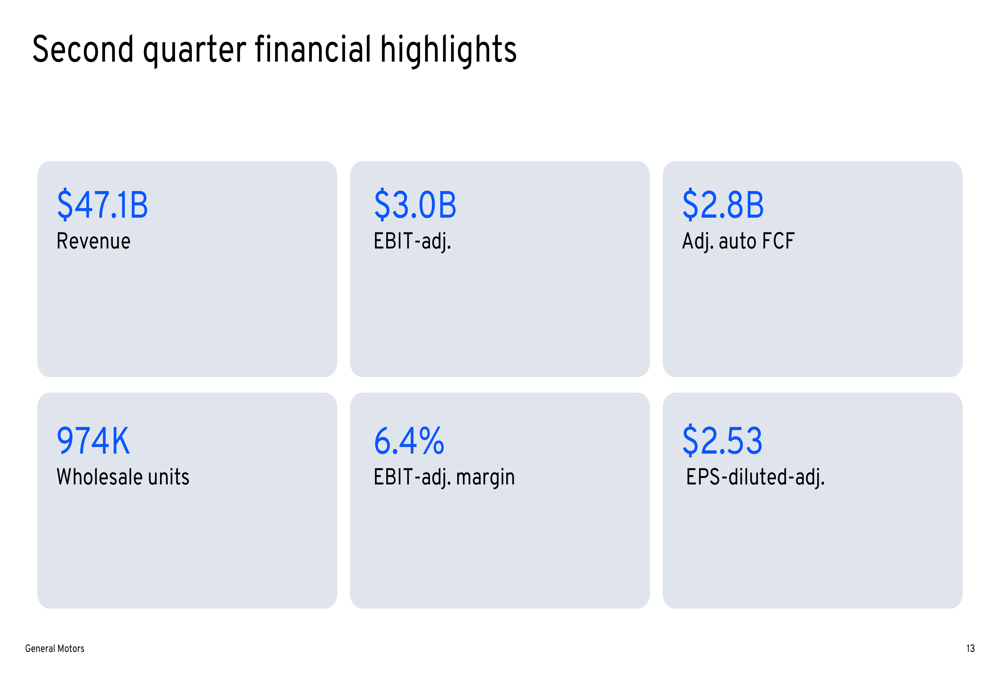
GM achieved several notable operational milestones in Q2 2025, including U.S. market share growth to 17.4%, up 0.7 percentage points year-over-year. The company maintained strong revenue of $47.1 billion and delivered adjusted automotive free cash flow of $2.8 billion.
As shown in the following comprehensive overview of key Q2 metrics:
The company’s financial results reflect both strengths and challenges. While revenue remained relatively stable, profitability metrics declined year-over-year, primarily due to tariff impacts.
The following slide provides a clear summary of the quarter’s financial performance:
GM’s EPS-diluted-adjusted decreased 17% year-over-year, with EBIT-adjusted margin declining to 6.4% from 9.3% in Q2 2024. The company noted that the $1.1 billion tariff impact represented approximately 3 percentage points of margin pressure.
Detailed Financial Analysis
Breaking down performance by region, GM North America (GMNA) delivered EBIT-adjusted of $2.4 billion, down from $4.4 billion in Q2 2024, with margins of 6.1%. GM International (GMI) improved to $0.2 billion from breakeven last year, driven primarily by improved profitability in China.
The following chart illustrates the regional EBIT-adjusted contributions:
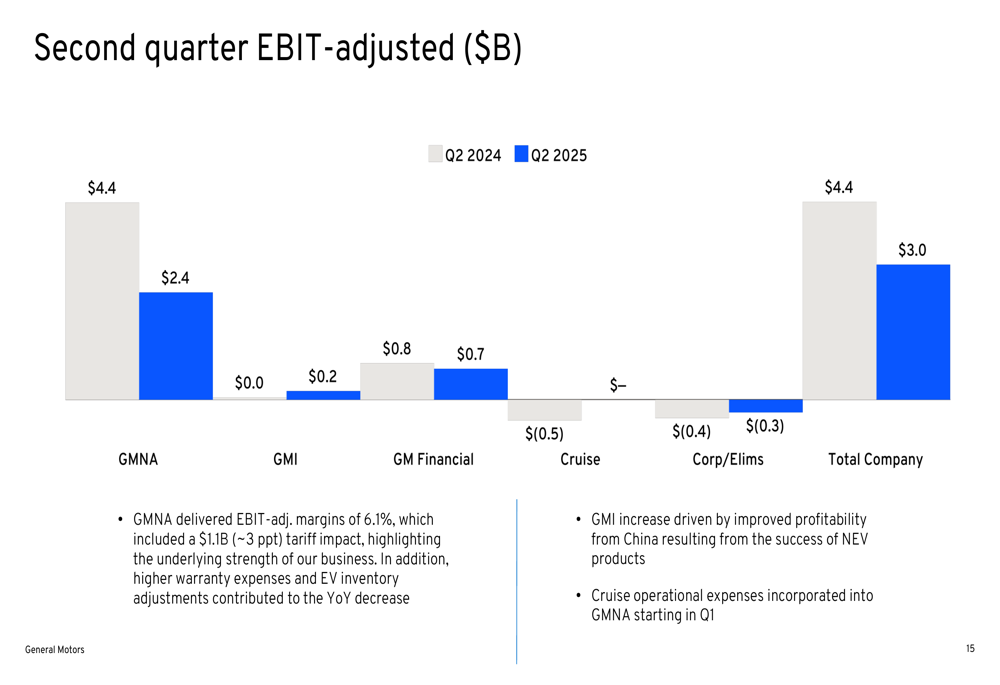
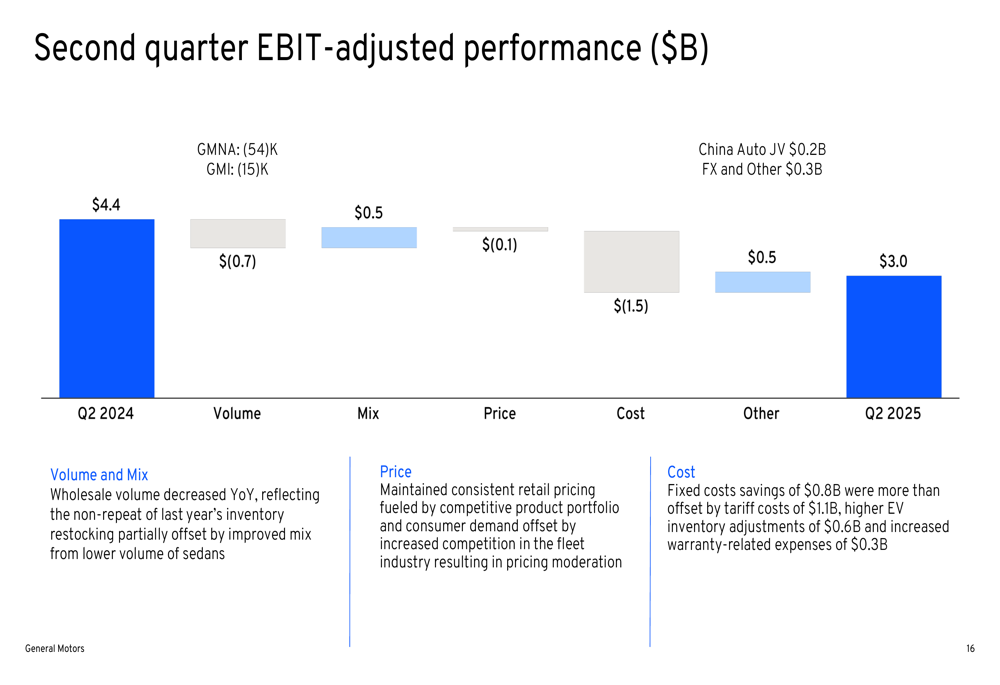
A waterfall analysis of the year-over-year EBIT-adjusted performance shows that cost increases of $1.5 billion (largely driven by tariffs) were the primary factor in the decline, partially offset by favorable mix ($0.5 billion) and other factors ($0.5 billion):
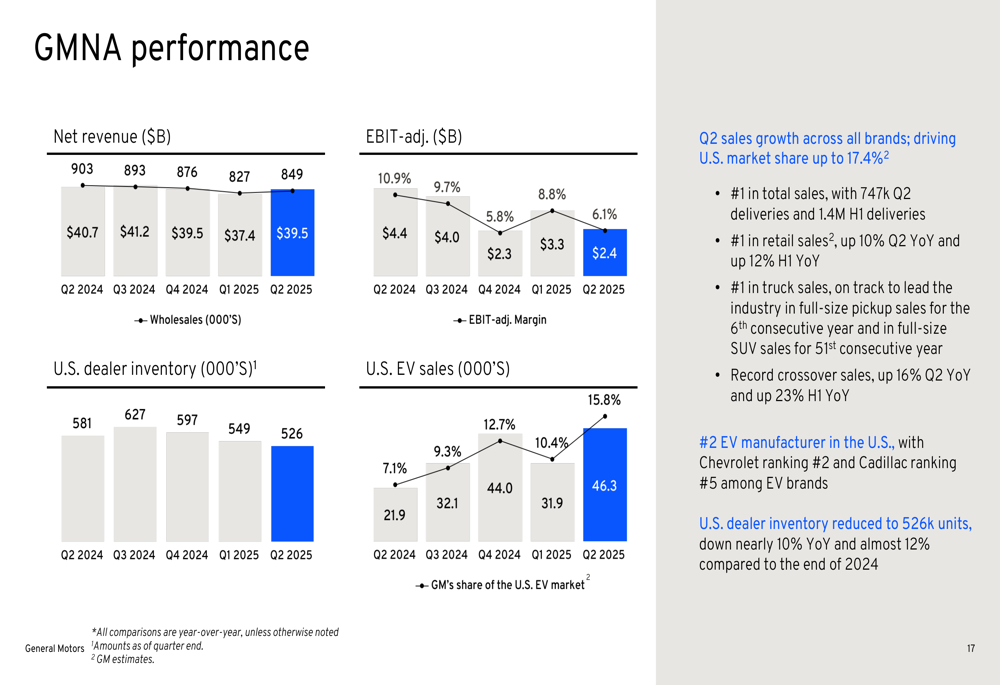
GM’s North American operations showed consistent revenue performance but declining EBIT-adjusted over recent quarters. U.S. dealer inventory decreased slightly to 526,000 units, while U.S. EV sales continued to grow significantly to 46,300 units in Q2 2025:
Strategic Initiatives
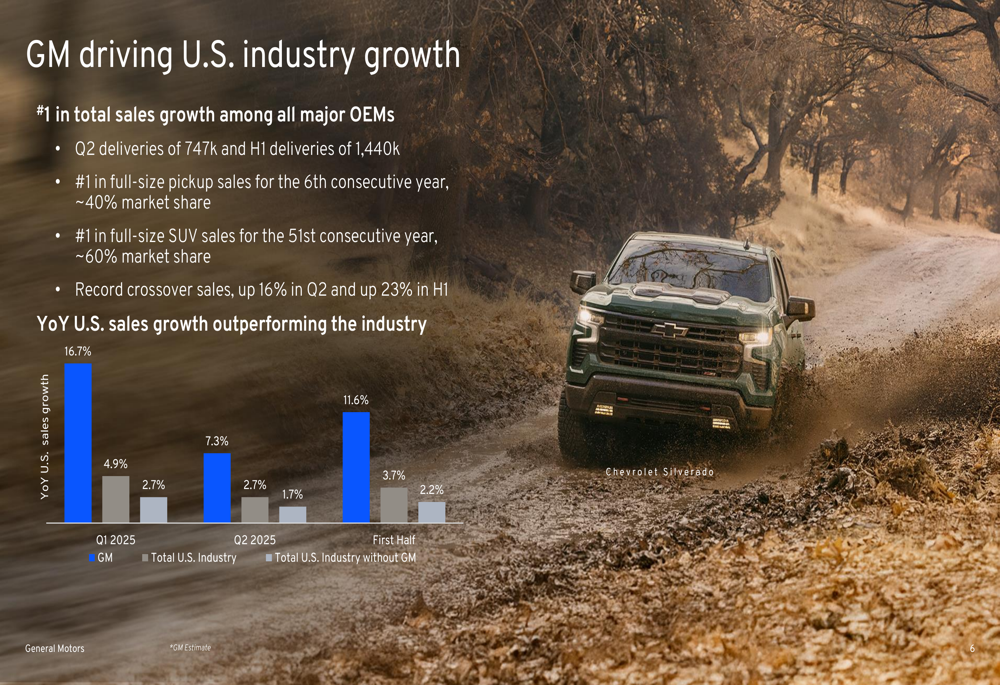
GM highlighted its leadership in the U.S. automotive market, outpacing industry growth by a significant margin. The company reported being #1 in total sales growth among major OEMs, with Q2 deliveries of 747,000 units and first-half deliveries of 1.44 million units.
As illustrated in the following chart comparing GM’s growth to the overall industry:
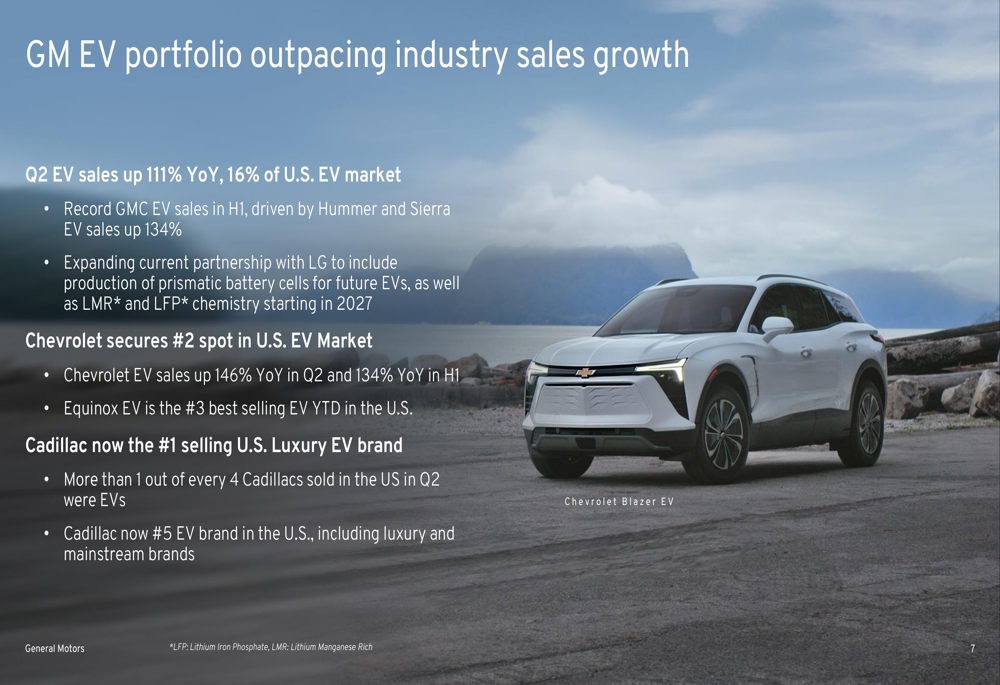
The company’s EV strategy is showing strong results, with Q2 EV sales up 111% year-over-year, capturing 16% of the U.S. EV market. Chevrolet secured the #2 spot in U.S. EV sales, while Cadillac became the #1 selling luxury EV brand in the country.
GM also announced nearly $5 billion of investments in key U.S. manufacturing facilities through 2027, including $4 billion for assembly plants in Michigan, Kansas, and Tennessee, plus approximately $900 million for next-generation V8 engine production in New York. The company emphasized that these investments will be made while maintaining its overall capital spending in the $10-12 billion range.
Forward-Looking Statements
Despite the tariff headwinds, GM maintained its full-year 2025 guidance, projecting EBIT-adjusted of $10.0-12.5 billion, EPS-diluted-adjusted of $8.25-10.00, and adjusted automotive free cash flow of $7.5-10.0 billion.
The following slide details the unchanged guidance and provides an update on tariff impacts:
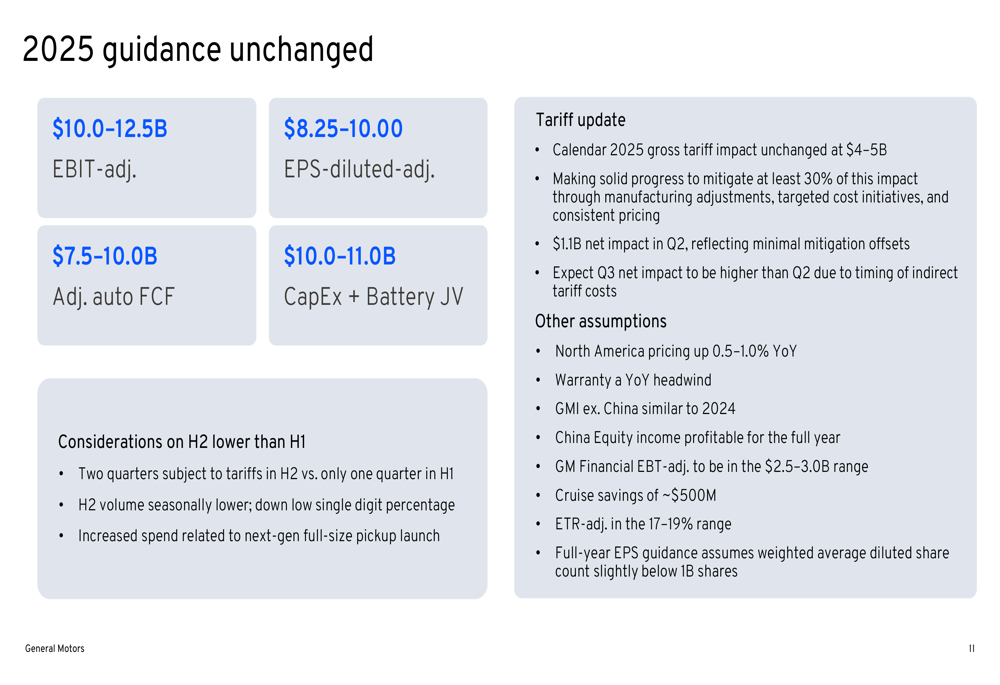
The company expects the calendar 2025 gross tariff impact to remain at $4-5 billion but noted progress in mitigating at least 30% of this impact through manufacturing adjustments, targeted cost initiatives, and consistent pricing. However, GM cautioned that the Q3 net tariff impact is expected to be higher than Q2 due to the timing of indirect tariff costs.
Competitive Industry Position
GM emphasized its disciplined go-to-market strategy, maintaining incentive spending below industry averages while achieving strong average transaction prices (ATPs) of more than $51,000 in both Q2 and the first half of 2025.
The company highlighted its market leadership positions, including:
- #1 in full-size pickup sales for the 6th consecutive year, with approximately 40% market share
- #1 in full-size SUV sales for the 51st consecutive year, with approximately 60% market share
- Record crossover sales, up 16% in Q2 and 23% in the first half
GM’s China operations showed continued improvement, with overall sales up 20% and new energy vehicle (NEV) sales up 50% year-over-year. The China auto joint venture delivered positive equity income for the third straight quarter, with the company expecting full-year profitability in this market.
In summary, GM’s Q2 2025 presentation demonstrates the company’s ability to grow market share and accelerate EV adoption despite significant tariff headwinds impacting profitability. While financial metrics show year-over-year declines, the maintained full-year guidance suggests confidence in the company’s ability to navigate these challenges in the second half of the year.
Full presentation:
This article was generated with the support of AI and reviewed by an editor. For more information see our T&C.